
The iM-Capital Strength 20-Stock Universe of the Russell 1000: Performance
- This Universe holds well capitalized companies with strong market positions, which pay good dividends, have price appreciation potential, and provide a degree of downside protection during bear markets.
- The Universe is reconstituted weekly, and consists of 20 large-cap stocks with Capital Strength type characteristics from the Russell 1000 Index.
- A backtest, without any buy- and sell-rules, from Jan-2000 to end of Jun-2017 showed a 10.0% annualized return with a maximum drawdown of -41.5%.
- A comparison with Vanguard’s large-cap ETFs older than 10 years shows that for periods 1-year and longer the Universe would have produced higher returns than any of the five ETFs.
Beating Vanguard’s Large-Cap ETFs with a Tax Efficient Capital Strength Portfolio of the Russell 1000
- This system invests in well capitalized companies with strong market positions, which pay good dividends, have price appreciation potential, and provide a degree of downside protection during bear markets.
- The portfolio is quarterly rebalanced and reconstituted, and consists of six large-cap stocks with Capital Strength type characteristics from the Russell 1000 Index, typically held for at least one year.
- A backtest, from Jan-2000 to end of Jun-2017, showed a 17.7% annualized return with a maximum drawdown of -23.3% and a low average annual turnover of about 70%.
- A comparison with Vanguard’s large-cap ETFs older than 10 years shows that for all listed investment periods the Portfolio would have produced higher returns than any of the five ETFs.
Performance Update of the Best10(VDIGX)-Trader: Trading the Stocks of the Vanguard Dividend Growth Fund – VDIGX
- The Vanguard Dividend Growth Fund-VDIGX is closed to new investors. Want-to-be investors can possibly do better than the fund by investing only in a few positions of the fund’s holdings.
- The iM-Best10(VDIGX)-Trader relies on the expertise of the Vanguard’s advisors to make the primary stock selection. VDIGX currently holds 45 large-cap stocks from which the Trader periodically picks its stocks.
- The Trader invests in the ten highest ranked stocks of VDIGX. This strategy, postulated in 2014, has produced to Jun-2017 a 3-year return of more than double that of VDIGX.
- The 3-year performance of the Trader was 64.1% versus 28.4% for VDIGX, giving an excess return of 35.7%. Trading frequency was low, with positions held on average for 126 days.
The iM-Standard 5 ETF Trader (Excludes Leveraged ETFs)
- This system always holds five ETFs (equity-, fixed income-, short equity-, and Gold-ETFs) selected according to stock market climate and rank.
- Typically, during good-equity markets it holds equity-ETFs, and during bad-markets fixed income-ETFs and/or short equity-ETFs. Also at times it can hold three gold-ETFs with other ETFs.
- A one factor ranking system selects five ETFs from a preselected list of 29 ETFs. A simulation from 2000 to 2017 shows a 24% annualized return with a maximum drawdown of -12%.
A Buy Signal from the iM-Enhanced Inflation Timer
- Stocks usually perform poorly when inflation is on the rise. We developed a market timer according to two inflation rate based rules. A buy signal has now emerged.
- Switching according to the signals between the S&P500 with dividends and a money-market fund would have provided from Aug-1953 to end of Jan-2017 an annualized return of 12.69%.
- Over the same period buy-and-hold of the S&P500 with dividends showed an annualized return of 10.08%, producing about a quarter of the total return of the Timer model.
- The Enhanced Inflation Timer uses one additional criterion in the buy rule for stocks (and sell rule for bonds); high-beta stocks must perform better than low-beta stocks.
How to Beat the First Trust Capital Strength ETF (FTCS) and Other Large-Cap ETFs with the Capital Strength Stocks of the Russell 1000
- This system invests in well capitalized companies with strong market positions, which pay good dividends, have price appreciation potential, and provide a degree of downside protection during bear markets.
- The portfolio holds six large-cap stocks selected from a universe of twenty Russell 1000 Index stocks with Capital Strength type characteristics, rebalanced quarterly in January, April, July and October.
- A backtest, from 7/6/2006 (inception of FTCS) to 5/31/2017, showed a 24.7% annualized return with a maximum drawdown of -25.7%, and low average annual turnover of about 80%.
- Over the same period the First Trust Capital Strength ETF (FTCS), which selects stocks from the NASDAQ Index, produced only 9.63% annualized return with a maximum drawdown of -53.6%.
- FTCS’s performance is not much better than that for SPY (the ETF tracking the S&P 500), which over this period returned 8.25% annualized, with a maximum drawdown of -55.2%.
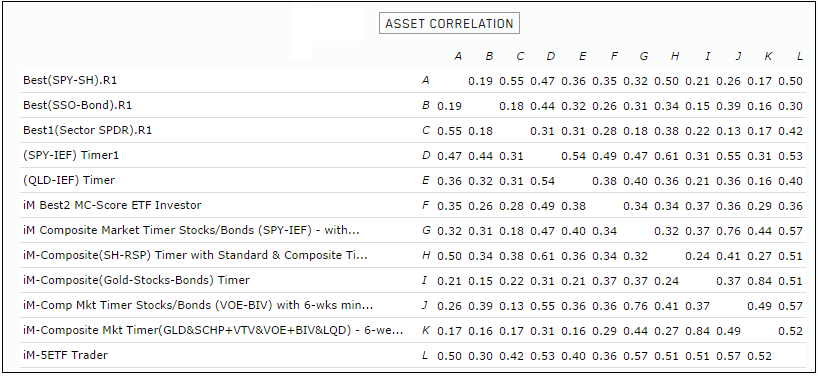
Correlation between the iM ETF Models
Currently we have 12 different ETF models at iMarketSignals. The various models and their correlation between them are shown below.
The iM-5 ETF Trader
- This system always holds five ETFs (equity-, fixed income-, leveraged equity-, short equity-, and Gold-ETFs) selected according to stock market climate and rank.
- Typically, during good-equity markets it holds equity-ETFs and/or leveraged-equity ETFs, and during bad-markets fixed income-ETFs and/or short equity-ETFs. Also at times it can hold three gold-ETFs with other ETFs.
- A one factor ranking system selects five ETFs from a preselected list of 33 ETFs. A simulation from 2000 to 2017 shows a 35% annualized return with a maximum drawdown of -13%.
The iM-Minimum Drawdown Combo
In our continued effort to satisfy request for low drawdowns models with reasonable turnover and good returns we provide this model, which combines:
- the iM-Composite Timer (SPY-IEF),
- the iM-Composite Timer(GLD&SCHP+VTV&VOE+BIV&LQD) based on the iM-Composite (Gold-Stocks-Bond) Timer,
- the iM-Composite-(SH-RSP) Timer,
- the iM-Best7(HiD-LoV).
- This combination model always holds four ETFs approximately equal weight at any time and seven S&P 500 stocks.
The combo showed a simulated 22.2% annualized return with a maximum drawdown of -7.7% when backtested from Jan-2000 to Apr-2017.
The iM-Low Turnover Composite Timer Combo
In an effort to satisfy request for low turnover models with low drawdowns and reasonable returns we provide this model, which combines:
- the iM-Comp Mkt Timer Stocks/Bonds (VOE-BIV) based on the iM-Composite Timer (SPY-IEF) which holds only one ETF at any time (33% weight in the combo),
- and the iM-Composite Mkt Timer(GLD&SCHP+VTV&VOE+BIV&LQD) based on the iM-Composite (Gold-Stocks-Bond) Timer which holds two ETFs concurrently (67% weight in the combo).
- This combination model always holds two or three ETFs at any time for a minimum period of six weeks before any of them can be sold.
The combo showed a 17.6% annualized return with a maximum drawdown of -11.2% when backtested from Jan-2000 to Mar-2017 on the simulation platform Portfolio 123.
Improvements to the iM HiD-LoV-7 System
- The system screens for high dividend, low volatility S&P 500 stocks yielding significantly more than the average yield of the index and which also have a low 3-yr beta.
- Market timing rules related to our long-period backtest models, the MAC-US Timer, CAPE-Cycle-ID, and Inflation Timer have been incorporated into the model’s algorithm, and turnover has been modestly increased by introducing an additional sell signal based on volatility.
- The 16.5 year backtest of the original iM HiD-LoV-7 System produced annualized return of about 22% with a maximum drawdown of -34%, whereas the improved model provided annualized return of about 25% with a maximum drawdown of -14% over the same backtest period. (Figure-3a)
Updated: Timing the Stock Market with the Inflation Rate
- Stocks usually perform poorly when inflation is on the rise. Using the inflation rate, we developed a market timer according to two simple rules.
- Switching according to the Timer signals between the S&P500 with dividends and a money-market fund would have provided from Aug-1953 to end of Jan-2016 and annualized return of 12.69%.
- Over the same period buy-and-hold of the S&P500 with dividends showed an annualized return of 10.08%, producing about a quarter of the total return of the Timer model.
The MAC-US Timer – a Moving Average Crossover System of the S&P 500
- Switching between stocks and bonds as signaled by a simple moving average crossover system of the S&P 500 – the MAC-US Timer – produces significantly higher returns than buy-and-hold stocks.
- The model has been updated from Aug-1965 to Jan-2017, conservatively assuming that funds are placed in the money market when not in the stock market.
Timing the Stock Market with the Inflation Rate
- Stocks usually perform poorly when inflation is on the rise. Using the inflation rate, we developed a market timer according to two simple rules.
- Switching according to the Timer signals between the S&P500 with dividends and a money-market fund would have provided from Aug-1953 to end of Jan-2016 and annualized return of 12.48%.
- Over the same period buy-and-hold of the S&P500 with dividends showed an annualized return of 10.08%, producing about a quarter of the total return of the Timer model.
The iM Composite Timer Gold-Stocks-Bonds
- This model uses the rules of the iM-Gold Timer and the iM-Composite Market Timer to signal periodic investments in gold, stocks and bonds.
- From Jan-2000 to Jan-2017 the Gold Timer signaled eight gold investment periods totaling only 9.3 years, while for the remaining periods totaling 7.7 years the model would have been in cash.
- During the “cash periods” the Composite Market Timer provides the signals when to invest in stock and/or bond ETFs. Bond ETFs include the ETF (XLU) are also selected according to the prevailing Market Climate Score (MC-Score) and a ranking system.
The Long Leading Recession Indicator DAGS is signaling an oncoming Recession.
On January 20, 2017, our long leading recession indicator DAGS signaled an oncoming recession.
Based on past history a recession could start at the earliest in 6 months (July-2017), but not later than 28 months from now (May-2019). The average lead time to previous recessions provided by DAGS would have been 15 months.
Forecasting Stock Market Returns with Shiller’s CAPE Ratio and its 35-Year Moving Average
- Shiller’s Cyclically Adjusted Price to Earnings Ratio (CAPE ratio) is at 27.8, which is 11.1 above its long-term mean of 16.7, signifying overvaluation of stocks and low forward returns.
- The alternative CAPE ratio methodology offered in this article references stock market valuation to a 35-year moving-average of the Shiller CAPE ratio instead of to the 1881-2016 fixed long-term mean.
- The latest CAPE ratio predicts a 10-year annualized real return of only 1.5%, whereas the presented methodology forecasts 5.8%, similar to the long-term market trend expected real return of 5.4%.
The iM Gold-Timer – Rev1
We have revised the iM Gold-Timer. The timer endeavors to signal long-term investment periods for Gold. It uses the SPDR® Gold Shares ETF: GLD. When not invested in GLD the model goes to 100% cash.
Timing the Stock Market with the Shiller CAPE
- The Shiller CAPE (cyclically adjusted price-earnings ratio) is typically regarded as a stock market valuation measure. When the CAPE is high stocks are supposed to be expensive, and vice-versa.
- The CAPE itself is not a good stock market timer. However, the CAPE can indirectly be used for market timing by determining a Cycle-ID as formulated by Theodore Wong.
- Our 1950-2016 backtest of the CAPE-Cycle-ID model, when switching between the S&P500 with dividends and the money market, showed an annualized return of 11.9%, versus 10.4% for buy-and-hold.
On Track for 2.5% Inflation by December 2016; Update November 2016.
- On September 19, we estimated an inflation rate of 2.5% for December 2016, and 1.4% for September 2016.
- Actual September inflation came in at 1.5%, the December inflation estimate remains at 2.5%.
- With inflation rising, and markets uncertain, Treasury Inflation Protected funds (TIPS) should remain a reasonably safe investment. Conventional bond funds are expected to perform worse than TIPS funds.