
- Reliance on a single market timer could be risky. The risk can be reduced with a composite timer whose component timers use different, uncorrelated, financial and economic data.
- From 2001 to 2016 switching between bonds and stocks using a composite timer would have produced an average annual return of 19.7% versus only 5.2% for buy & hold stocks.
For the period 2001-2016 the buy&hold strategy no longer worked! It is likely that it will also not work in the future due to increasing stock market volatility. For this reason some investor use simple market timing, mostly momentum driven, to exit and enter the markets according to market direction. Relying on one market timer only, such as a moving average cross over, is risky. Instead many uncorrelated market timing strategies can be combined into a robust composite market timing model. We introduced six such component timers using the following:
- Unemployment Rate (UNEMP) (detailed description),
- Performance of the Hi-Beta and Lo-Beta stocks of the S&P 500, (detailed description)
- TED Spread,
- Market Climate Score,
- iM Standard Timer,
- CBOE Volatility Index VIX.
Composite Market Timer
The iM Composite Market Timer combines six timers based on the above indicators. Each component timer references a different causal set. The correlation of the models’ simulated performances is low. This provides for greater tolerance and robustness in case of some temporary data distortion of a component timer.
The component models are weighted: models 1. and 2. above each contribute 25, and the other four (3. thru 6.) 12.5 each, totaling 100 for the six models when all of them were to simultaneously signal investment in the stock market. No special curve-fitting or optimization routines where used.
An entry signal for the stock market arise when the combined weight of the six models is equal to, or greater than 50. Therefore, the minimum requirement for investment in stocks is when:
- both 1. and 2. are invested,
- either 1. or 2. is invested plus at least two of the four (3. thru 6.) are invested,
- or, when all of the four (3. thru 6.) are invested and both 1. and 2. are not invested.
Performance of the Composite Market Timer
The model was backtested using the on-line portfolio simulation platform Portfolio 123, which also provides extended price data for ETFs prior to their inception dates calculated from their proxies.
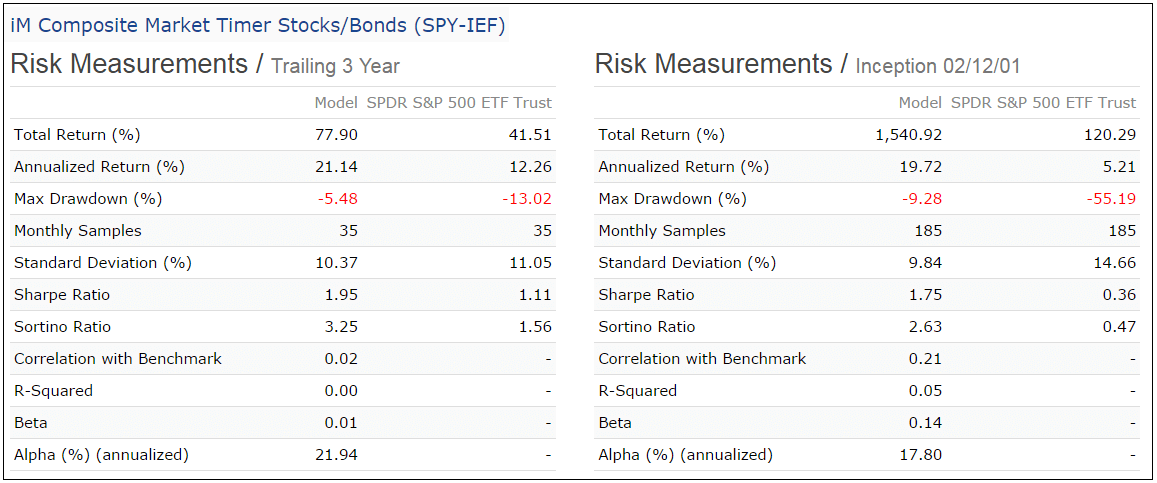
The simulated performance using this indicator and switching between SPDR S&P 500 ETF (SPY), the ETF tracking the S&P 500, and the iShares 7-10 Year Treasury Bond (IEF) is shown in the figure below. The red graph represents the performance of the model from Feb-2001 to Aug-2016.

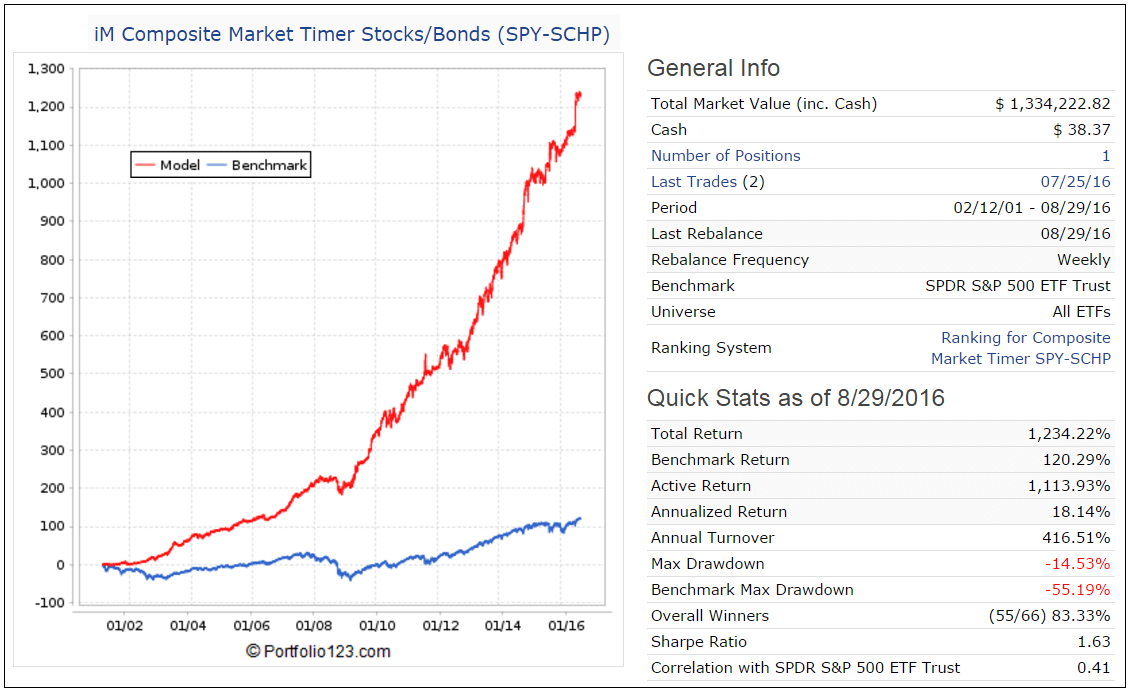
The simulation shows an annualized return of 19.7% with a maximum drawdown of -9.3%, and an average 4-times annual turnover. Trading costs and slippage were not included. Performance of this model is not significantly affected by the choice of bond fund. See the Appendix for performance when using Inflation-Protected Bond – Schwab US TIPS ETF (SCHP).
The relative smoothness of the performance graph indicates that the six component models are indeed much diversified. Table-1 below compares the Composite Timer and the component timers. It clearly shows the improvements gained by adopting composite market timing.
| Table 1: Performance from February 2001 to August 2016. | |||||||
|---|---|---|---|---|---|---|---|
| CMPST Timer |
UNEMP Timer |
Hi-Lo Beta Timer |
TED Spread Timer |
MC-Score Timer |
iM Std Timer |
VIX Timer |
|
| Total Return: | 1,541% | 729% | 524% | 311% | 393% | 474% | 165% |
| Benchmark Return: | 120% | 120% | 120% | 120% | 120% | 120% | 120% |
| Active Return: | 1,421% | 608% | 404% | 191% | 272% | 354% | 45% |
| Annualized Return: | 19.7% | 14.6% | 12.5% | 9.5% | 10.8% | 11.9% | 6.5% |
| Annual Turnover: | 416% | 206% | 269% | 146% | 234% | 338% | 482% |
| Max Drawdown: | -9.3% | -19% | -16% | -37% | -14% | -27% | -23% |
| SPY Max Drawdown: | -55% | -55% | -55% | -55% | -55% | -55% | -55% |
| Overall Winners: | (52/66) 79% |
(28/34) 82% |
(29/44) 66% |
(18/24) 75% |
(29/38) 76% |
(40/55) 73% |
(46/77) 60% |
| Sharpe Ratio: | 1.75 | 1.13 | 1.12 | 0.77 | 1.11 | 0.99 | 0.56 |
| Correlation With SPY: | 0.21 | 0.46 | 0.33 | 0.56 | 0.11 | 0.33 | 0.09 |
Conclusion
From the analysis it appears that the iM Composite Market Timer can profitably be used to switch between stocks and bonds. iMarketSignals will report weekly the status of this timer.
Rising interest rates with concurrent diminishing returns from bonds may reduce the effectiveness of this model. Although this model performed well over the last 15 years, there is no evidence that it would have produced similar returns before the backtest period, nor is there a guarantee that it will perform well in the future.
Appendix
Trading Statistics
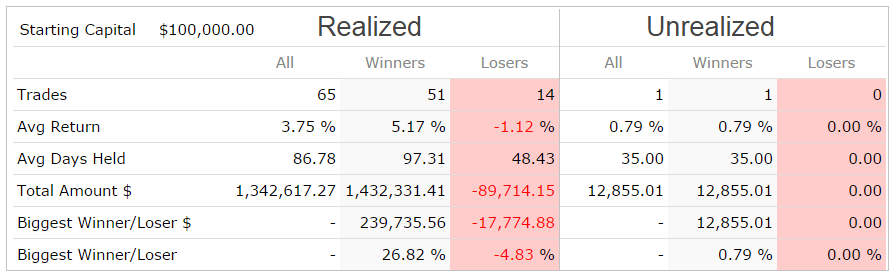
Over the backtest period (Feb-2001 to Aug-2016) there were only 65 completed trades, 51 winners, and 14 losers. The maximum loss for any position was -4.8%. The average holding period of a position was about 3 months.
Risk Measurements
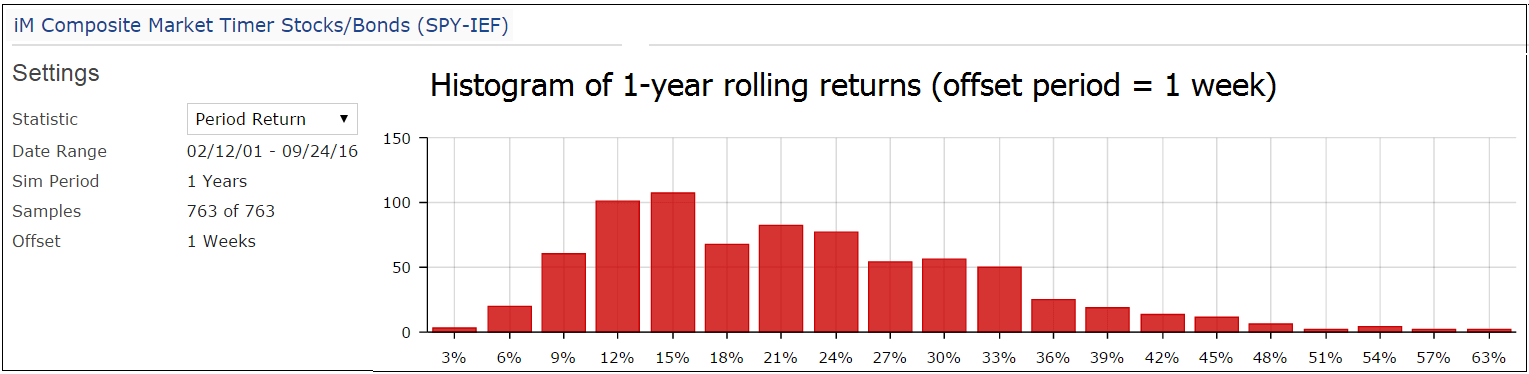
Rolling Returns
There were no negative returns over any 1-year period as shown in the histogram below. The lowest return was 3% and the highest 63%.
Performance with Alternative Bond Fund
Performance with Inflation-Protected Bond – Schwab US TIPS ETF (SCHP)
Realized Trades
This table has been updated to 9/30/2016. There were 66 realized trades from Feb-2001 to Sep-2016.
| Symbol | Open | Close | Days | Gain |
| IEF | 9/6/2016 | |||
| SPY | 8/1/2016 | 9/6/2016 | 36 | 0.76% |
| IEF | 7/18/2016 | 8/1/2016 | 14 | 0.36% |
| SPY | 6/27/2016 | 7/18/2016 | 21 | 8.42% |
| IEF | 11/30/2015 | 6/27/2016 | 210 | 6.34% |
| SPY | 11/9/2015 | 11/30/2015 | 21 | 0.29% |
| IEF | 9/8/2015 | 11/9/2015 | 62 | -1.23% |
| SPY | 8/24/2015 | 9/8/2015 | 15 | 4.18% |
| IEF | 7/20/2015 | 8/24/2015 | 35 | 2.84% |
| SPY | 7/6/2015 | 7/20/2015 | 14 | 2.84% |
| IEF | 6/8/2015 | 7/6/2015 | 28 | 0.83% |
| SPY | 5/4/2015 | 6/8/2015 | 35 | -1.35% |
| IEF | 12/22/2014 | 5/4/2015 | 133 | 0.30% |
| SPY | 10/13/2014 | 12/22/2014 | 70 | 10.67% |
| IEF | 9/29/2014 | 10/13/2014 | 14 | 2.10% |
| SPY | 4/15/2013 | 9/29/2014 | 532 | 26.82% |
| IEF | 4/1/2013 | 4/15/2013 | 14 | 1.13% |
| SPY | 8/27/2012 | 4/1/2013 | 217 | 10.21% |
| IEF | 7/2/2012 | 8/27/2012 | 56 | -0.14% |
| SPY | 1/30/2012 | 7/2/2012 | 154 | 3.89% |
| IEF | 8/22/2011 | 1/30/2012 | 161 | 2.09% |
| SPY | 8/8/2011 | 8/22/2011 | 14 | 0.42% |
| IEF | 5/16/2011 | 8/8/2011 | 84 | 6.15% |
| SPY | 9/13/2010 | 5/16/2011 | 245 | 17.93% |
| IEF | 8/30/2010 | 9/13/2010 | 14 | -1.60% |
| SPY | 6/7/2010 | 8/30/2010 | 84 | -0.22% |
| IEF | 5/17/2010 | 6/7/2010 | 21 | 2.42% |
| SPY | 1/25/2010 | 5/17/2010 | 112 | 3.79% |
| IEF | 12/28/2009 | 1/25/2010 | 28 | 1.81% |
| SPY | 11/30/2009 | 12/28/2009 | 28 | 2.53% |
| IEF | 11/16/2009 | 11/30/2009 | 14 | 1.41% |
| SPY | 11/2/2009 | 11/16/2009 | 14 | 6.60% |
| IEF | 10/19/2009 | 11/2/2009 | 14 | -1.03% |
| SPY | 10/5/2009 | 10/19/2009 | 14 | 5.55% |
| IEF | 6/1/2009 | 10/5/2009 | 126 | 3.41% |
| SPY | 3/23/2009 | 6/1/2009 | 70 | 15.26% |
| IEF | 7/2/2007 | 3/23/2009 | 630 | 18.55% |
| SPY | 3/5/2007 | 7/2/2007 | 119 | 10.47% |
| IEF | 2/5/2007 | 3/5/2007 | 28 | 2.08% |
| SPY | 10/2/2006 | 2/5/2007 | 126 | 8.83% |
| IEF | 5/22/2006 | 10/2/2006 | 133 | 2.78% |
| SPY | 2/13/2006 | 5/22/2006 | 98 | -0.23% |
| IEF | 1/30/2006 | 2/13/2006 | 14 | -0.70% |
| SPY | 1/3/2006 | 1/30/2006 | 27 | 1.37% |
| IEF | 9/19/2005 | 1/3/2006 | 106 | -1.21% |
| SPY | 8/29/2005 | 9/19/2005 | 21 | 1.15% |
| IEF | 7/25/2005 | 8/29/2005 | 35 | 0.32% |
| SPY | 4/18/2005 | 7/25/2005 | 98 | 7.59% |
| IEF | 8/23/2004 | 4/18/2005 | 238 | 0.05% |
| SPY | 8/9/2004 | 8/23/2004 | 14 | 2.99% |
| IEF | 7/19/2004 | 8/9/2004 | 21 | 0.65% |
| SPY | 7/6/2004 | 7/19/2004 | 13 | -1.47% |
| IEF | 6/7/2004 | 7/6/2004 | 29 | 1.98% |
| SPY | 5/3/2004 | 6/7/2004 | 35 | 2.28% |
| IEF | 4/5/2004 | 5/3/2004 | 28 | -2.18% |
| SPY | 9/29/2003 | 4/5/2004 | 189 | 14.14% |
| IEF | 6/16/2003 | 9/29/2003 | 105 | -4.83% |
| SPY | 5/19/2003 | 6/16/2003 | 28 | 9.72% |
| IEF | 5/5/2003 | 5/19/2003 | 14 | 3.08% |
| SPY | 3/31/2003 | 5/5/2003 | 35 | 9.78% |
| IEF | 12/2/2002 | 3/31/2003 | 119 | 3.51% |
| SPY | 11/18/2002 | 12/2/2002 | 14 | 4.03% |
| IEF | 11/4/2002 | 11/18/2002 | 14 | 0.23% |
| SPY | 10/21/2002 | 11/4/2002 | 14 | 1.06% |
| IEF | 9/16/2002 | 10/21/2002 | 35 | -1.89% |
| SPY | 9/3/2002 | 9/16/2002 | 13 | 1.82% |
| IEF | 2/13/2001 | 9/3/2002 | 567 | 17.58% |
What level membership will be required to access this strategy on an ongoing basis? Thanks.
Gold membership is required to follow the iM-Composite and its six component timers.
I love the idea of multiple factors in a market timing model. Any idea if SH was substituted for IEF what the results would be. Keep up the great work.
Return is about the same, but max D/D is worse. Best option is to go with bond funds appropriate to current market climate. Possibly TIPS.
Very interesting strategy.What does return/drawdown look like if Spy/cash used instead of a Spy/bond combination.Thank you.
Using SPY-SHV:
return= 14.4%
max D/D= -9.3%
That is interesting. Does that set of results beat using all seven timers equally weighted 1/7 each in a book?
Tom C
A backtest with all 7 timers equal weighted in a book shows:
Annualized Return= 12.5%
max D/D= -8%
Georg
I’ve been using the Standard Market Timer to know when to hedge. Do the results of the tests with this new Composite Market Timer suggest that I should be using it instead of the SMT now??
Thanks
Vman
We can’t make any investment recommendations. You have to consider that the Composite Market Timer has many more hedge signals (70 from 2000-2016) than the iM Standard Timer, that is why it provided higher returns in the backtest.
Georg,
Could you publish yearly returns breakdown for this this?
Thanks
Annualized Performance by Calendar Year SPY-IEF with 1% slippage
Year ___ Return (%)
2000 ___ 10.36
2001 ___ 6.74
2002 ___ 19.88
2003 ___ 32.08
2004 ___ 9.83
2005 ___ 10.58
2006 ___ 12.01
2007 ___ 27.73
2008 ___ 17.87
2009 ___ 36.58
2010 ___ 20.82
2011 ___ 16.84
2012 ___ 6.2
2013 ___ 34.15
2014 ___ 22.63
2015 ___ 8.86
Do you give your subscribers a specific statement as to whether they should buy or sell or do you simply let them know what the numbers are and let them take appropriate action?
Also, is the program fully functional at the present time?
Thanks
The iM Composite Timer and its six component timers are updated Sundays. Subscribers are informed by email as to their holdings also on Sundays, and a confirming email is sent on the first trading day of the week as well.
Also on the iM home page, under “Most Recent Updates” the holdings are listed after the Sunday update has taken place. It is the 9th model from the top.
Subscribers must decide for themselves whether to follow the signals or not. The model has been “live” since Oct-2-2016.
Hi George,
How would this model work with leveraged etfs like tqqq and tmf?
These ETFs are too young for a backtest to be meaningful. Inception of TMF was 10/13/2015, and TQQQ was 2/11/2010.
George, bigcharts.com shows a chart going back to 2009. Could you run a backtest going back to 2009?
Not with the ETFs you mentioned before.
Were there any periods where all six timers pointed to IEF? If so, was there an edge to being short during those periods?
Tom C
A simulation (SPY-SH), with all timers having equal weight, gives good returns when four or more timers point to IEF. As in the (SPY-IEF) model minimum holding period was 2 weeks. Max Drawdown of -28% is not so great, but annualized return of 18.6% is good.
Shortly we will add another timer model (SH-RSP) based on the Composite and Standard Timers with much higher returns.
Total Return 1,656.37%
Benchmark Return 98.26%
Active Return 1,558.11%
Annualized Return 18.61%
Annual Turnover 389.96%
Max Drawdown -27.84%
Benchmark SPY Max Drawdown -55.19%
Overall Winners (49/66) 74.24%
Sharpe Ratio 1.05
Correlation with SPDR S&P 500 ETF Trust -0.41
George how would this model work switching between qqq and SCHP or IEF?
QQQ annualized return from Jan-2000 to Oct-2016 is only 1.85%. Max drawdown was about -80% in 2002 and 2009.
Applying the Composite Market Timer to QQQ-IEF produced the following simulated performance with 0.1% slippage:
General Info
Period 01/02/00 – 10/31/16
Benchmark Gugg S&P 500 Eq Wgt ETF
Ranking System Ranking for Composite Market Timer QQQ-SCHP
Quick Stats as of 10/31/2016
Total Return 2,043.38%
Benchmark Return 264.35%
Active Return 1,779.04%
Annualized Return 19.98%
Annual Turnover 411.34%
Max Drawdown -36.26%
Benchmark Max Drawdown -59.92%
Overall Winners (50/70) 71.43%
Sharpe Ratio 1.28
Correlation with Gugg S&P 500 Eq Wgt ETF 0.21
How do I sign up for the Composite Market Timer?
A Gold membership to iMarketSignals is required. Our Sunday email service provides trading signals for Monday. Signals are confirmed Monday morning.
Holdings are listed on our Home page – the ninths model from the top.
Does the Composite Market Timing system have a different name in your membership levels? I received this link: https://imarketsignals.com/2016/composite-market-timing-increases-returns-and-reduces-drawdown/
When I sign-up, I want to know that I am trading the correct system.
Sorry, our membership offer table has not been updated. The composite timer is included in the Gold subscription. Below an extract from today’s email the links above, which I added now, link to the relevant article. (The iM-(SH-RSP) Timer is based on the Composite Timer.) Same data can be found on the home page. I forwarded you the complete mail separately.
https://imarketsignals.com/2016/composite-market-timing-increases-returns-and-reduces-drawdown/
Timer
Beta
Spread
Score
IEF
SPY
https://imarketsignals.com/2016/market-timing-with-etfs-sh-and-rs/
Georg,
Is #5, “iM Standard Timer” of the 6 component system listed above, the same thing as the iM Standard Market Timer that is listed separately on your sight?
Thnx
No it is not the same model. As noted in the signal listing on the home page, the Component Standard Timer (STD) differs in some respects from the iM Standard Timer.
when you write “there is no evidence that it would have produced similar returns before the backtest period”, do you mean that you have not attempted to look beyond the study period show? or was the composite timer less effective prior to the study period? it would be an interesting study, if possible to backtest performance even farther.
thanks
I agree that it would be interesting to backtest from an earlier date. Unfortunately, the relevant data is not on P123 which is the backtest platform we use. So we don’t know how this model would have performed earlier in time.
Georg
Do you think this Composite Market Timer might be a better choice over the Standard Market Timer to indicate a hedge for the Best7(HiD-LoV) strategy??
Thanks
Vman
Simulated performance of Best7(HiD-LoV) when hedged with short SSO and Hedge Ratio 50%.
Hedged according to Standard Market Timer (10 hedge periods):
Annualized Return 32.33%
Annual Turnover 293.08%
Max Drawdown -16.68%
Overall Winners (217/310) 70.00%
Sharpe Ratio 1.93
Hedged according to Composite Market Timer (35 hedge periods):
Annualized Return 31.14%
Annual Turnover 344.18%
Max Drawdown -16.13%
Overall Winners (227/332) 68.37%
Sharpe Ratio 1.80
G
Perfect and many thanks……….Vman
How would this work with a leveraged etf such as sPXL?
We can backtest with UPRO.
Simulated performance from Jan-2000 to Nov-2016 for Comp Market Timer (UPRO-IEF) with 0.1% slippage:
Quick Stats as of 11/23/2016:
Total Return 38,483.27%
Benchmark SPY Return 131.66%
Active Return 38,351.62%
Annualized Return 45.47%
Annual Turnover 426.67%
Max Drawdown -27.26%
Benchmark Max Drawdown -55.19%
Overall Winners (51/68) 75.00%
Sharpe Ratio 1.56
That is truly remarkable George. Now what would be the results if a short ETF was used instead of IEF?
We have this model:
Market Timing with ETFs SH and RSP: Using the iM-Composite & Standard Market Timers’ Rules
https://imarketsignals.com/2016/market-timing-with-etfs-sh-and-rs/
Timer is in RSP
Update of 12/4/2016 iM-(SH-RSP) Timer No trades since 11/7/2016
Right now, you have the Composite Market Timer configured as a switch–either in or out of the stock market. Is it possible that you can reconfigure it as a market strength indicator? Then, when the market is strong, we could invest in 2x and 3x ETFs with less fear of being wiped out.
As an added safeguard one could only invest in leveraged ETFs according to the Composite Market Timer when the CAPE-Cycle-ID is 2 or 0.
https://imarketsignals.com/2016/timing-stock-market-shiller-cape/
Simulated performance for Composite Mkt Timer (UPRO-SHV) with 0.1% slippage:
(UPRO inception date was 6/23/2009. Values before that date are synthetic and possibly do not reflect the hypothetical performance of UPRO if it had an earlier inception date.)
Period 01/02/01 – 12/19/16
Rebalance Frequency Weekly
Benchmark SPDR S&P 500 ETF Trust
Quick Stats as of 12/19/2016:
Total Return 9,311.75%
Benchmark Return 137.60%
Active Return 9,174.15%
Annualized Return 32.94%
Annual Turnover 376.91%
Max Drawdown -27.26%
Benchmark Max Drawdown -55.19%
Overall Winners (33/63) 52.38%
Sharpe Ratio 1.32
Is there anyway you could calculate historic maximum drawdown and CAGR if one were to do a 50/50 split between SSO and SPY when the model is invested in SPY? So in essence it would be leveraged 1.5 times when in the market??? Thanks.
Yes this is easy to do. A combo of SPY-IEF and SSO-IEF, with weight 50:50.
Number of Assets 2
Period 02/12/01 – 01/05/17
Benchmark SPDR S&P 500 ETF Trust
Quick Stats as of 1/5/2017
Total Return 3,536.22%
Benchmark Return 130.91%
Active Return 3,405.31%
Annualized Return 25.37%
Max Drawdown -14.07%
Benchmark Max Drawdown -55.19%
Sharpe Ratio 1.67
Correlation with SPDR S&P 500 ETF Trust 0.31
But one would do better with RSP-IEF than with SPY-IEF.
Return of the combo becomes 27.04% with a max D/D of -15.03%
Thank you sir; I’m looking at various ways to use the timer efficiently with no trading fee etfs and found SPHB; is there a way to find CAGR and Max DD with that one??? Thanks!
SPHB has only been available since 5/5/2011. Below are backtests. RSP-IEF had the better max D/D and higher Sharpe. SPHB-IEF had the higher CAGR.
for SPHB-IEF
Period 05/05/11 – 01/09/17
Benchmark Gugg S&P 500 Eq Wgt ETF
Quick Stats as of 1/7/2017
Total Return 189.07%
Benchmark Return 88.47%
Active Return 100.60%
Annualized Return 20.56%
Annual Turnover 403.30%
Max Drawdown -24.25%
Benchmark Max Drawdown -22.88%
Overall Winners (15/25) 60.00%
Sharpe Ratio 1.36
for RSP-IEF
Period 05/05/11 – 01/09/17
Benchmark Gugg S&P 500 Eq Wgt ETF
Quick Stats as of 1/7/2017
Total Return 157.13%
Benchmark Return 88.47%
Active Return 68.65%
Annualized Return 18.09%
Annual Turnover 405.66%
Max Drawdown -11.13%
Benchmark Max Drawdown -22.88%
Overall Winners (19/25) 76.00%
Sharpe Ratio 1.71
Also, is that RSP/IEF also using 50% SSO to get those impressive results, or just RSP itself???
But one would do better with RSP-IEF than with SPY-IEF.
Return of the combo becomes 27.04% with a max D/D of -15.03%
The results are for a combo RSP-IEF and SSO-IEF, with weight 50:50.
What about a 50/50 SPY SSO with 50/50 IEF UST (2x EIF)? Thanks!
Oops, I meant 2x IEF.
ETF UST seeks (2x) the daily performance of the ICE U.S. 7-10 Year Bond Index. It has only been available since Feb-2010, which provides only a 7 year backtest period, which is too short.
Also why would one want to invest in a 2x leveraged bond ETF when interest rates are expected to rise?
Even if rates rise, in periods of market volatility, bonds usually rally. Isn’t that the entire point of the system??? Invest in IEF when out of SPY??? I though maybe there would be increased return by leveraging IEF without much increase in drawdown.
Could you backtest IJH/IEF and IJR/IEF? Those 2 ETFS generate more alpha than SPY, are commission free, and have a long history. Thanks! I really appreciate the info you provide.
BACKTESTS FROM 1/2/2001
IJR-IEF
Period 01/02/01 – 01/23/17
Benchmark SPDR S&P 500 ETF Trust
Ranking System Ranking for Composite Market Timer IJR-IEF
Quick Stats as of 1/22/2017
Total Return 2,735.11%
Benchmark Return 139.40%
Active Return 2,595.71%
Annualized Return 23.16%
Annual Turnover 408.25%
Max Drawdown -11.64%
Benchmark Max Drawdown -55.19%
Overall Winners (51/66) 77.27%
Sharpe Ratio 1.74
IJH-IEF
Period 01/02/01 – 01/23/17
Benchmark SPDR S&P 500 ETF Trust
Ranking System Ranking for Composite Market Timer IJH-IEF
Quick Stats as of 1/22/2017
Total Return 2,085.90%
Benchmark Return 139.40%
Active Return 1,946.50%
Annualized Return 21.18%
Annual Turnover 408.40%
Max Drawdown -10.95%
Benchmark Max Drawdown -55.19%
Overall Winners (50/66) 75.76%
Sharpe Ratio 1.74
George,
I would like to see how this system compares to your MAC System for the same time frame 2000-2016.Also for the MAC System testing when not in the S&P500 can you move the money to IEF and tell me the returns information please.
Dave
MAC System (SPY-IEF) performance:
Period 02/12/01 – 08/29/16
Benchmark SPDR S&P 500 ETF Trust
Quick Stats as of 8/29/2016
Total Return 378.64%
Benchmark Return 120.29%
Active Return 258.35%
Annualized Return 10.60%
Annual Turnover 75.52%
Max Drawdown -17.10%
Benchmark Max Drawdown -55.19%
Overall Winners (12/14) 85.71%
Sharpe Ratio 0.98
Correlation with SPDR S&P 500 ETF Trust 0.40
Hi, is there anyway to back test data for this or any of your main models to see how they would have dealt with black swan type events such as black Monday 1987? I know you can use Vanguard 500 fund and one of their government bond funds. Thanks!
The answer is No. For the composite market timer we use P123 point-in-time data which is only available from 1999. The component Beta-Timer is only valid from 2000, because it uses a 40-week moving average. That is why we only start the Composite Market Timer in Jan-2000.
What would the return and max DD be using the composite timer with USMV compared to SPY? I know it only goes back to late 2011, but I’m interested if that cuts down further on DD while still maintaining a high return.
P123 has extended price data for ETF USMV.
For the same simulation period as in the model description USMV-IEF shows a bit smaller return and D/D is better by about 1%.
Period 02/12/01 – 08/29/16
Ranking System Ranking for Composite Market Timer USMV-IEF
Quick Stats as of 8/29/2016
Total Return 1,096.62%
Annualized Return 17.32%
Annual Turnover 403.03%
Max Drawdown -8.35%
Overall Winners (50/64) 78.12%
Sharpe Ratio 1.83
What is the return if one used RSP/IEF instead of SPY/IEF? What aboit ITOT/IEF? Thanks!
RSP-IEF produces somewhat higher simulated returns. For the same backtest period as shown in the model description:
Period 02/12/01 – 08/29/16
Quick Stats as of 8/29/2016
Total Return 1,884.22%
Annualized Return 21.20%
Annual Turnover 403.07%
Max Drawdown -11.13%
Overall Winners (50/64) 78.12%
Sharpe Ratio 1.70
There are plenty of indications that the switch to bonds may not pay off as it has in the past. When the composite timer indicates that SPY should be sold, why not switch to a different strategy? For example, both Combo3.R1 and the GoldStocksBonds strategies have done better in poor market years.
The general expectation is that Treasuries will lose as the FED raises rates. But so far Treasury ETF IEF gained 3.1% this year despite everybody knowing that the FED is determined to raise the Federal Funds Rate.
Also, the model does not necessarily hold IEF for very long periods, and during down stock market periods bonds may still gain even if the interest rate trend is upwards.
There is nothing to stop you from switching to a different strategy, but for obvious reasons we cannot give any investment advice as we are not financial advisers.
What ETF’s are used for the VIX timer?
Thank You,
Mark
All six models, including the VIX-Timer, use SPY and IEF.
Can one substitute long leveraged ETFs like SSO-UST, or QLD-UST? What would happen to CAGR and D/D if these were used instead of SPY-IEF? Thanks!
With SSO-UST model shows twice the return of SPY-IEF and double the max D/D.
Period 01/02/00 – 04/16/18
Quick Stats as of 4/16/2018
Total Return 19,159.10%
Benchmark SPY Return 153.95%
Annualized Return 33.33%
Annual Turnover 389.11%
Max Drawdown -21.79%
Benchmark Max Drawdown -55.19%
Overall Winners (53/71) 74.65%
Sharpe Ratio 1.52
Have you thought about or tested using any kind of stop loss strategy with the composite timer, since it seems to be the flagship model and cornerstone of the other models? To try and deal with black swan or other events that won’t be accounted for in the data, or won’t be accounted for quickly enough to capture gains/cut losses shorter? Thanks!
I know the ZIV timer uses a stop loss system.
A simulation with a Trailing Stop of 15% Percent below peak value since position was opened had no effect on the simulate performance. All Stops with a smaller percentage than 15% produced lower returns and higher drawdowns.
So it would appear that a Trailing Stop of 15% Percent could provide some protection against black swan events, but it is not in the model.
I’m assuming once LIBOR is phased out you are going to substitute with SOFR to run your TED spread model correct?
https://www.thinkadvisor.com/2018/04/04/ny-fed-introduces-libor-substitute/?slreturn=20180325195910
We are using FRED data.
TED Spread (daily).
Corresponding FRED id=TEDRATE
Yes I understand that is what you currently use but I just wanted you to be aware that LIBOR will be going away by 2021. It’s going to be replaced by another benchmark called SOFR. I don’t think replacing LIBOR with SOFR will have a significant impact to the effectiveness of the model, but I just thought you should know.
https://www.forbes.com/sites/forbesnycouncil/2018/04/19/goodbye-libor-hello-sofr/#5e8484d4717d
Your front dashboard shows Stock Confidence Level 90%. Is there any evidence changing an investors stock exposure based on confidence level would add value to a portfolio over time?
Our Stock Market Confidence Level is based on the number of models signifying investment in stocks. We have not backtested to determine stock exposure over time in relation to this level.
what do you think would happen if IEF was replaced by VIX?
The Volatility Index, or VIX, is an index created by the Chicago Board Options Exchange (CBOE), which shows the market’s expectation of 30-day volatility. You can’t trade the VIX directly.
Perhaps I should have been more precise — VXX or VXZ, or similar. Although now I am realizing that these ETNs haven’t been around very long. Might be food for thought for a future strategy, as the US market correlation of these instruments are around -0.75 according to portfolio visualizer. thanks
Georg shouldn’t the composite timer be in the market right now because the combined weight of the six models is equal to 50?
The Composite Timer stays in stocks because the combined weight of the component models is 50.
Thank you
Georg and Anton,
Have you consider using the Composite Timer percentages to determine SPY/ cash allocations as follows:
Combined weight of the Composite timer = 50 then portfolio allocation = 50% SPY/50% cash.
Combined weight of the Composite timer = 62.5 then portfolio allocation = 62.5% SPY/37.5 cash.
Combined weight of the Composite Timer = 75 then portfolio allocation = 75% SPY/25% cash, etc.
If the Combined weight is below 50 then the portfolio would allocate 100% to IEF.
Pretty simplistic I know, just wonder what the return/ risk profile would be like.
Thanks for any input and all the best in 2019!
For this scenario, returns from 1/2/2000 to 1/4/2019
Total Return … 951.57%
Benchmark Return … 145.34%
Active Return … 806.23%
Annualized Return … 13.18%
Annual Turnover … 479.07%
Max Drawdown … -8.95%
Benchmark Max Drawdown … -55.19%
Overall Winners … (57/81) 70.37%
Sharpe Ratio … 1.55
Guys,
Can you run results for long only when both the iM Best(SPY-SH) & IM Composite Market Timer (SPY-IEF) are both “long” at the same time? Also when they are both not in SPY (long) and both either short or in bonds at the same time.
I do not see these results posted ?
This is not easily modeled, and cannot be done in Portfolio 123.
We will soon bring out a model based on the iM-Stock Market Confidence Level determined from the percentage stock fund holdings of the 11 models shown in the weekly performance summary table emailed on Sunday to gold tier members.
Hello, Georg;
Could you please update the Realized Trades table for this system through the end of 2018? Thanks for the great systems.
Stephen
You can find all trades for the iM-Composite (SPY-IEF) Timer in the current Model Performance Tables, and historic tables for this model are in the Archive section on iM.
The last trade here in the Realized Trades Table is LONG IEF of 9/6/2016. In Model Performance Tables the first trade is LONG SPY from ???
Here are the subsequent realized trades:
Symbol … Open … Close
SPY … 12/24/2018 … 12/31/2018
IEF … 12/10/2018 … 12/24/2018
SPY … 4/3/2017 … 12/10/2018
SPY … 4/3/2017 … 4/24/2017
IEF … 3/20/2017 … 4/3/2017
SPY … 11/7/2016 … 3/20/2017
SPY … 11/7/2016 … 11/21/2016
IEF … 9/6/2016 … 11/7/2016
SPY … 11/7/2016 … 3/20/2017
SPY … 11/7/2016 … 11/21/2016
and
SPY … 4/3/2017 … 12/10/2018
SPY … 4/3/2017 … 4/24/2017
Two entry in SPY ? I Don’t understand
Another question please : What would the return, the Sharpe Ratio and max DD be using the composite timer with USMV compared to SPY from 2001 to 2018 including the latest market crash? Best Regards
Performance Stats from 1/2/2001 to 1/4/2019:
For model SPY-IEF
Total Return … 1733.21%
Benchmark Return … 176.82%
Active Return … 1556.38%
Annualized Return … 17.53%
Annual Turnover … 383.70%
Max Drawdown … -10.06%
Benchmark Max Drawdown … -55.19%
Overall Winners … (54/70) 77.14%
Sharpe Ratio … 1.65
For USMV-IEF
Total Return … 1323.14%
Benchmark Return … 176.82%
Active Return … 1146.32%
Annualized Return … 15.89%
Annual Turnover … 385.00%
Max Drawdown … -9.05%
Benchmark Max Drawdown … -55.19%
Overall Winners … (54/70) 77.14%
Sharpe Ratio … 1.73
Hi Georg,
Shouldn’t the composite timer be out of the market right now?
If you subscribe to our email service you would have been notified yesterday (1/20/2019) that this timer is selling SPY on Jan-22-2019.
You mean buying SPY?
Sorry, my mistake. The timer is buying SPY.
This timer should be in a BUY because it says it is at 50 % ? Which would change everything ? Especially the new timer ?
Is the “MC Score” described here the same as the Market Climate Grader?
Tom C
it would be great if on the home page each week next to the iM-composite timer, you could put a confidence level (this week would be Confidence Level = 37.5%), like you do on the Super Timer (for quick identification). Thanks.
Tom C
Can you guys update all realized trades to year end 2018 please. I still believe this may be your best time overall.
Thanks
Symbol … Open … Close … Pct
IEF … 02/04/2019 … …
SPY … 01/22/2019 … 02/04/2019 … 3.00%
IEF … 12/31/2018 … 01/22/2019 … -0.50%
SPY … 12/24/2018 … 12/31/2018 … 5.60%
IEF … 12/10/2018 … 12/24/2018 … 0.40%
SPY … 04/03/2017 … 12/10/2018 … 11.60%
IEF … 03/20/2017 … 04/03/2017 … 0.70%
SPY … 11/07/2016 … 03/20/2017 … 11.20%
IEF … 09/06/2016 … 11/07/2016 … -1.90%
Hi,
could you please update the statistics relative to this model (yearly performance, sharpe, max drawdown etc……) and the yearly performance of 2016-2017-2018?
Thank you very much.
Annualized Performance by Calendar Year SPY-IEF with 1% slippage
Year ___ Return (%)
2000 ___ 10.36
2001 ___ 6.74
2002 ___ 19.88
2003 ___ 32.08
2004 ___ 9.83
2005 ___ 10.58
2006 ___ 12.01
2007 ___ 27.73
2008 ___ 17.87
2009 ___ 36.58
2010 ___ 20.82
2011 ___ 16.84
2012 ___ 6.2
2013 ___ 34.15
2014 ___ 22.63
2015 ___ 8.86
2016_8.13%
2017_23.92%
2018_5.90%
2019_YTD_12.68%
Since Inception 01/02/00 to 7/5/2019
Annualized Return (%) … 17.37
Max Drawdown (%) … -10.41
Monthly Samples … 234
Standard Deviation (%) … 9.64
Sharpe Ratio … 1.54
Sortino Ratio … 2.21
Correlation with Benchmark … 0.32
R-Squared … 0.1
Beta … 0.21
Alpha (%) (annualized) … 14.73
So we go from an exceptional 100% to an exceptional 25%, can that be true?
drftr
Yes.
Hello,
I was looking at your system and cannot find an apparent logic to this:
Why the MC-Score has changed here but nothing has changed in the iM-Best4 MC-Score Vanguard System that use the same model in order to adjust the allocation?
Thank you for your reply.
The logic of MC-Score should apply to iM-BEST2 MC-Score ETF SYSTEM as well.
So why the differences between the various models?
Thank you.
The scoring systems are different.
Could you explain, to understand, in what do they differ substantially?
(I found only one paper regarding MC-Score).
Thank you.
Can you please run a simulation with this strategy with SPY and IGSB? Thanks.
The Component Standard Timer(STD) used within this iM-Composite Timer (SPY-IEF) strategy is different that the The iM Standard Market Timer. You have published a track record of using the The iM Standard Market Timer. May I ask the record of using the STD timer by itself using SPY-IEF vehicles or whatever ones you used when devising it? Thanks.
CMP Standard Timer (SPY-IEF)
Period … 01/02/00 – 07/22/20
Benchmark … S&P 500 (SPY)
Quick Stats as of 7/22/2020
Total Return … 956.72%
Benchmark Return … 227.08%
Active Return … 729.64%
Annualized Return … 12.14%
Annual Turnover … 341.53%
Max Drawdown … -24.01%
Benchmark Max Drawdown … -55.19%
Overall Winners … (54/75) 72.00%
Sharpe Ratio … 1.02
Correlation with S&P 500 (SPY) … 0.37
Hi, can you update the trades for Composite Timer since 2/6/19? That’s the last one I see in the threads above.
Tom C
Period 01/02/00 – 02/03/21
Benchmark S&P 500 (SPY)
Quick Stats as of 2/3/2021
Total Return 2,372.62%
Benchmark Return 285.27%
Active Return 2,087.34%
Annualized Return 16.41%
Annual Turnover 390.05%
Max Drawdown -22.67%
Benchmark Max Drawdown -55.19%
Overall Winners (62/83) 74.70%
Sharpe Ratio 1.37
Correlation with S&P 500 (SPY) 0.37
Thanks!! Can you provide the trade history since 1/2019? Thanks….
Tom C
Symbol … Open … Close
SPY … 08/17/2020 … —
IEF … 03/09/2020 … 08/17/2020
SPY … 09/16/2019 … 03/09/2020
IEF … 08/12/2019 … 09/16/2019
SPY … 03/25/2019 … 08/12/2019
IEF … 02/04/2019 … 03/25/2019
SPY … 01/22/2019 … 02/04/2019
IEF … 12/31/2018 … 01/22/2019
SPY … 12/24/2018 … 12/31/2018
Hello,
could you please give the annual results for the composite timer (especially last 5 years) in order to make some evaluation about the system?
Thank you.