
- This system always holds five ETFs (equity-, fixed income-, short equity-, and Gold-ETFs) selected according to stock market climate and rank.
- Typically, during good-equity markets it holds equity-ETFs, and during bad-markets fixed income-ETFs and/or short equity-ETFs. Also at times it can hold three gold-ETFs with other ETFs.
- A one factor ranking system selects five ETFs from a preselected list of 29 ETFs. A simulation from 2000 to 2017 shows a 24% annualized return with a maximum drawdown of -12%.
This model, unlike the iM-5 ETF Trader, does not trade in leveraged-long and leveraged short ETFs. The model was backtested on the on-line simulation platform Portfolio 123 which also provides extended price data for ETFs prior to their inception dates calculated from their proxies. ETFs, other than P123 extended ETFs, were only considered for selection six months after their inception. Trading costs, including slippage, were assumed as 0.1% of the trade amounts using closing prices.
Model Philosophy
The basic approach is to invest in five equity-ETFs during up-market periods and in five fixed-income-ETFs during down-market periods. Market timing rules, listed further down, were applied to identify those periods.
To improve return and Sharpe ratio, the model invests in three gold-ETFs when gold timing rules indicate this to be profitable and permitted by the ranking system. During those periods the model could have a 60% investment in gold-ETFs.
Further improvement to annualized return is achieved by adding an inverse equity-ETF during down -markets.
The Ranking System
The ranking system’s approach assumes trading ETFs, rather than investing for longer periods.
The one factor system is based on the price changes over a short period. The idea being that ETFs which have experienced a decline over a short period will bounce back, reverting and doing better than ETFs which have not declined in this way.
The ETF Selection List
The model typically holds five ETFs from the list below, periodically selected by the ranking system and buy rules.
|
Ticker |
ETF Name |
AssetClass |
AvgDailyTot $-million |
Inception |
|
|
IWB |
iShares Russell 1000 |
Equity Std Long |
91.1 |
5/19/2000 |
E |
|
IWF |
iShares Russell 1000 Growth |
Equity Std Long |
178.6 |
5/26/2000 |
|
|
IWV |
iShares Russell 3000 |
Equity Std Long |
19 |
5/26/2000 |
E |
|
USMV |
iShares Edge MSCI Min Vol USA |
Equity Std Long |
65.9 |
10/20/2011 |
E |
|
MTUM |
iShares Edge MSCI USA Momentum Factor |
Equity Std Long |
59.2 |
4/18/2013 |
|
|
VIG |
Vanguard Dividend Appreciation |
Equity Std Long |
58.5 |
4/27/2006 |
E |
|
VNQ |
Vanguard REIT |
Equity Std Long |
417.2 |
9/29/2004 |
E |
|
VOE |
Vanguard Mid-Cap Value |
Equity Std Long |
27 |
8/24/2006 |
E |
|
NOBL |
ProShares S&P 500 Dividend Aristocrats |
Equity Std Long |
11.2 |
10/10/2013 |
|
|
PXLG |
PowerShares Russell Top 200 Pure Growth |
Equity Std Long |
2.6 |
6/16/2011 |
|
|
QQQ |
PowerShares QQQ Trust Series 1 |
Equity Std Long |
2,869.20 |
3/10/1999 |
|
|
RSP |
Guggenheim S&P 500 Equal Weight |
Equity Std Long |
53.4 |
4/30/2003 |
E |
|
SPY |
SPDR S&P 500 ETF Trust |
Equity Std Long |
14,087.10 |
1/29/1993 |
|
|
SH |
ProShares Short S&P500 |
Equity Std Short |
67.1 |
7/13/2006 |
E |
|
ANGL |
VanEck Vectors Fallen Angel High Yield |
Fixed Income |
10.7 |
4/11/2012 |
|
|
CIU |
iShares Intermediate Credit Bond |
Fixed Income |
40.4 |
1/11/2007 |
E |
|
CSJ |
iShares 1-3 Year Credit Bond |
Fixed Income |
46 |
1/11/2007 |
|
|
EMB |
iShares JPMorgan USD Emerging Mkts |
Fixed Income |
230.5 |
12/19/2007 |
E |
|
IEF |
iShares 7-10 Year Treasury Bond |
Fixed Income |
192.2 |
7/26/2002 |
E |
|
IEI |
iShares 3-7 Year Treasury Bond |
Fixed Income |
29.8 |
1/11/2007 |
E |
|
LQD |
iShares iBoxx Investment Grade Corp |
Fixed Income |
355.8 |
7/26/2002 |
E |
|
SHY |
iShares 1-3 Year Treasury Bond |
Fixed Income |
79.2 |
7/26/2002 |
E |
|
BND |
Vanguard Total Bond Market |
Fixed Income |
147 |
4/10/2007 |
E |
|
BNDX |
Vanguard Total International Bond |
Fixed Income |
34.9 |
6/4/2013 |
E |
|
VMBS |
Vanguard Mortgage-Backed Securities |
Fixed Income |
25.5 |
11/24/2009 |
E |
|
VWOB |
Vanguard Emerging Markets Govt |
Fixed Income |
5.7 |
6/4/2013 |
E |
|
GLD |
SPDR Gold Trust |
Commodities |
853.5 |
11/18/2004 |
E |
|
IAU |
iShares Gold Trust |
Commodities |
98.3 |
1/28/2005 |
E |
|
DBP |
PowerShares DB Precious Metals |
Commodities |
2.1 |
1/5/2007 |
|
|
E = P123 extended data from 12/31/98 |
Market timing Rules
Up- and down-markets definition is based on:
- the S&P 500 Risk Premium,
- the score of the iM-Composite Market Timer,
- and the current-year consensus S&P 500 EPS estimate.
(Risk Premium= SP500 Estimated Earnings Yield – 10Y T-Note Yield)
Down-markets are defined as periods when up-market conditions are absent.
Definition of Gold-markets is based on the algorithm of the iM-Gold Timer.
Buy- and Sell Rules
Buy highest ranked and:
Buy Gold-ETFs when gold-buy-signal is present, or
buy Fixed Income-ETFs, or Inverse-ETFs when down-market conditions exist, or
buy Equity-ETFs when up-market conditions exist.
Sell-rule is independent of rank:
Sell Gold-ETFs when gold-sell-signal is present, or
sell Equity-ETFs when down-market condition exist, or
sell Fixed Income-ETFs, or Inverse-ETFs when up-market conditions exist
Performance 2000-2017
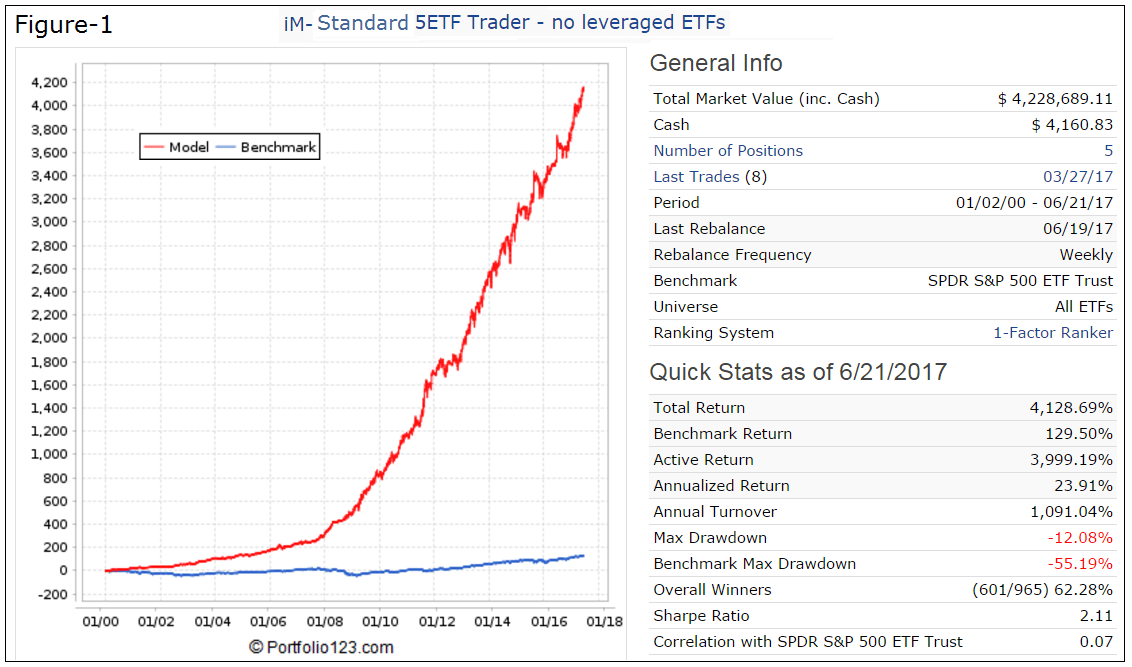
Performance from Jan-2000 to Jun-2017 is shown in Figure-1. The model showed an annualized return 23.9% with a -12.1% maximum drawdown.
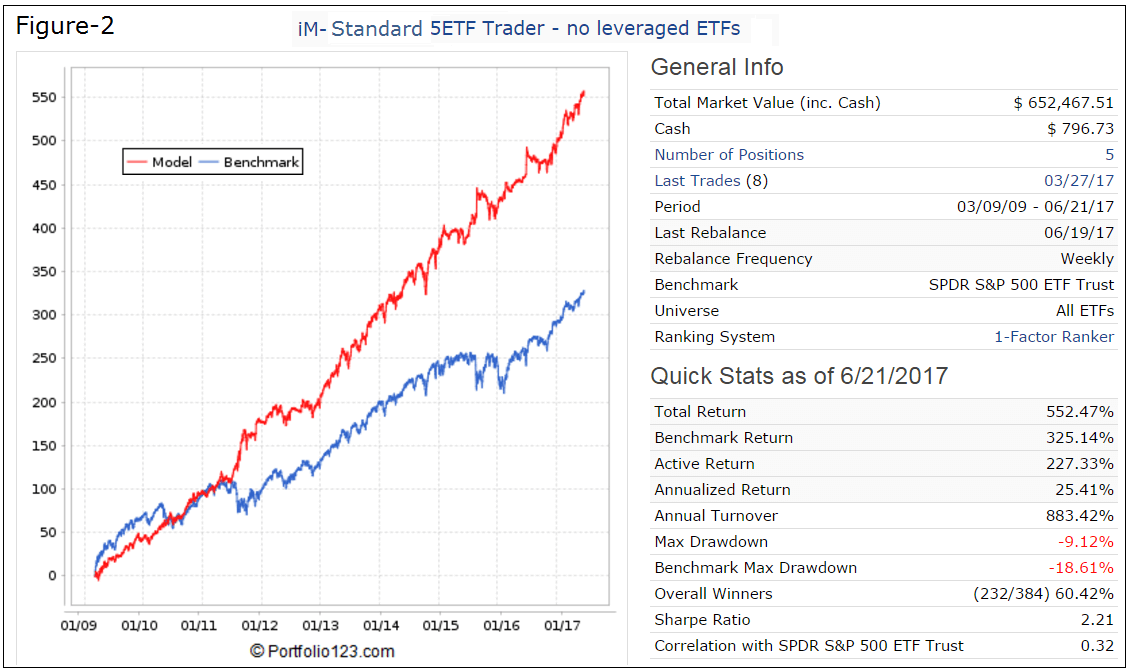
Performance 2009-2017
The simulated performance from Mar-9-2009 to Jun-2017 is shown in Figure-2. The start date for this period is the date when the S&P 500 was at its lowest level during the financial crisis recession. For the approximately 8-year backtest period the simulated annualized return was 25.4% with a maximum drawdown of -9.1%. The model significantly out-performed with lower drawdown the SPDR S&P 500 ETF (SPY) over this up-market period.
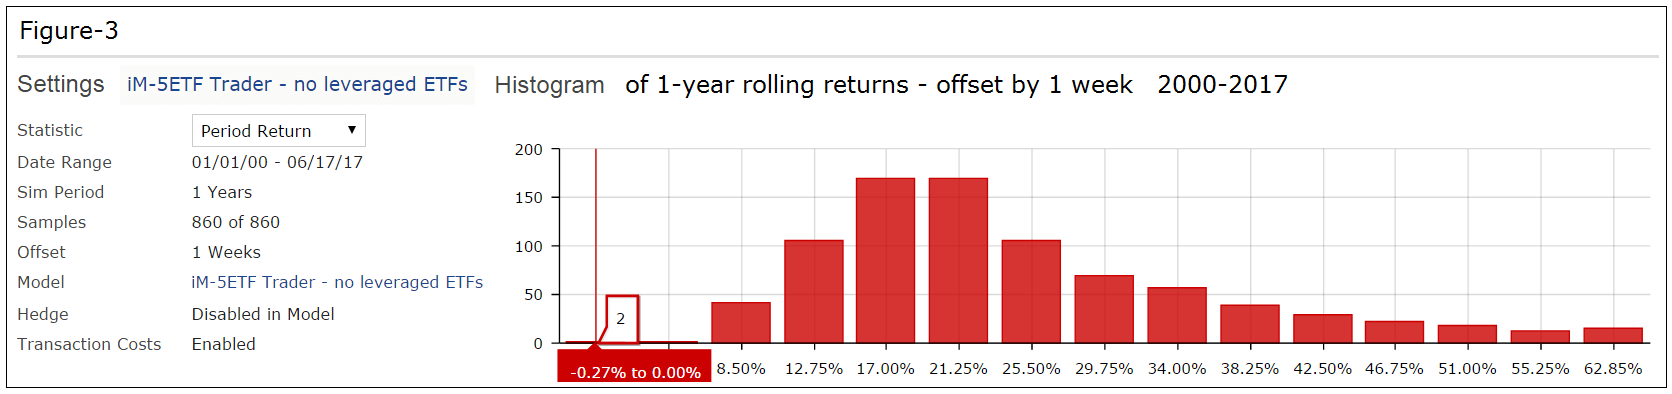
Performance Histogram 2000-2017
Rolling 1-year returns with a 1 week offset are shown in Figure-3. There were 2 sample periods out of 860 showing a small negative 1-year return of about -0.3% to 0.0%, with transaction costs included.
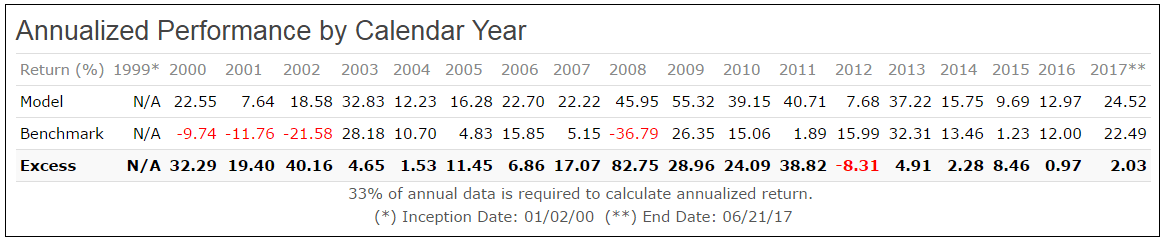
Calendar year performance
Calendar year returns are shown in Figure-4. There was never a year when the model had a negative return, but under-performed SPY over 2012.
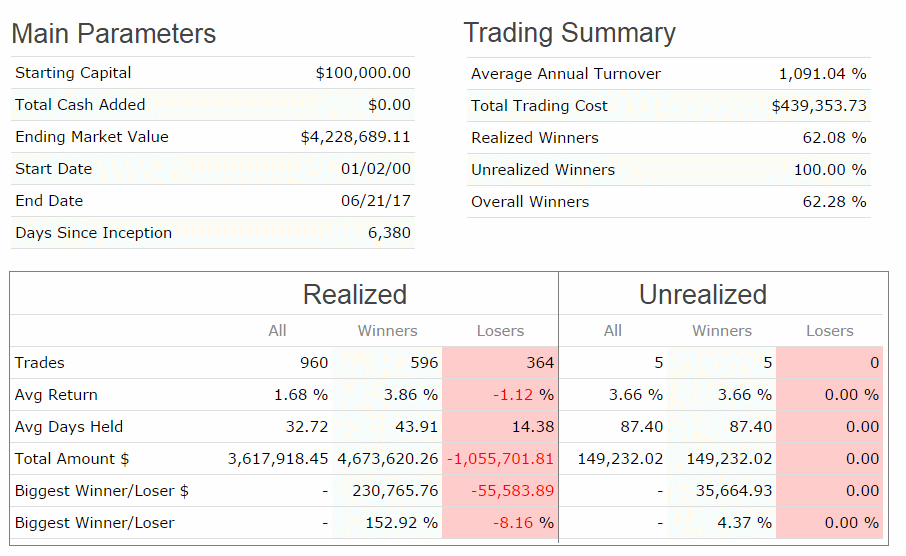
Trading Statistics
This is a trading model with an average annual turnover of about 1,090% (11 x). The average holding period of a position was 33 days, 62% of all trades were winners, and the biggest trade loss was -8.2%, all as shown in the table below.
Risk Measurements
Risk measurements are from Portfolio 123.

Following the model
This model could be of interest to investors willing to accept a fair amount of trading activity.
Note, that this is a trading model with 82% of all trades having a holding period of three weeks or less. There were 56 trades per year on average, and the maximum was 131 trades in 2015.
|
Holding period |
Pct. of all trades |
Number of trades 2000-2017 |
|
7-21 days |
81.7% |
784 |
|
22-42 days |
6.4% |
61 |
|
43-92 days |
6.7% |
64 |
|
93-183 days |
2.2% |
21 |
|
184-240 days |
0.6% |
6 |
|
241-365 days |
0.7% |
7 |
|
More than a year |
1.8% |
17 |
On iMarketSignals we will report the performance of this model, with weekly trading signals normally provided on Sundays to Gold level members.
Disclaimer
Note: All performance results are hypothetical and the result of backtesting over the period 2000 to 2017. Since performance is greatly dependent on market-timing rules, the future out-of-sample performance may be significantly less if those rules are not as effective as they were during the backtest period. No claim is made about future performance.
Nice……Any guess why the trailing 3 year annualized performance (13.8%) is 42% less than the annualized performance from 2000 (23.9%) ??
Note that the max drawdown for the trailing 3 year period is 37% less than the period from 2000 (-7.6% vs -12%)………
V
During upmarket periods (such as the last 3 years) model can only moderately outperform buy-and-hold SPY because it does not hold long leveraged ETFs.
can you post monthly returns going back to 12/31/2007. Also looking for correlation numbers on the three different models of combo 5, standard 5 (no leverage) and gold stock bond
We can only get correlation numbers for individual models not combos.
iM-Standard 5ETF Trader
Performance by Month
Start Date …. Model …. SPY …. Excess Return
01/02/2008 …. 0.095 …. -0.060 …. 15.527
02/01/2008 …. 0.037 …. -0.026 …. 6.312
03/03/2008 …. 0.044 …. -0.009 …. 5.253
04/01/2008 …. 0.082 …. 0.048 …. 3.467
05/01/2008 …. -0.013 …. 0.015 …. -2.804
06/02/2008 …. 0.022 …. -0.084 …. 10.580
07/01/2008 …. 0.007 …. -0.009 …. 1.609
08/01/2008 …. 0.006 …. 0.015 …. -0.919
09/02/2008 …. 0.017 …. -0.094 …. 11.120
10/01/2008 …. 0.026 …. -0.165 …. 19.152
11/03/2008 …. 0.046 …. -0.070 …. 11.530
12/01/2008 …. 0.019 …. 0.010 …. 0.970
01/02/2009 …. 0.071 …. -0.082 …. 15.283
02/02/2009 …. 0.036 …. -0.107 …. 14.299
03/02/2009 …. -0.037 …. 0.083 …. -12.003
04/01/2009 …. 0.141 …. 0.099 …. 4.177
05/01/2009 …. 0.044 …. 0.058 …. -1.488
06/01/2009 …. 0.037 …. -0.001 …. 3.789
07/01/2009 …. 0.021 …. 0.075 …. -5.318
08/03/2009 …. 0.027 …. 0.037 …. -1.028
09/01/2009 …. 0.049 …. 0.035 …. 1.309
10/01/2009 …. 0.002 …. -0.019 …. 2.082
11/02/2009 …. 0.093 …. 0.062 …. 3.173
12/01/2009 …. -0.022 …. 0.019 …. -4.137
01/04/2010 …. -0.016 …. -0.036 …. 2.004
02/01/2010 …. 0.039 …. 0.031 …. 0.796
03/01/2010 …. 0.036 …. 0.061 …. -2.461
04/01/2010 …. 0.055 …. 0.015 …. 3.901
05/03/2010 …. 0.033 …. -0.079 …. 11.247
06/01/2010 …. 0.007 …. -0.052 …. 5.919
07/01/2010 …. 0.005 …. 0.068 …. -6.329
08/02/2010 …. 0.014 …. -0.045 …. 5.940
09/01/2010 …. 0.066 …. 0.090 …. -2.319
10/01/2010 …. 0.046 …. 0.038 …. 0.800
11/01/2010 …. 0.014 …. 0.000 …. 1.415
12/01/2010 …. 0.038 …. 0.067 …. -2.914
01/03/2011 …. -0.032 …. 0.023 …. -5.505
02/01/2011 …. 0.053 …. 0.035 …. 1.788
03/01/2011 …. 0.015 …. 0.000 …. 1.487
04/01/2011 …. 0.075 …. 0.029 …. 4.557
05/02/2011 …. -0.022 …. -0.011 …. -1.096
06/01/2011 …. -0.022 …. -0.017 …. -0.540
07/01/2011 …. 0.087 …. -0.020 …. 10.656
08/01/2011 …. 0.110 …. -0.055 …. 16.450
09/01/2011 …. 0.008 …. -0.069 …. 7.722
10/03/2011 …. 0.026 …. 0.109 …. -8.267
11/01/2011 …. 0.049 …. -0.004 …. 5.335
12/01/2011 …. 0.012 …. 0.010 …. 0.137
01/03/2012 …. -0.005 …. 0.046 …. -5.132
02/01/2012 …. 0.035 …. 0.043 …. -0.810
03/01/2012 …. 0.027 …. 0.032 …. -0.502
04/02/2012 …. -0.001 …. -0.007 …. 0.587
05/01/2012 …. -0.049 …. -0.060 …. 1.074
06/01/2012 …. 0.032 …. 0.041 …. -0.872
07/02/2012 …. 0.011 …. 0.012 …. -0.067
08/01/2012 …. -0.009 …. 0.025 …. -3.388
09/04/2012 …. 0.022 …. 0.025 …. -0.336
10/01/2012 …. -0.010 …. -0.018 …. 0.789
11/01/2012 …. 0.010 …. 0.006 …. 0.474
12/03/2012 …. 0.014 …. 0.009 …. 0.465
01/02/2013 …. 0.061 …. 0.051 …. 0.993
02/01/2013 …. 0.012 …. 0.013 …. -0.098
03/01/2013 …. 0.039 …. 0.038 …. 0.108
04/01/2013 …. 0.031 …. 0.019 …. 1.138
05/01/2013 …. 0.027 …. 0.024 …. 0.388
06/03/2013 …. -0.017 …. -0.013 …. -0.383
07/01/2013 …. 0.053 …. 0.052 …. 0.136
08/01/2013 …. -0.022 …. -0.030 …. 0.841
09/03/2013 …. 0.038 …. 0.032 …. 0.592
10/01/2013 …. 0.047 …. 0.046 …. 0.066
11/01/2013 …. 0.029 …. 0.030 …. -0.103
12/02/2013 …. 0.027 …. 0.026 …. 0.074
01/02/2014 …. -0.026 …. -0.035 …. 0.947
02/03/2014 …. 0.048 …. 0.046 …. 0.243
03/03/2014 …. 0.001 …. 0.008 …. -0.727
04/01/2014 …. 0.004 …. 0.007 …. -0.324
05/01/2014 …. 0.028 …. 0.023 …. 0.430
06/02/2014 …. 0.026 …. 0.021 …. 0.568
07/01/2014 …. -0.012 …. -0.013 …. 0.154
08/01/2014 …. 0.043 …. 0.039 …. 0.323
09/02/2014 …. -0.019 …. -0.014 …. -0.568
10/01/2014 …. 0.026 …. 0.024 …. 0.200
11/03/2014 …. 0.030 …. 0.027 …. 0.288
12/01/2014 …. 0.002 …. -0.003 …. 0.491
01/02/2015 …. 0.042 …. -0.030 …. 7.185
02/02/2015 …. -0.007 …. 0.056 …. -6.335
03/02/2015 …. 0.009 …. -0.016 …. 2.435
04/01/2015 …. 0.000 …. 0.010 …. -1.008
05/01/2015 …. -0.006 …. 0.013 …. -1.840
06/01/2015 …. -0.008 …. -0.020 …. 1.206
07/01/2015 …. 0.051 …. 0.023 …. 2.875
08/03/2015 …. 0.046 …. -0.061 …. 10.743
09/01/2015 …. 0.003 …. -0.026 …. 2.828
10/01/2015 …. -0.016 …. 0.085 …. -10.096
11/02/2015 …. -0.012 …. 0.004 …. -1.585
12/01/2015 …. -0.006 …. -0.017 …. 1.115
01/04/2016 …. 0.019 …. -0.050 …. 6.908
02/01/2016 …. 0.037 …. -0.001 …. 3.744
03/01/2016 …. -0.006 …. 0.067 …. -7.306
04/01/2016 …. 0.012 …. 0.004 …. 0.802
05/02/2016 …. -0.003 …. 0.017 …. -2.017
06/01/2016 …. 0.066 …. 0.003 …. 6.300
07/01/2016 …. -0.018 …. 0.036 …. -5.495
08/01/2016 …. -0.007 …. 0.001 …. -0.787
09/01/2016 …. 0.001 …. 0.000 …. 0.110
10/03/2016 …. -0.005 …. -0.017 …. 1.242
11/01/2016 …. 0.011 …. 0.037 …. -2.537
12/01/2016 …. 0.017 …. 0.020 …. -0.279
01/03/2017 …. 0.026 …. 0.018 …. 0.775
02/01/2017 …. 0.040 …. 0.039 …. 0.062
03/01/2017 …. 0.004 …. 0.001 …. 0.318
04/03/2017 …. 0.011 …. 0.010 …. 0.134
05/01/2017 …. 0.011 …. 0.014 …. -0.345
06/01/2017 …. 0.007 …. 0.006 …. 0.047
07/03/2017 …. 0.017 …. 0.021 …. -0.405
08/01/2017 …. -0.002 …. 0.003 …. -0.465
09/01/2017 …. 0.022 …. 0.020 …. 0.198
10/02/2017 …. 0.020 …. 0.024 …. -0.326
11/01/2017 …. 0.034 …. 0.031 …. 0.296
12/01/2017 …. 0.014 …. 0.012 …. 0.158
01/02/2018 …. 0.056 …. 0.062 …. -0.521
Hi Georg
What would performance look like for a 50% Standard 5-ETF Trader with 50% 5-ETF Trader (leveraged) look like? Thanks
I’m thinking of using the leveraged 5 ETF Trader with either the Standard 5-ETF Trader or the Minimum Drawdown Combo.
Thanks
VMan
Performance for a 50% Standard 5-ETF Trader with 50% 5-ETF Trader (leveraged) would be performance for 1.5xleveraged (Standard 5-ETF Trader). The correlation between the two models is a high 94%, which does not provide any smoothing of the performance curve.
A simulation of 50% Min-Drawdown Combo & 50% 5-ETF Trader from 2000:
Period 12/31/99 – 04/27/18
Quick Stats as of 4/27/2018
Total Return 9,120.89%
Annualized Return 28.01%
Max Drawdown -12.38%
Sharpe Ratio 2.51
Correlation with S&P 500 (SPY) 0.23
You mention that nearly 82% of all trades are held 7-21 days — yet the current holdings were purchased back on 03/27/2017 (nearly 1 1/2 years ago) — curious about this .. maybe you can give explanation. Thanks.
The long holding period is due to the fact that we had upmarket conditions for such a long time. Note that 1.7% of trades were held longer than one year.
How can this model be buying SPY if down market conditions exist?
In this instance the SPY cancels the SH, and therefore the model should hold 40% cash instead of those two ETFs.
Hi,
could you please uptade the Quick stats of this model?
Thank you very much.
Period …. 01/02/00 – 09/04/19
Benchmark …. S&P 500 (SPY)
Quick Stats as of 9/4/2019
Total Return …. 4625.86%
Benchmark Return …. 188.48%
Active Return …. 4437.38%
Annualized Return …. 21.63%
Annual Turnover …. 1005.35%
Max Drawdown …. -19.22%
Benchmark Max Drawdown …. -55.19%
Overall Winners …. (627/1008) 62.20%
Sharpe Ratio …. 1.83
Correlation with S&P 500 (SPY) …. 0.18
It’s possible to have a statistic updated for the model?
Thank you.