
- Switching between stocks and bonds as signaled by a simple moving average crossover system of the S&P 500 – the MAC-US Timer – produces significantly higher returns than buy-and-hold stocks.
- The model has been updated from Aug-1965 to Jan-2017, conservatively assuming that funds are placed in the money market when not in the stock market.
The MAC-US Timer works as follows, with a buy signal and a sell signal triggering shifts from investment in the stock market to the money market, and vice versa.
Buy signal for the S&P 500
- A buy signal occurs when the 34-day exponential moving average (EMA) of the S&P 500 becomes greater than 1.001 times the 200-day EMA of the S&P 500.
Sell signal for the S&P 500
- A sell signal occurs when the 40-day simple moving average (SMA) of the S&P 500 crosses below the 200-day SMA of the S&P 500.
When a buy signal occurs, the whole investment goes into an S&P 500 index fund, and when a sell signal occurs all the funds are moved from the S&P 500 index fund to cash in the money market. Different moving average crossovers were chosen for the buy and sell signals in an attempt to prevent investment whipsaw situations.
Performance
The S&P 500 index fund is represented by a hypothetical fund SPY* based on the daily performance of the S&P 500 with dividends reinvested. SPY* was calculated by splicing the data from the SPDR S&P 500 ETF (SPY) from 1993 to 2016, the Vanguard 500 Index Fund (VFINX) from 1980 to 1993, and before that daily data of the S&P 500 adjusted for dividends with monthly dividends taken from the Shiller CAPE data.
The money market was simulated with a hypothetical fund SHV* using the daily Federal Funds Rate from 1965 to 2007 and thereafter by splicing the iShares Short Treasury Bond ETF (SHV) to it.
All trading is assumed to occur on the first trading day of the week after or when a signal from the MAC-US Timer was generated. A backtest of this model starting in 1965 provided the first buy signal for stocks on Aug-30-1965.
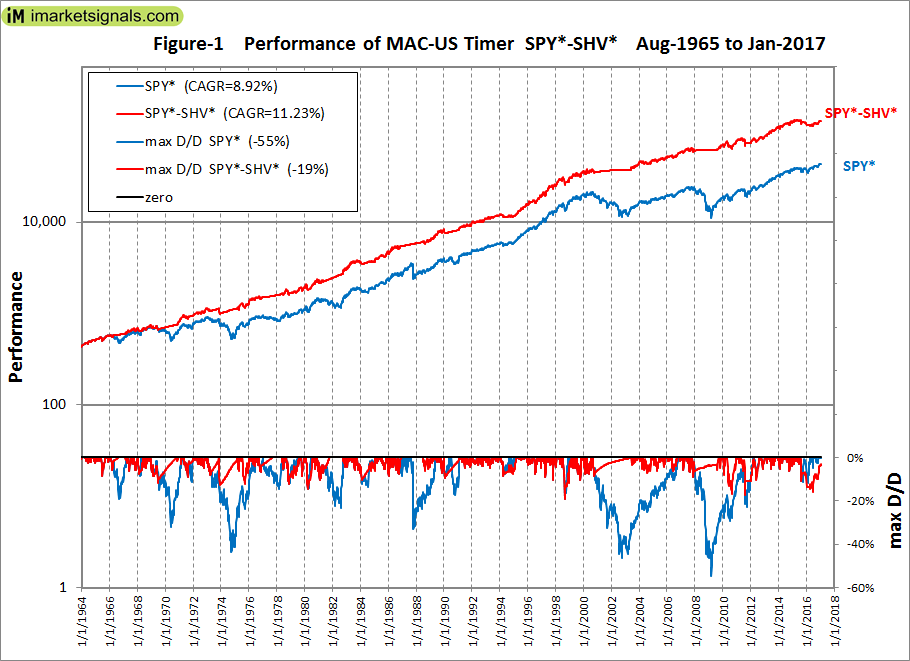
Over the period Aug-30-1965 to Jan-30-2017 the model, switching between SPY* and SHV*, showed an annualized return of 11.23% with a maximum drawdown of -19% in 1998. Buy-and-hold SPY* gave an annualized return of 8.92% with a maximum drawdown of -55% in 2009 (Figure-1).
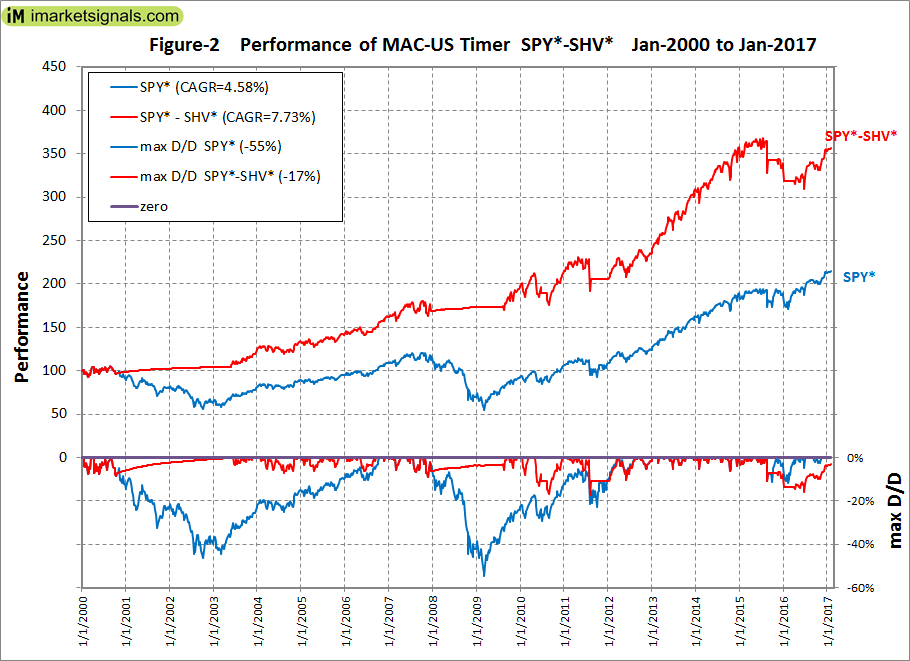
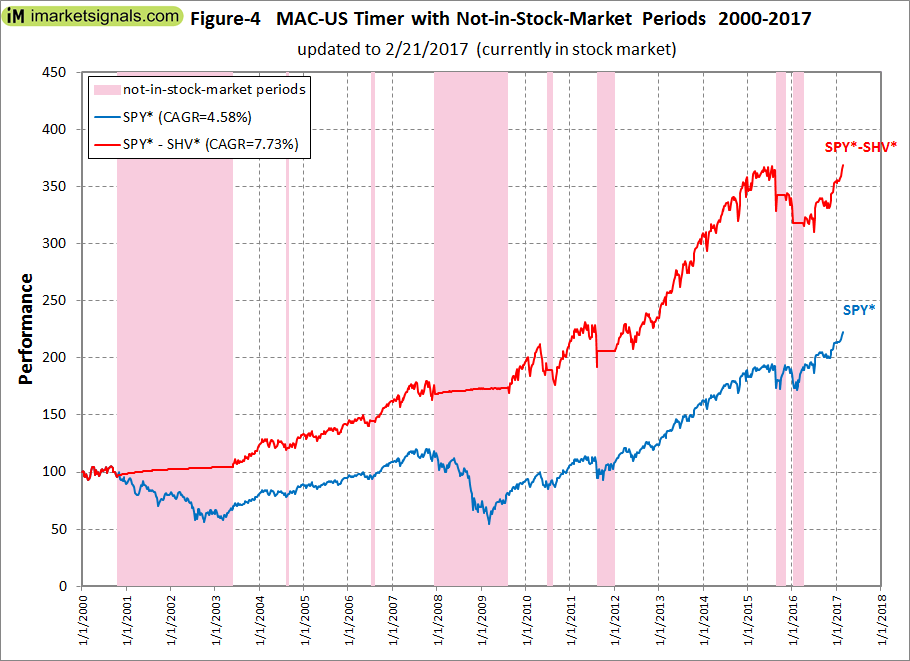
Over the period 1/3/2000 to Jan-30-2017 the model showed an annualized return of 7.73% with a maximum drawdown of -17% in 2011. Buy-and-hold SPY* gave an annualized return of 4.58% with a maximum drawdown of -55% in 2009 (Figure-2).
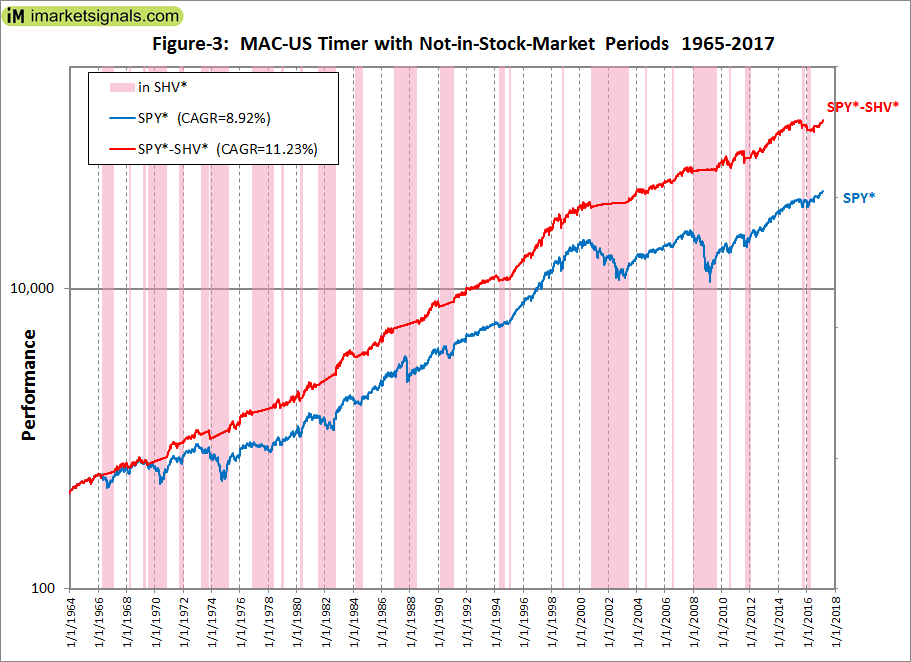
There were 26 periods from 1965 to 2017 when the MAC Timer signaled to be in SPY* and 25 periods in SHV*. They are listed in the Appendix and are also shown by the vertical bars in Figure-3. Note that the MAC Timer signaled to be out of the stock market during the 1987 market collapse and the bear markets of 2001-03 and 2008-09.
Conclusion
The intention was to show the most conservative performance from this model by switching from stocks to cash, which over the period 1965 to 2017 provided 2.95 times the total return of what a constant investment in the S&P 500 with dividends reinvested would have produced.
Higher returns could have been achieved by using a longer term bond fund instead of a money market fund. For example, switching to the Vanguard GNMA fund VFIIX when not in stocks the model would have shown an annualized return of 12.01% from Aug-30-1965 to Jan-30-2017, and 9.50% over the period 1/3/2000 to Jan-30-2017. The bond fund return was calculated from the daily data of VFIIX (available from Jun-27-1980), and before that from the Federal Funds Rate.
The model is simple to construct, but can also be followed live at iMarketSignals.com. Heeding the weekly signals from the MAC-US Timer should provide insurance against major stock market declines and improve investment performance over longer time.
Appendix
| signal date |
signal date |
1st trading day of week signal date |
1st trading day of week signal date |
||||
| in stocks | 08/30/1965 | – | 04/14/1966 | 08/30/1965 | – | 04/18/1966 | |
| in cash | 04/14/1966 | – | 01/24/1967 | 04/18/1966 | – | 01/30/1967 | |
| in stocks | 01/24/1967 | – | 02/21/1968 | 01/30/1967 | – | 02/26/1968 | |
| in cash | 02/21/1968 | – | 04/18/1968 | 02/26/1968 | – | 04/22/1968 | |
| in stocks | 04/18/1968 | – | 03/10/1969 | 04/22/1968 | – | 03/10/1969 | |
| in cash | 03/10/1969 | – | 04/25/1969 | 03/10/1969 | – | 04/28/1969 | |
| in stocks | 04/25/1969 | – | 06/25/1969 | 04/28/1969 | – | 06/30/1969 | |
| in cash | 06/25/1969 | – | 10/15/1970 | 06/30/1969 | – | 10/19/1970 | |
| in stocks | 10/15/1970 | – | 09/20/1971 | 10/19/1970 | – | 09/20/1971 | |
| in cash | 09/20/1971 | – | 12/21/1971 | 09/20/1971 | – | 12/27/1971 | |
| in stocks | 12/21/1971 | – | 04/11/1973 | 12/27/1971 | – | 04/16/1973 | |
| in cash | 04/11/1973 | – | 10/18/1973 | 04/16/1973 | – | 10/22/1973 | |
| in stocks | 10/18/1973 | – | 11/21/1973 | 10/22/1973 | – | 11/26/1973 | |
| in cash | 11/21/1973 | – | 02/28/1975 | 11/26/1973 | – | 03/03/1975 | |
| in stocks | 02/28/1975 | – | 11/17/1976 | 03/03/1975 | – | 11/22/1976 | |
| in cash | 11/17/1976 | – | 05/08/1978 | 11/22/1976 | – | 05/08/1978 | |
| in stocks | 05/08/1978 | – | 12/04/1978 | 05/08/1978 | – | 12/04/1978 | |
| in cash | 12/04/1978 | – | 01/19/1979 | 12/04/1978 | – | 01/22/1979 | |
| in stocks | 01/19/1979 | – | 04/11/1980 | 01/22/1979 | – | 04/14/1980 | |
| in cash | 04/11/1980 | – | 05/27/1980 | 04/14/1980 | – | 05/27/1980 | |
| in stocks | 05/27/1980 | – | 06/25/1981 | 05/27/1980 | – | 06/29/1981 | |
| in cash | 06/25/1981 | – | 09/14/1982 | 06/29/1981 | – | 09/20/1982 | |
| in stocks | 09/14/1982 | – | 01/31/1984 | 09/20/1982 | – | 02/06/1984 | |
| in cash | 01/31/1984 | – | 08/17/1984 | 02/06/1984 | – | 08/20/1984 | |
| in stocks | 08/17/1984 | – | 11/05/1986 | 08/20/1984 | – | 11/10/1986 | |
| in cash | 11/05/1986 | – | 06/24/1988 | 11/10/1986 | – | 06/27/1988 | |
| in stocks | 06/24/1988 | – | 02/20/1990 | 06/27/1988 | – | 02/20/1990 | |
| in cash | 02/20/1990 | – | 02/01/1991 | 02/20/1990 | – | 02/04/1991 | |
| in stocks | 02/01/1991 | – | 04/15/1994 | 02/04/1991 | – | 04/18/1994 | |
| in cash | 04/15/1994 | – | 08/17/1994 | 04/18/1994 | – | 08/22/1994 | |
| in stocks | 08/17/1994 | – | 12/28/1994 | 08/22/1994 | – | 01/03/1995 | |
| in cash | 12/28/1994 | – | 01/17/1995 | 01/03/1995 | – | 01/23/1995 | |
| in stocks | 01/17/1995 | – | 09/18/1998 | 01/23/1995 | – | 09/21/1998 | |
| in cash | 09/18/1998 | – | 11/02/1998 | 09/21/1998 | – | 11/02/1998 | |
| in stocks | 11/02/1998 | – | 10/23/2000 | 11/02/1998 | – | 10/23/2000 | |
| in cash | 10/23/2000 | – | 05/22/2003 | 10/23/2000 | – | 05/27/2003 | |
| in stocks | 05/22/2003 | – | 08/12/2004 | 05/27/2003 | – | 08/16/2004 | |
| in cash | 08/12/2004 | – | 08/25/2004 | 08/16/2004 | – | 08/30/2004 | |
| in stocks | 08/25/2004 | – | 07/10/2006 | 08/30/2004 | – | 07/10/2006 | |
| in cash | 07/10/2006 | – | 08/02/2006 | 07/10/2006 | – | 08/07/2006 | |
| in stocks | 08/02/2006 | – | 12/13/2007 | 08/07/2006 | – | 12/17/2007 | |
| in cash | 12/13/2007 | – | 08/03/2009 | 12/17/2007 | – | 08/03/2009 | |
| in stocks | 08/03/2009 | – | 06/25/2010 | 08/03/2009 | – | 06/28/2010 | |
| in cash | 06/25/2010 | – | 08/05/2010 | 06/28/2010 | – | 08/09/2010 | |
| in stocks | 08/05/2010 | – | 08/12/2011 | 08/09/2010 | – | 08/15/2011 | |
| in cash | 08/12/2011 | – | 01/03/2012 | 08/15/2011 | – | 01/03/2012 | |
| in stocks | 01/03/2012 | – | 08/26/2015 | 01/03/2012 | – | 08/31/2015 | |
| in cash | 08/26/2015 | – | 11/05/2015 | 08/31/2015 | – | 11/09/2015 | |
| in stocks | 11/05/2015 | – | 01/06/2016 | 11/09/2015 | – | 01/11/2016 | |
| in cash | 01/06/2016 | – | 04/04/2016 | 01/11/2016 | – | 04/04/2016 | |
| in stocks | 04/04/2016 | – | 04/04/2016 | – |
Previous Articles on the MAC-US Timer
2014-06-05 Backtesting the MAC-System: How Long is Long Enough?
2012-09-10 The Improved MAC-System
2012-07-31 Beyond the Ultimate Death Cross
Georg,
Do you have returns if short the market instead of cash?
Thank You,
Mark
Data for the inverse ETF SH has not been available for long enough to make a determination.
I have what I think is a common problem. I need a “quarterly” timing system for my 401k. All the funds have minimum 90 day holding periods (even the Vanguard Index funds), which make it very difficult to deal with the whipsaws of weekly or monthly timing systems (MAC-US etc.) The penalties for violating the holding periods are very high (2% of your entire account).
Do you guys have a system that meets a quarterly time-frame? Or is there a system out there somewhere (that beats buy and hold)?
What funds are available in your 401k?
Or between which funds would you like to alternate?
I’d like a simple quarterly buy/sell for the Vanguard S&P 500 index fund, which (in my 401k) has a 90 day hold period (after purchase date). So… if there’s a “sell/buy/sell” whipsaw signal – within 90 days, I get socked with a $10,000 fee (2% penalty) if I sell, which of course I would not do – in order to avoid the fee. After the 90 day holding period, I can sell the fund with no penalty.
Simple weekly or monthly buy/sell systems don’t work well in this scenario. I’ve thought about switching from the S&P 500 to Vanguard Midcap index (or Small Cap index) after the first “sell/buy” but if that is followed by another “sell” – the Midcap fund also has a 90 day holding period… so I’d be forced to “hold” in order to avoid the huge fee.
I could probably just use the Mac-US as a quarterly system (on my own), but I have not “back-tested” that. I wanted to get some feedback on what system might work best… from you.
Is a quarterly system just too wide a time-frame to be of any practical use (over buy-and-hold)?
I’m sure there are a lot of people with 401k’s that have long minimum holding periods for their funds (with huge penalties) who might like a one-size-fits-all simple buy/sell quarterly system.
Thanks
Can you do the equivalent of 50%(VTI-BND) + 50%(MDY-BSV) in your 401k?
The only bond funds are:
1) PIMCO Total Return
2) Vanguard Inflation Prot
3) Templeton Global Bond
They all also have 90 day holding periods after initial purchase.
Before you spend any more time crunching, I just made some phone calls and figured out I had the wrong info on holding periods.
Vanguard Index funds are an exception… with a short 30 day holding period. Then you have to stay out for 30 days before you can buy back in. Our 401k changes its investment options so frequently that I got mixed up with the previous Dryfus Index fund rules.
The 401k managers limit trading also… but I think I can skirt those rules by trading into Midcap Index after 60 days instead of going back to SP500 (if there’s a BUY/SELL/BUY whipsaw).
401k’s require a decent amount on configuring so I may still go with a quarterly system to avoid all the rules and regs. I back-timed an “absolute momentum” quarterly timing system at Portfolio Visualizer and got very positive results over several time periods.
Thanks for spurring me to do more research.
Langford,
You can use the signals from the Composite Market Timer.
https://imarketsignals.com/2016/composite-market-timing-increases-returns-and-reduces-drawdown/
A simulation switching between ETFs MDY and IEF, and holding a position for a minimum period of 41 days, shows a 19.15% annualized return from Jan-2000 to Mar-2017, with a max D/D of -16.2%.
This means that the earliest a position can be sold is six weeks after it was bought, or the same ETF can only be re-bought at the earliest after 12 weeks.
So all you have to do is to check the iM-Composite Market Timer 41 days after you initiate a new position, and then every week thereafter until the signal changes. We email the signals on Sundays for trading on the first trading day of the week.
Here is the backtest info for an initial investment of $100,000:
General Info
Total Market Value (inc. Cash) $ 2,034,903.91
Cash $ 194.27
Number of Positions 1
Last Trades (1) 02/06/17
Period 01/02/00 – 03/15/17
Last Rebalance 03/13/17
Rebalance Frequency Weekly
Benchmark SPDR S&P 500 ETF Trust
Universe All ETFs
Ranking System Ranking for Composite Market Timer MDY-IEF
Quick Stats as of 3/15/2017
Total Return 1,934.90%
Benchmark Return 121.68%
Active Return 1,813.23%
Annualized Return 19.15%
Annual Turnover 291.18%
Max Drawdown -16.18%
Benchmark Max Drawdown -55.19%
Overall Winners (38/51) 74.51%
Sharpe Ratio 1.46
Correlation with SPDR S&P 500 ETF Trust 0.30
Here is the list of trades:
Symbol … Open … Close … Days … Pct
IEF … 9/6/2016 … 11/7/2016 … 62 … -1.80%
MDY … 6/27/2016 … 9/6/2016 … 71 … 11.60%
IEF … 12/28/2015 … 6/27/2016 … 182 … 6.70%
MDY … 11/16/2015 … 12/28/2015 … 42 … -0.90%
IEF … 10/5/2015 … 11/16/2015 … 42 … -1.60%
MDY … 8/24/2015 … 10/5/2015 … 42 … 3.50%
IEF … 6/15/2015 … 8/24/2015 … 70 … 2.90%
MDY … 5/4/2015 … 6/15/2015 … 42 … 0.40%
IEF … 12/22/2014 … 5/4/2015 … 133 … 0.30%
MDY … 5/13/2013 … 12/22/2014 … 588 … 22.10%
IEF … 4/1/2013 … 5/13/2013 … 42 … -0.30%
MDY … 8/27/2012 … 4/1/2013 … 217 … 17.50%
IEF … 7/2/2012 … 8/27/2012 … 56 … -0.10%
MDY … 1/30/2012 … 7/2/2012 … 154 … 1.20%
IEF … 9/19/2011 … 1/30/2012 … 133 … 1.20%
MDY … 8/8/2011 … 9/19/2011 … 42 … 10.10%
IEF … 5/16/2011 … 8/8/2011 … 84 … 6.10%
MDY … 10/11/2010 … 5/16/2011 … 217 … 21.10%
IEF … 8/30/2010 … 10/11/2010 … 42 … 1.30%
MDY … 6/28/2010 … 8/30/2010 … 63 … -2.70%
IEF … 5/17/2010 … 6/28/2010 … 42 … 3.70%
MDY … 1/25/2010 … 5/17/2010 … 112 … 9.30%
IEF … 11/16/2009 … 1/25/2010 … 70 … -1.50%
MDY … 10/5/2009 … 11/16/2009 … 42 … 4.90%
IEF … 6/1/2009 … 10/5/2009 … 126 … 3.40%
MDY … 3/23/2009 … 6/1/2009 … 70 … 19.90%
IEF … 7/2/2007 … 3/23/2009 … 630 … 18.60%
MDY … 3/19/2007 … 7/2/2007 … 105 … 9.00%
IEF … 2/5/2007 … 3/19/2007 … 42 … 1.90%
MDY … 10/2/2006 … 2/5/2007 … 126 … 12.60%
IEF … 5/22/2006 … 10/2/2006 … 133 … 2.80%
MDY … 1/3/2006 … 5/22/2006 … 139 … 1.20%
IEF … 10/24/2005 … 1/3/2006 … 71 … 0.30%
MDY … 9/6/2005 … 10/24/2005 … 48 … -3.00%
IEF … 7/25/2005 … 9/6/2005 … 43 … 0.90%
MDY … 4/18/2005 … 7/25/2005 … 98 … 13.10%
IEF … 9/20/2004 … 4/18/2005 … 210 … -1.60%
MDY … 8/9/2004 … 9/20/2004 … 42 … 6.50%
IEF … 6/28/2004 … 8/9/2004 … 42 … 3.30%
MDY … 5/17/2004 … 6/28/2004 … 42 … 6.60%
IEF … 4/5/2004 … 5/17/2004 … 42 … -3.10%
MDY … 9/29/2003 … 4/5/2004 … 189 … 19.80%
IEF … 6/16/2003 … 9/29/2003 … 105 … -4.80%
MDY … 3/31/2003 … 6/16/2003 … 77 … 20.80%
IEF … 10/28/2002 … 3/31/2003 … 154 … 1.80%
MDY … 9/3/2002 … 10/28/2002 … 55 … -2.00%
IEF … 11/13/2000 … 9/3/2002 … 659 … 24.00%
MDY … 10/2/2000 … 11/13/2000 … 42 … -7.60%
IEF … 6/19/2000 … 10/2/2000 … 105 … 2.80%
MDY … 1/3/2000 … 6/19/2000 … 168 … 15.20%
Hello – thank you for all of this great information,
I am a long time “buy-and-holder” wanting to implement the MAC-US timer. Where do you gather the data for this timer, such as the EMA, etc.
Thank you – I look forward to hearing from you.
Nick
The data was downloaded from Yahoo Finance which must be adjusted for dividends. EMA is short for Exponential Moving Average. http://investexcel.net/how-to-calculate-ema-in-excel/
Thank you – I look forward to implementing this strategy in my portfolio. Your help is greatly appreciated.
Nick
Does this entry and exit system also work for other markets?
Thanks
We have a MAC Australia at iM.
There is a lot of correlation between other markets and the US stock market.
We did an analysis using our (SPY-SH) model which you can find here:
Better Returns from World Markets with iM-Best(SPY-SH) Market Timing System
https://web.archive.org/web/20160627174822/http://www.advisorperspectives.com/dshort/guest/Georg-Vrba-131004-World-Markets-Timing-System.php
Note, web.archive takes a bit of time to upload.
Using the investment periods determined for the US market with the iM-Best(SPY-SH) Market Timing System, we calculated performance figures for 9 major country indices. The system, if followed, would have improved returns from all markets. From January 2000 to August 2013 with market timing, the best performing index in local currency was IBOVESPA – Brazil, and in US-dollars the DAX – Germany, closely followed by Brazil.
I think 13/48.5 EMA is better?
http://etfhq.com/blog/2013/01/15/golden-cross-which-is-the-best/
I’m very impressed that you came up with a moving average model with such a good backtest. However, I’d like to suggest an improvement. It appears that there were false signals in 2011 and 2015. In order to separate the noise from the signal, I think this model will be better if we added another condition stating that the MAC sell signal is only valid after yield curve inversion during each cycle. Just an idea.
Good thought, but I believe if the YC filter was added, 1987 would not have been “caught” and Dec 2018 would not have been “partially caught”… so tradeoffs on both sides of the coin.
Hey Guys,
Which is correct?
has a sell signal occurred signal date 11-25-18 for switching to cash on 1st trading day of week (Nov 26) as per the Nov 25 website shows MAC-US Timer-cash or
is the sell signal to be generated next week thus calling for switching to cash on 1st trading day of week (Dec 3) per the weekly macro signals Nov 23 and your corresponding chart and other data as of market close 11-23-18 show that a sell signal has not been generated because the 40-day simple moving average (SMA) of the S&P 500 has not crossed below the 200-day SMA of the S&P 500.
Per Market Signals Summary “The MAC-US model is invested, but will signal a sell early next week….and simulations show it will fall below zero early next week, thus signaling a sell.”
Does that mean we would use Nov 26 or Dec 3 as the switching to cash date?
Thank you for clarifying
Simulations on Friday 11/23/2018 showed that the MAC will switch to cash after Monday 11/26 or Tuesday 11/27 close.
We give this information for you to make better informed decisions.
so following the rules of the model:
if 40 sma crosses below 200 sma on Monday’s close, then the model performance record will show moving to cash as a date of 11-26 (i.e. 1st trading day of week signal date)
if crossover occurs on Tues or later then following model rules dictates “All trading is assumed to occur on the first trading day of the week after or when a signal from the MAC-US Timer was generated” thus the model performance record will show moving to cash as Dec 3.
Is that correct?
Thank you for your prompt response