
A Dynamic Asset Allocation strategy applied to bond- and stock-funds increases returns and reduces risk. During up-market periods more money is allocated to stock funds than bond funds, and conversely during down-market periods more money is allocated to bond funds than stock funds. The up- and down-market periods come from our MAC-US .
Weekly Data Updates relevant to Retirement Accounts
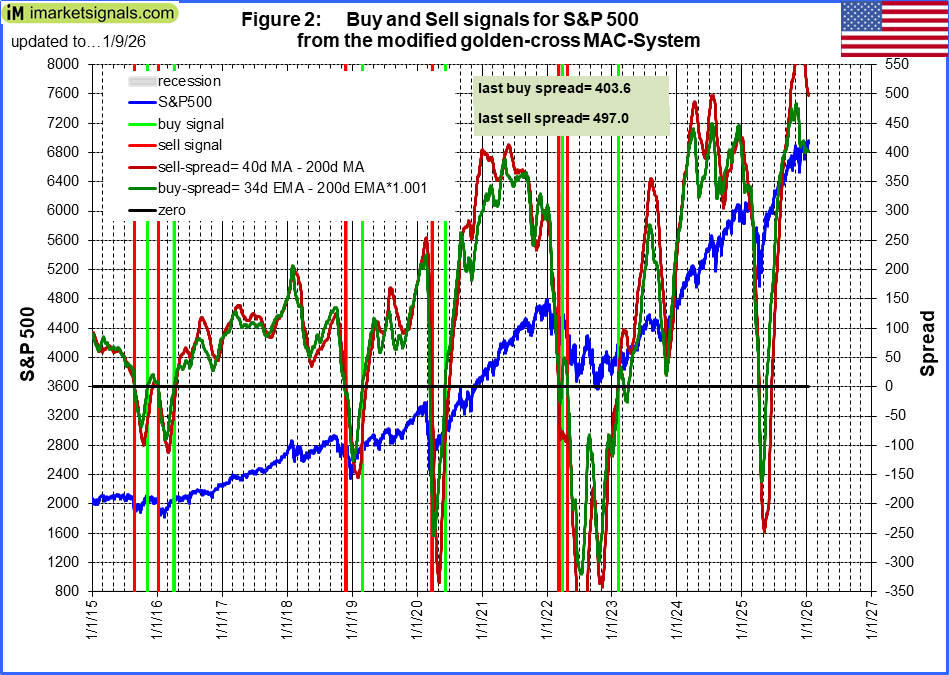
(i) The MAC-US: If sell-spread falls below zero a down-stockmarket is signaled. Subsequently when buy-spread moves from below to above zero an up-stockmarket is indicated.
|
6/5/2026: Latest update only available to Bronze members 1/9/2026: The MAC-US model is invested since mid June 2025, .
|
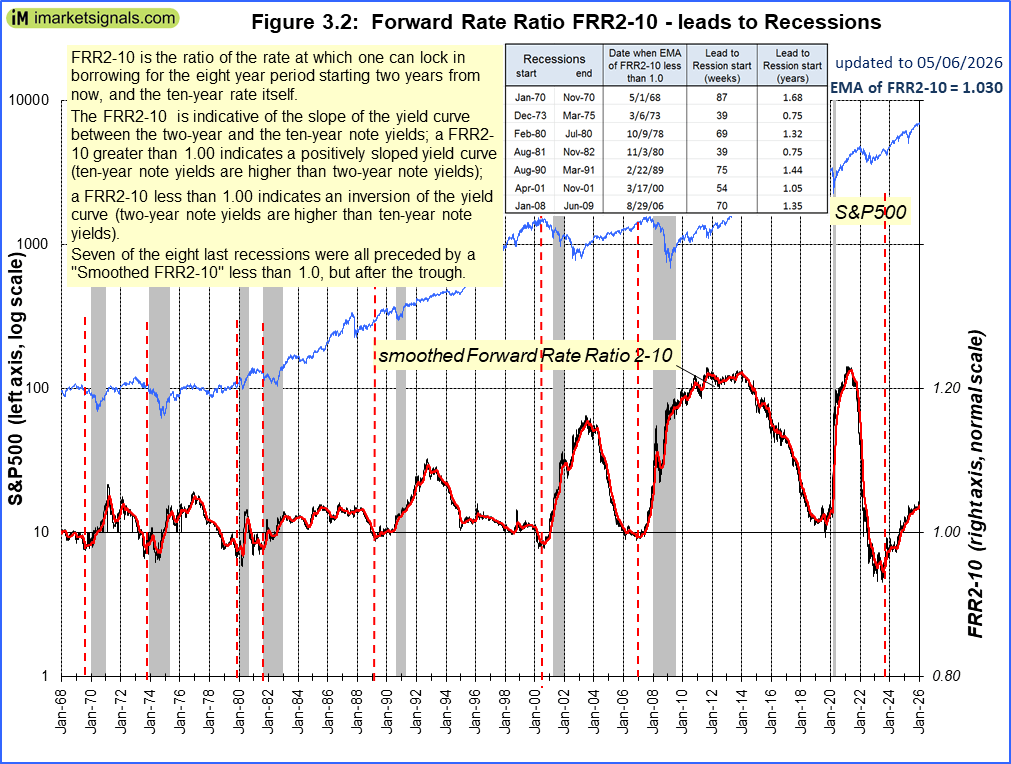
(ii) The Recession Indicators COMP, BCI and FRR2-10: If a recession is signaled it may be advisable to exit stock market completely. These three recession indicators have different lead times: FRR2-10 an average of 14 months, BCIp an average of 20 weeks, and COMP (as well as BCIg) an average of 10 weeks.

|
6/5/2026: Latest update only available to Bronze members 1/9/2026: show=0]
Market Signals Summary:The iM-Google Trend, the MAC-US, S&P 500 Coppock Indicator, and CAPE-Cycle-ID are invested whereas the 3-Month Hi-Lo Index Index are dis-invested. The BCIg does not signal a recession as does the growth of the Conference Board’s Leading Economic Indicator. The Forward Rate Ratio between the 2 and 10 is no longer inverted and the curve is steepening. The iM-Gold Coppock and the iM-Gold Timer are invested in gold. The iM-Silver Coppock is invested in silver.
Stock-markets: The MAC-US model is invested since mid June 2025, The MAC-US model is invested since mid June 2025,
.
|

|
6/4/2026: Latest update only available to Bronze members 2/20/2026: |
|
6/5/2026: Latest update only available to Bronze members 5/8/2026: The Forward Rate Ratio between the 2-year and 10-year U.S. Treasury yields (FRR2-10) is no longer inverted and the curve is steepening. A description of this indicator can be found here. |

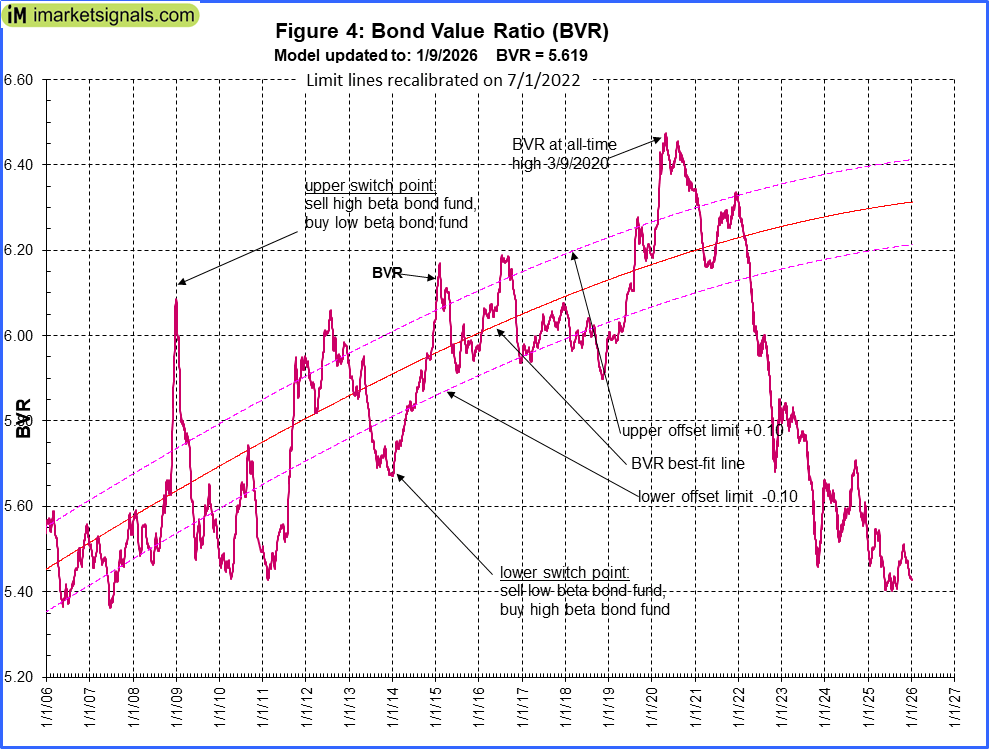
(iii) The Bond Value Ratio (BVR): To determine whether to be invested in long-bond funds or short-bond funds.
|
6/5/2026: To view latest update please log in 1/9/2026: The BVR-model favors high beta bonds (long-bonds) and intermediate duration bonds when the BVR rises. The Bond Value Ratio as shown in Fig 4 is above last week’s value, and according to the model, only when BVR turns upward after having been lower than the lower offset-line should one consider long bonds again. |
Monthly Data Updates relevant to Retirement Accounts
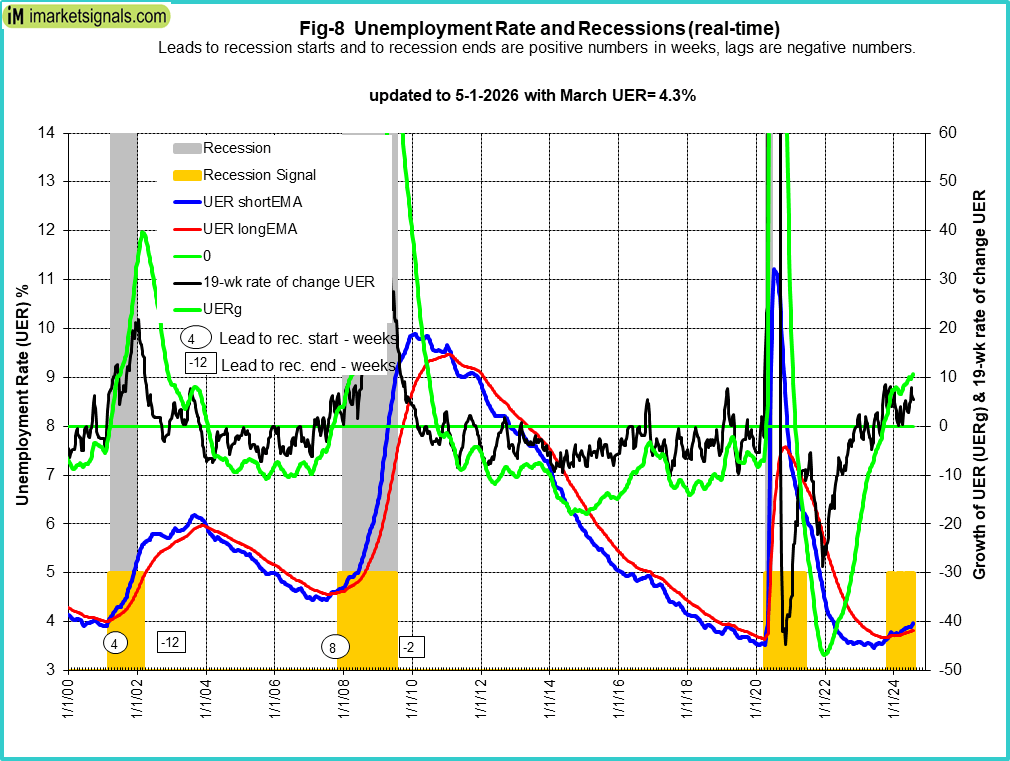
(iv) The Unemployment Rate Recession Model: If a recession is signaled it may be advisable to exit stock market completely.
|
5/8/2026: To view latest update please log in 4/3/2026: 
The 5/8/2026 BLS Employment Situation Report reports that the April 2026 unemployment rate remained unchanged at 4.3%. Our UER model does signal a recession with a near zero recession probability of (see graph).
CAPE-Cycle-ID Fig 9a depicts the CAPE-Cycle-ID and the year-on-year rate-of-change of the Shiller CAPE; the level switched from -2 to 0 end of June 2023 generating a buy signal. This indicator now invested in the markets. This indicator is described here. Fig 9a depicts the CAPE-Cycle-ID and the year-on-year rate-of-change of the Shiller CAPE; the level switched from -2 to 0 end of June 2023 generating a buy signal. This indicator now invested in the markets. This indicator is described here.
To avoid the bear market, exit stocks when the spread between the 5-month and 25-month moving averages of S&P-real becomes negative and simultaneously the CAPE-Cycle-ID score is 0 or -2. (read more)
Estimated Forward 10-Year Returns The estimated forward 10‐year annualized real return is 4.7% (previous month 5.0%) with a 95% confidence interval 3.3% to 6.2% (3.6% to 6.5%). Also refer to the Realized Forward 10-Year Returns vs. Inflation Rate The estimated forward 10‐year annualized real return is 4.7% (previous month 5.0%) with a 95% confidence interval 3.3% to 6.2% (3.6% to 6.5%). Also refer to the Realized Forward 10-Year Returns vs. Inflation Rate  We may be in a rising inflation period with a falling CAPE-MA35 ratio similar to 1964-1973. This implies very low or negative 10 year forward annualized real returns, much lower than the returns indicated by regression analysis shown in the Estimated Forward 10-Year Returns. We may be in a rising inflation period with a falling CAPE-MA35 ratio similar to 1964-1973. This implies very low or negative 10 year forward annualized real returns, much lower than the returns indicated by regression analysis shown in the Estimated Forward 10-Year Returns.
.
iM-GT Timer The iM-GT Timer, based on Google Search Trends volume indicator is not invested in the stock markets since beginning November 2025. This indicator is described here. The iM-GT Timer, based on Google Search Trends volume indicator is not invested in the stock markets since beginning November 2025. This indicator is described here.
|
(iv) The TIAA Real Estate Timed Account : If rolling 1-year return falls below 0% model goes to cash. Subsequently when rolling 1-year return moves above 0% a new investment is made.

|
5/8/2026: To view latest update please log in 4/3/2026: > The 5/8/2026 BLS Employment Situation Report reports that the April 2026 unemployment rate remained unchanged at 4.3%. Our UER model does signal a recession with a near zero recession probability of (see graph).
CAPE-Cycle-IDFig 9a depicts the CAPE-Cycle-ID and the year-on-year rate-of-change of the Shiller CAPE; the level switched from -2 to 0 end of June 2023 generating a buy signal. This indicator now invested in the markets. This indicator is described here.
To avoid the bear market, exit stocks when the spread between the 5-month and 25-month moving averages of S&P-real becomes negative and simultaneously the CAPE-Cycle-ID score is 0 or -2. (read more)
Estimated Forward 10-Year ReturnsThe estimated forward 10‐year annualized real return is 4.7% (previous month 5.0%) with a 95% confidence interval 3.3% to 6.2% (3.6% to 6.5%). Also refer to the Realized Forward 10-Year Returns vs. Inflation Rate We may be in a rising inflation period with a falling CAPE-MA35 ratio similar to 1964-1973. This implies very low or negative 10 year forward annualized real returns, much lower than the returns indicated by regression analysis shown in the Estimated Forward 10-Year Returns.
.
iM-GT TimerThe iM-GT Timer, based on Google Search Trends volume indicator is not invested in the stock markets since beginning November 2025. This indicator is described here.
|

Dynamic Asset Allocation Models (monthly)
(vi) Vanguard Systems: Historical performance and current allocations are shown for three systems: 1a, 2a and 3a. The three different systems range from a mix of conservative index funds to moderately aggressive managed Vanguard funds. Each system has three sub-systems with different allocations between bond- and stock-funds (20/80, 30/70 and 40/60). For example, 20/80 signifies a nominal allocation of 20%bonds and 80%stocks during up-market periods, and 80%bonds and 20%stocks during down-stock market periods. The most conservative allocation would be 40/60. Although the models use particular bond funds, it may be advisable to consult the BVR model to determine whether to be invested in long-bond funds or short-bond funds.
.
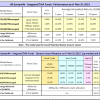 |
12/7/2018: Performance comparison of the iM Vanguard Systems, read more .... |
(vii) Vanguard + TIAA Systems: Historical performance and current allocations are shown for four systems: 1b, 2b, 3b and 4a. The four different systems range from a mix of conservative index funds to moderately aggressive managed Vanguard funds in combination with the TIAA Real Estate Account. Each system has three sub-systems with different allocations between bond- and stock-funds & TIAA Real Estate Account (20/80, 30/70 and 40/60). The most conservative allocation would be 40/60. Although the models use particular bond funds, it may be advisable to consult the BVR model to determine whether to be invested in long-bond funds or short-bond funds.
|
12/7/2018: Performance comparison of the iM Vanguard Systems combined with TIAA Real Estates timed, read more .... |
iM-News eMail Service
(vii) Friday’s Weekly Update: A ticked box indicates that you will receive Friday’s update email. (You can toggle the tick by clicking on the box.) The email notifies, subject to membership category, any signals that may have been generated, as well as the current nominal allocations for the above models are publicized.
Leave a Reply
You must be logged in to post a comment.