
- This system invests in well capitalized companies with strong market positions, which pay good dividends, have price appreciation potential, and provide a degree of downside protection during bear markets.
- The portfolio is quarterly rebalanced and reconstituted, and consists of six large-cap stocks with Capital Strength type characteristics from the Russell 1000 Index, typically held for at least one year.
- A backtest, from Jan-2000 to end of Jun-2017, showed a 17.7% annualized return with a maximum drawdown of -23.3% and a low average annual turnover of about 70%.
- A comparison with Vanguard’s large-cap ETFs older than 10 years shows that for all listed investment periods the Portfolio would have produced higher returns than any of the five ETFs.
The system described here is a tax efficient version of the iM 6-Stock Capital Strength Portfolio. The holding period is typically for longer than one year to take advantage of the lower tax rate for long-term capital gains. The backtest showed gains of 18.9% for this year, and 35.9% over one year, to Jun-30-2017.
The iM 6-Stock Capital Strength Portfolio, iM Capital Strength Universe and the Ranking System are described here.
Buy Rules
Stocks may not occupy more than 40% of any specific sector of the Global Industry Classification Standard. During weak economic conditions, as signaled by the iM Composite Market Timer, stocks selected must also have 3- and 5-year Beta values of less than 0.90 and 1.25, respectively.
Sell Rules
If current positions fall out of the universe then these stocks are only sold at time of rebalancing, but stocks subject to corporate mergers or offers to buy are sold immediately. Stocks are equally weighted initially and on each rebalancing effective date. The portfolio is reconstituted and rebalanced quarterly, on the first trading day of the last week of January, April, July, and October.
A minimum 1-year holding period is specified. However stocks can be sold after 90 days if the Percentage change from highest close since the position was started becomes less than -10%, after 180 days if the return of an existing position is less than -15%, and after 270 days if the return of an existing position is less than 0%. The tax efficiency is not affected by holding losing stocks for less than one year.
Trading Effort
The average annual turnover from 2000 to 2017 was only about 70%. Little effort is required to follow this model as there were only 76 realized trades from 2000 to 2017. Also 63% of all trades had a holding period longer than one year, providing tax efficiency if traded in a taxable account. Additionally there were 53 minor adjustment trades resulting from rebalancing.
|
Holding period |
Pct. of all trades |
Number of trades 2000-2017 |
|
7-21 days |
– |
0 |
|
22-42 days |
– |
0 |
|
43-92 days |
6.6% |
5 |
|
93-183 days |
13.2% |
10 |
|
184-240 days |
– |
0 |
|
241-365 days |
17.1% |
13 |
|
More than a year |
63.2% |
48 |
Table-1 shows further details of all realized trades from the backtest. The system produced a win rate of 66% and provided an average dividend yield (including special dividends) of 4.4% over the total investment period 2000-2017. The average return of all 76 trades was 16.9%.
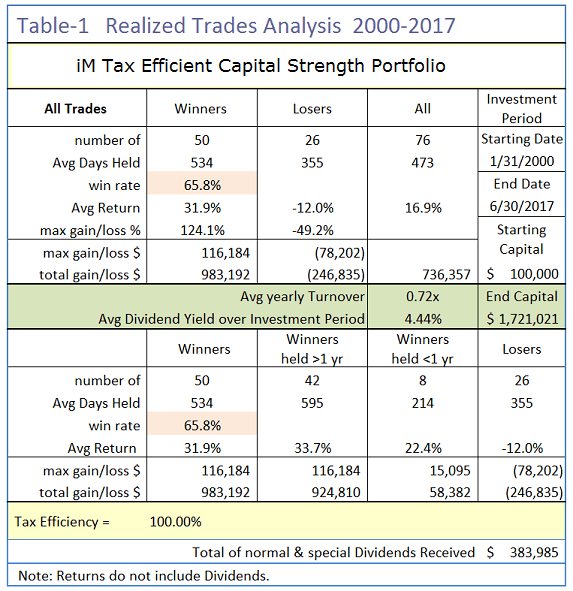
The Tax Efficiency of this model was 100%. Winning trades held less than one year produced a gain of $58,382 while losers lost a total of $246,835, thereby eliminating short term gains. This is for the total investment period; yearly performance could have been different.
Performance Comparison with Vanguard Large-Cap ETFs and SPY
The performance comparison is shown in the table below with the simulated returns of iM-Tax Efficient Capital Strength Portfolio shown highlighted. It is apparent that for all periods the Portfolio significantly out-performed all the Vanguard Large-Cap ETFs, as well as the SPDR S&P 500 ETF.
|
as of 6/30/2017 |
Return |
Annualized Returns | ||||
|
YTD |
1 year |
3 year |
5 year |
10 year |
||
|
iM-Tax Efficient Capital Strength Portfolio |
19.71% |
37.81% |
24.35% |
24.47% |
20.95% |
|
|
Vanguard Dividend Appreciation ETF |
VIG |
9.94% |
13.75% |
8.29% |
12.75% |
7.41% |
|
Vanguard High Dividend Yield ETF |
VYM |
4.77% |
12.73% |
8.95% |
13.64% |
7.08% |
|
Vanguard Growth ETF |
VUG |
14.71% |
20.19% |
10.14% |
14.87% |
8.81% |
|
Vanguard Large-Cap ETF |
VV |
9.49% |
18.24% |
9.39% |
14.58% |
7.33% |
|
Vanguard Value ETF |
VTV |
5.13% |
16.54% |
8.76% |
14.39% |
5.84% |
|
Average return of Vanguard funds |
8.81% |
16.29% |
9.11% |
14.05% |
7.29% |
|
|
SPDR S&P 500 ETF |
SPY |
9.17% |
19.38% |
9.47% |
14.49% |
7.07% |
Performance 2000-2017
Performance from Jan-2000 to Jun-2017 is shown in Figure-1. The model produced an annualized return of 17.7% with a -23.3% maximum drawdown. An initial investment of $100 would have grown to $1,724. The maximum drawdown was significantly less than for benchmark SPDR S&P 500 ETF (SPY), the ETF tracking the S&P500, which can be attributed to the relatively better performance of Capital Strength type stocks during down market periods.
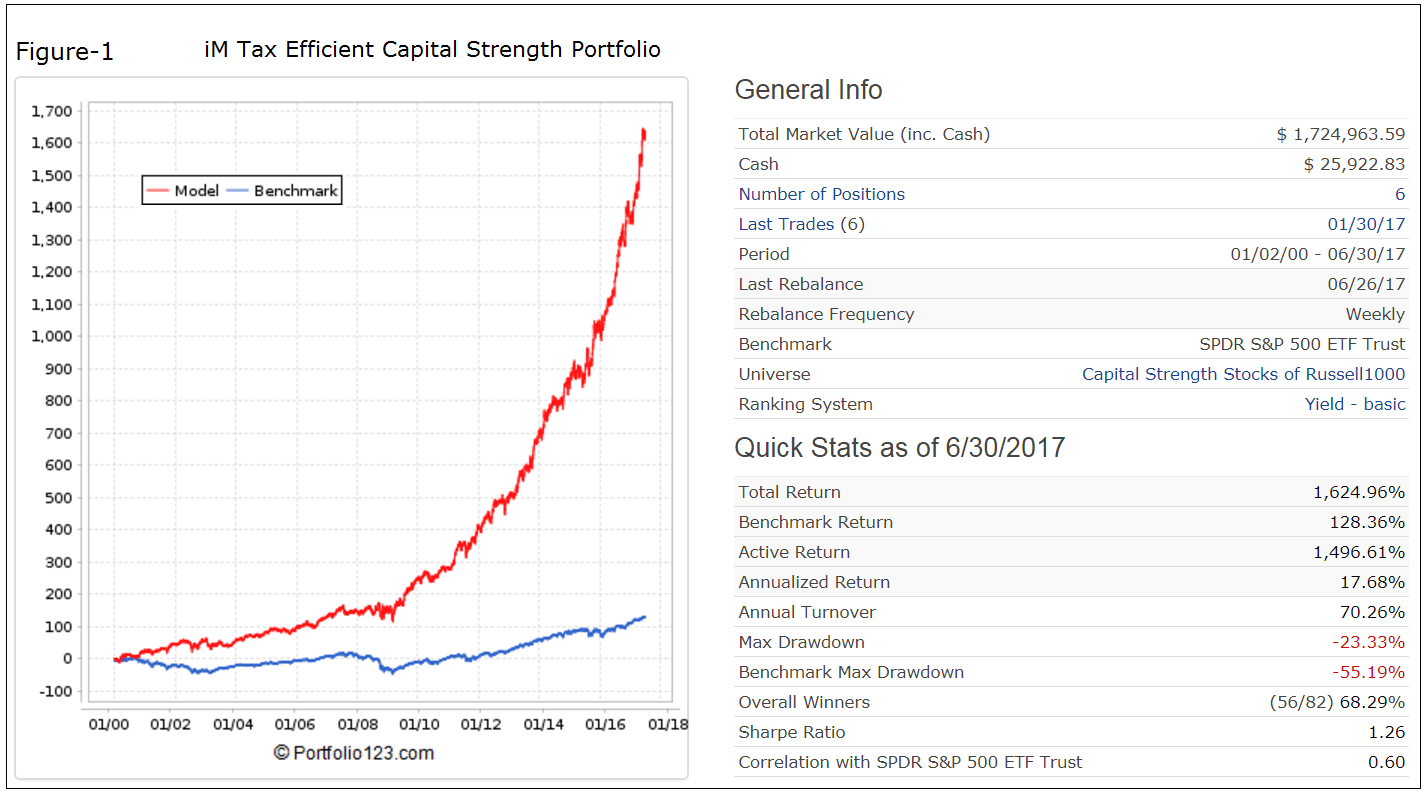
This model shows a very low average annual turnover of about 70% (0.7 x). The average holding period of a position was 473 days and share price was taken as the closing price for the day. Trading cost, including slippage, was taken as approximately 0.15% of trade amounts.
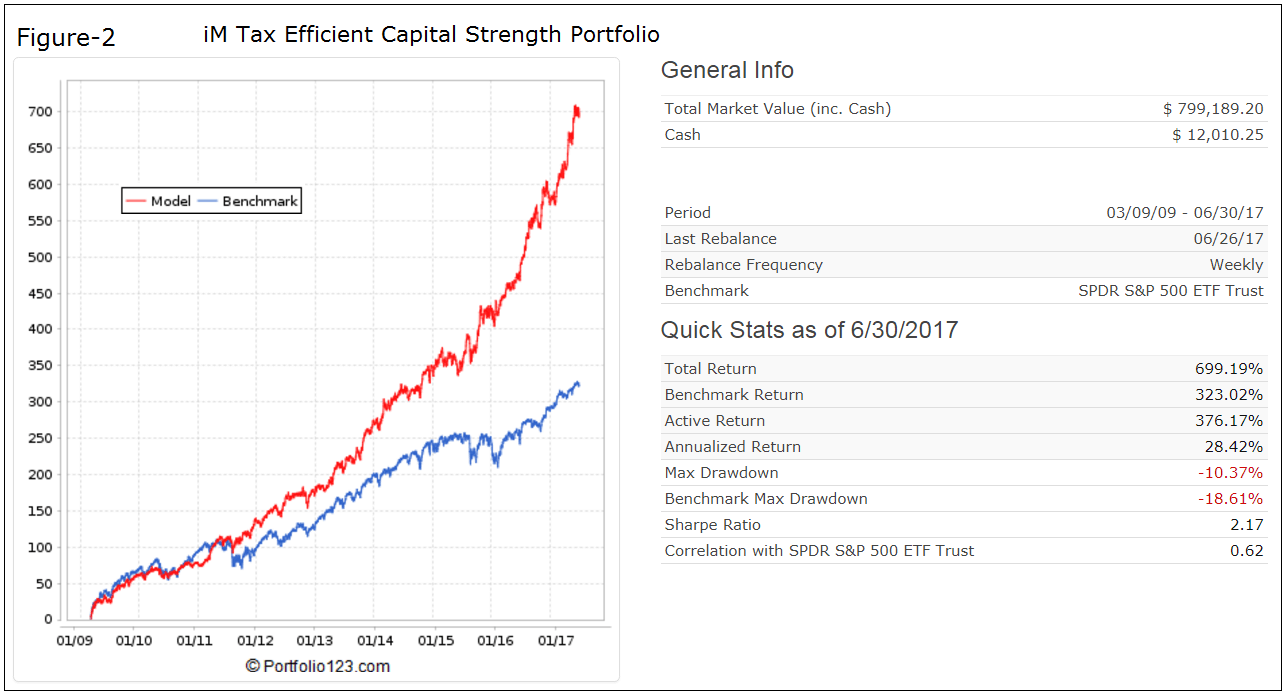
Performance 2009-2017
The simulated performance from Mar-9-2009 to Jun-30-2017 is shown in Figure-2. The start date for this period is the date when the S&P 500 was at its lowest level during the financial crisis recession. For the approximately 8-year long backtest period the simulated annualized return was 28.4% with a maximum drawdown of -10.4% producing about two times the total return of ETF (SPY) with lower drawdown.
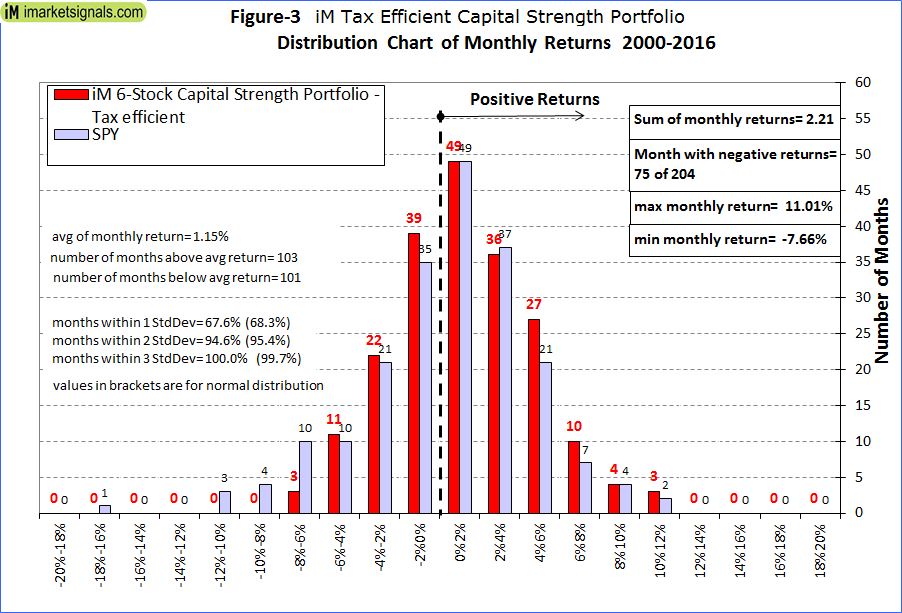
Distribution of Monthly Returns
Figure-3 shows the distribution of monthly returns for the full calendar years 2000 to 2016. The normal distribution can be observed from the bar graph pattern and the percentages of monthly returns contained within the standard deviations from the mean. The model produced an average monthly return of 1.15%, with 63% of all months producing a positive return.
Risk Measurements
Risk measurements are from Portfolio 123. The Portfolio appears to be less risky than buy-and-hold of ETF (SPY), as confirmed by the relatively low Standard Deviation and Beta, and high Sharpe- and Sortino Ratios. Alpha indicated excess returns relative to return of the benchmark (SPY) is about 15% annualized.
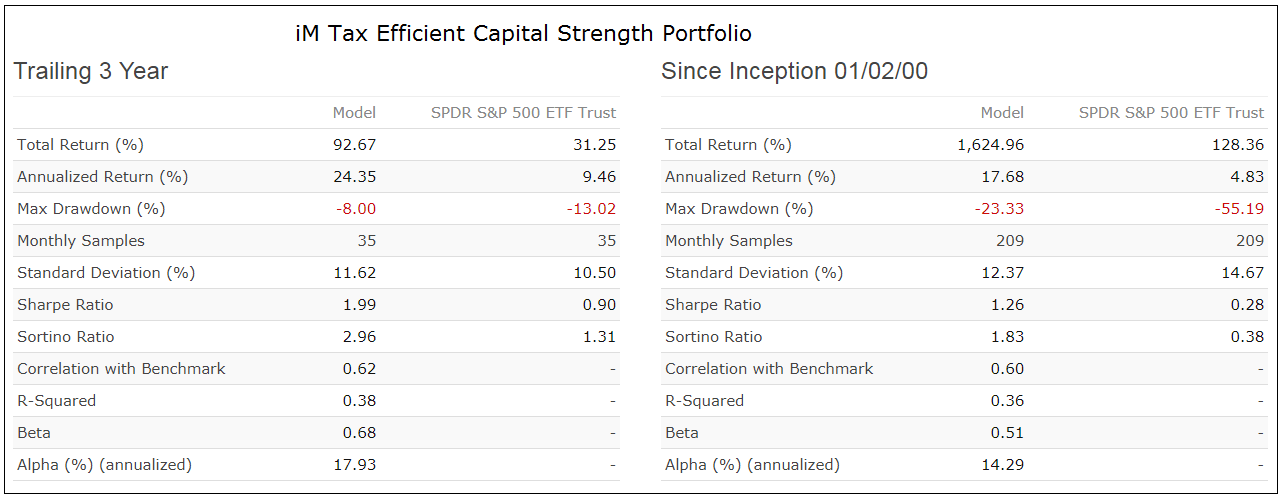
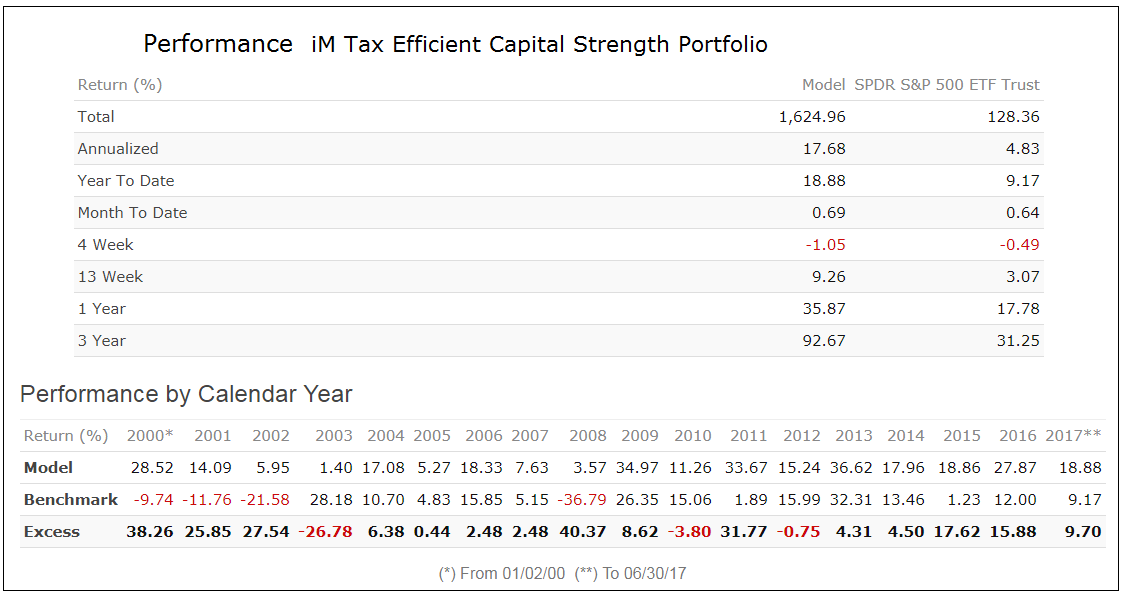
Performance Report
The performance report for the period 1/2/00 to 6/30/17 is from Portfolio 123. For all calendar years the iM-Tax Efficient Capital Strength Portfolio produced positive returns, but underperformed the benchmark (SPY) in 2003, 2010 and 2012.
Portfolio holdings
|
iM-Tax Efficient Capital Strength Portfolio Holdings on 7/12/2017 |
||||
|
Ticker |
Name |
MktCap $-Billion |
Sector Code |
Yield (%) |
|
BA |
Boeing Co |
125.0 |
INDUSTRIAL |
2.75 |
|
BBY |
Best Buy Co Inc |
16.4 |
DISCRETIONARY |
2.53 |
|
CLX |
Clorox Co. |
17.0 |
STAPLE |
2.55 |
|
HPQ |
HP Inc |
30.2 |
TECH |
2.96 |
|
INTC |
Intel Corp |
163.3 |
TECH |
3.14 |
|
LVS |
Las Vegas Sands Corp |
49.0 |
DISCRETIONARY |
4.72 |
Following the model
At iMarketSignals we publish trade signals and also report the performance on a weekly basis, a Silver subscription is required. In addition we update weekly the iM Capital Strength Select 20 of Russell 1000, however a Gold subscription is required.
Disclaimer
Note: The backtest indicates above market returns with drawdowns better than for the broader market, as one would expect from a system investing in Capital Strength type stocks. However, all performance results are hypothetical and the result of backtesting over the period 2000 to 2017. No claim is made about future performance.
Georg,
Have you done a model incorporating a trailing stop into this system?
This model sells a position after being held for more than 90 days, if a position loses more than 10% from the highest close since position was started.