
- The iM-Bond Market Trader exploits the fact that, generally, when equity returns are good high yield bonds outperform investment grade bonds.
- When equity performs well the model invests in one of the high yield bond ETFs HYG, JNK, or EMB.
- If stock market climate deteriorates the model switches to Treasury Bond ETF IEF.
- Backtesting over the preceding 20 years the model showed a simulated annualized return of 14.6% with a maximum drawdown of -9.6%, versus 5.0% and -9.3% for benchmark ETF BND, respectively.
- Simulations also show that the model’s returns over any calendar year are positive and exceeded those of BND.
This model uses only four fixed income ETFs:
- iShares iBoxx $ High Yield Corporate Bond ETF (HYG)
- SPDR Bloomberg Barclays High Yield Bond ETF (JNK)
- iShares J.P. Morgan USD Emerging Markets Bond ETF (EMB)
- iShares 7-10 Year Treasury Bond ETF (IEF)
The strategy is to switch between one of the three high yield bond ETFs HYG, JNK, or EMB and the Treasury Bond ETF IEF according to the rules listed below, and to hold a position for at least two weeks.
Buy Rules
The strategy makes use of the observation that, generally, when equity returns are good high yield bonds outperform investment grade bonds. To asses the market condition this model uses the input from six independent, and low correlated, stock market timers. For an investment in high yield bonds, five or more of these timers have to signal investment in equity.
Additionally, the model considers the relative performance, over 10- and 20 weeks, of investment grade bonds compared to high yield bonds to determine whether to invest in high yield bonds or in IEF.
The selection of the high yield bond ETF is by means of a simple momentum type ranking system that uses price changes over long- and short periods.
Sell Rules
The model sells HYG or JNK when fewer than five of the underlying stock market timers signal to be in equity and the Cyclically Adjusted S&P500 Risk Premium (CARP) is less than 1.6%, otherwise it sells IEF. (CARP is calculated as 1/Shiller CAPE-Ratio – Yield of the 10-yr Treasury Bond.)
The model sells EMB when fewer than five of the underlying stock market timers signal to be in equity and does not consider the CARP.
A position is also sold if it loses more than 5% from a recent high.
Performance Backtest from 2000
A backtest from Jan-2000 to Aug-2019 was performed on the online simulation platform Portfolio 123 with transaction costs and slippage taken into account and compared with the returns of a buy-and-hold investment in Vanguard Total Bond Market Index Fund ETF (BND).
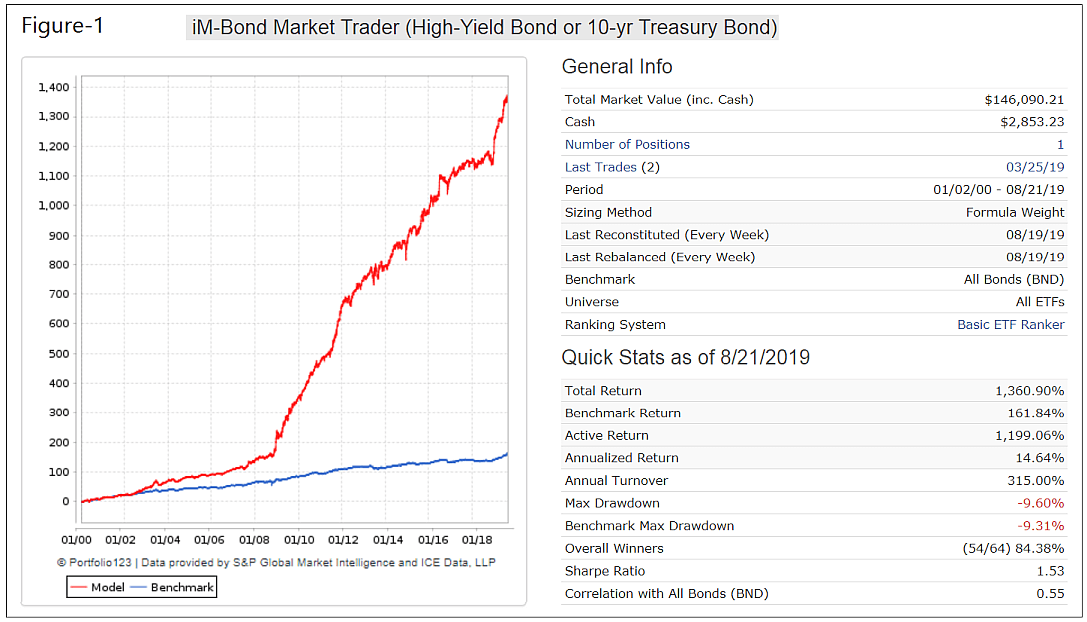
Performance over almost 20 years is shown in Figure-1. For the model the Total Return and Annualized Return would have been 1360% and 14.6%, respectively, with a Maximum Drawdown of -9.6%.
Over the same period the benchmark BND had a Total Return and Annualized Return of 162% and 5.0%, respectively, with a Maximum Drawdown of -9.3%.
The current holding since 3/25/2019 is ETF EMB.
Conclusion
From the analysis it appears that satisfactory returns can be had by investing in fixed income ETFs only.
Weekly performance and holding updates will be posted on our website and require a Gold subscription
Appendix
Realized Transaction Summary
| Symbol | Total Realized Transaction | Avg. Pct Return | Avg. Days Held | Total Number Days Held | Pct of Time Held | |
| 1 | IEF | 31 | 2.70% | 83.4 | 2,585 | 37% |
| 2 | EMB | 15 | 2.90% | 81.1 | 1,217 | 17% |
| 3 | HYG | 11 | 4.90% | 220.9 | 2,430 | 35% |
| 4 | JNK | 6 | 2.90% | 131.7 | 790 | 11% |
Current holding not included.
Calendar Year Pct Returns
| Year | Model | Benchmark | Excess |
| 2000 | 11.95 | 11.49 | 0.46 |
| 2001 | 9.07 | 8.32 | 0.75 |
| 2002 | 20.86 | 10.12 | 10.73 |
| 2003 | 14.49 | 3.98 | 10.51 |
| 2004 | 8.3 | 4.21 | 4.09 |
| 2005 | 4.33 | 2.31 | 2.03 |
| 2006 | 8.9 | 4.21 | 4.69 |
| 2007 | 13.64 | 7.48 | 6.15 |
| 2008 | 35.96 | 6.87 | 29.1 |
| 2009 | 40 | 3.63 | 36.36 |
| 2010 | 26.79 | 6.2 | 20.59 |
| 2011 | 33.68 | 7.93 | 25.76 |
| 2012 | 11.32 | 3.89 | 7.43 |
| 2013 | 5.1 | -2.11 | 7.21 |
| 2014 | 7.82 | 5.82 | 2.01 |
| 2015 | 11.69 | 0.56 | 11.13 |
| 2016 | 11.14 | 2.52 | 8.61 |
| 2017 | 4.68 | 3.57 | 1.11 |
| 2018 | 2.35 | -0.12 | 2.46 |
| 2019* | 14.27 | 8.83 | 5.43 |
| (*) To 08/20/19 | |||
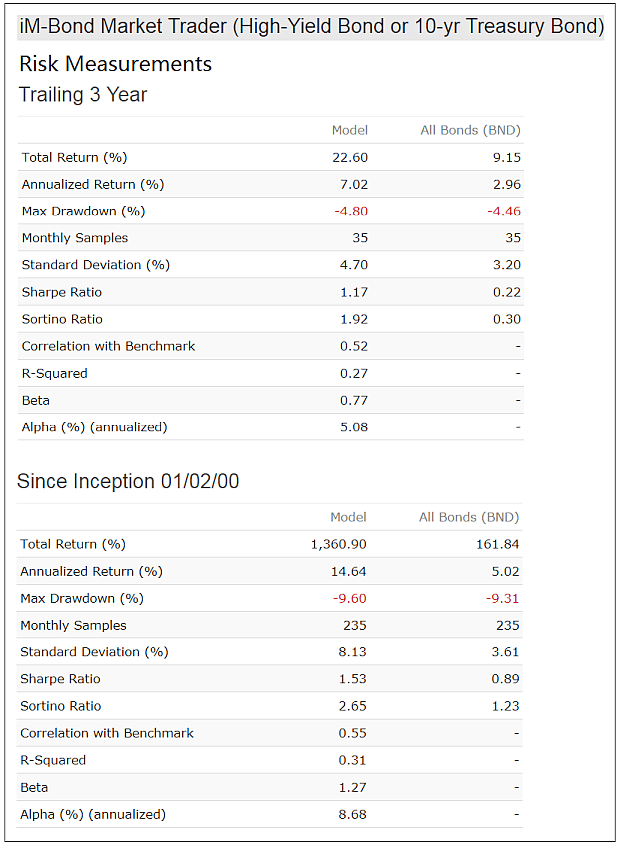
Risk Measurements
Hi,
Is it possible to have the correlation with SPY and also with some other Systems you produce (Best Spy-IEF, Combo5, Combo3, Std Trader, Min Drawdown, etc…..).
Thank you for your interesting work.
Hi George,
I second that request, especially it’s correlation to the Composite Timer/Super Timer.
Thanks
(High-Yield Bond or 10-yr Treasury Bond)
George,
Where can I find this on the weekly update ?I do not see “The iM Bond Market Trader” ?
Georg or Anton:
Can you post a list of the actual trades and trade dates?
Thanks
Jeff
Hi George,
Where can I find the “iM Bond Market Trader” protfolio in the weekly updates. What level is the protfolio in ie. Gold, Silver or Bronze.
hI George i’m interested in iM Bond Market Trader bur i don’t find this strategy in Performance weekly update
The above posted results, are they based upon the dividends held in cash and re-invested at a fund switch or immediately re-invested when paid? Thanks!
Dividends are re-invested when paid.
Nothing update ???
can you please add this strategy to the performance update?
can you please add this strategy to the performance update?
This was posted in your weekly summary page marked November 19 for this strategy. I don’t think its right and should be corrected. Maybe Im looking at the wrong strategy?
“A starting capital of $100,000 at inception on 10/30/2016 would have grown to $4,390 which includes $1,985 cash and excludes $1,985 spent on fees and slippage.”
Thanks
Thanks, corrected in this weeks update (11/26/2019)
I have a Vanguard Variable Annuity that has limited choices. Would one get decent results by basically buying VWEHX (high yield) when this model is not in IEF, and buying BND when the model indicates IEF?
Thanks.
Tom C
Tom, the returns will not be as high as for the model, but still better than holding BND b&h. In the list below are the annualized returns for a model switching between HYG (VWEHX) and BND instead of IEF, and for BND b&h.
from 1/1/2000 10.9% vs 5.0%
from 1/1/2005 10.4% vs 4.1%
from 1/1/2010 8.7% vs 2.8%
from 1/1/2015 6.9% vs 3.3%
Thanks! Wow, that’s still quite a boost and actually better than I expected.
Tom C
I believe replacing both JNK and HYG simply with USHY would’ve outperformed and with lower fees.