
- The iM-Gold Timer and the iM-Composite Market Timer are used in combination to signal periodic investments in gold, stocks and bonds.
- From Jan-2000 to Jan-2017 the Gold Timer signaled eight gold investment periods totaling only 9.3 years, while for the remaining periods totaling 7.7 years the model would have been in cash.
- During the “cash periods” the Composite Market Timer provides the signals when to invest in stock and/or bond ETFs. Bond ETFs include the ETF (XLU) are also selected according to the prevailing Market Climate Score (MC-Score) and a ranking system.
The model was backtested from Jan-2000 to Jan-2017 using the on-line portfolio simulation platform Portfolio 123, which also provides extended price data for ETFs prior to their inception dates calculated from their proxies. Trading costs of 0.1% of all trade amounts were applied to provide for slippage and broker commission.
The ETF Selection List:
In the simulation the specified position weight is 50%, requiring the model to always hold simultaneously two ETFs, which can be two gold-ETFs, or two stock-ETFs, or one stock- and on bond-ETF, or two bond-ETFs selected from the list below.
| GOLD: | SPDR Gold Shares (GLD), | |
| iShares Gold Trust (IAU). | ||
| STOCKS | Guggenheim S&P 500 Equal Weight ETF (RSP) | |
| ProShares Ultra S&P500 (SSO). | ||
| BONDS | when MC-Score <=3: | |
| iShares iBoxx $ Invst Grade Crp Bond (LQD), | ||
| Vanguard Emerging Markets Govt Bd ETF (VWOB), | ||
| Utilities Select Sector SPDR ETF (XLU). | ||
| BONDS | when MC-Score >3: | |
| Vanguard Mortgage-Backed Securities ETF (VMBS), | ||
| Schwab US TIPS ETF (SCHP), | ||
| Vanguard Intermediate-Term Bond ETF (BIV). | ||
Performance
The simulated performance is shown for three versions:
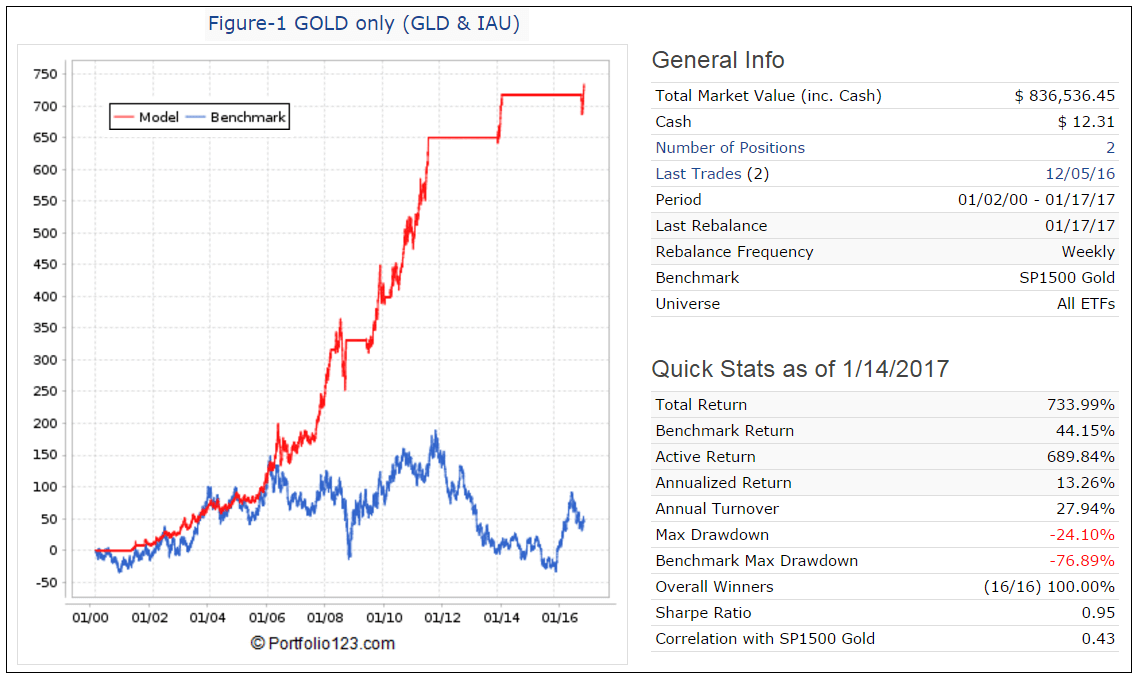
Figure-1: Gold only (iM-Gold Timer),
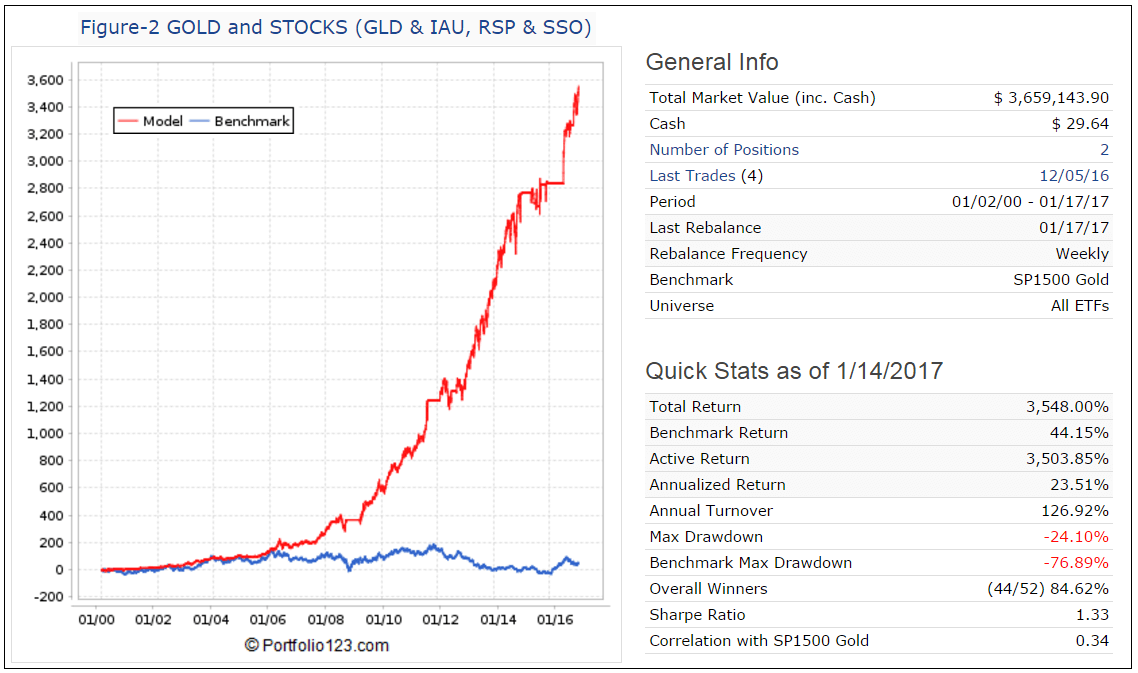
Figure-2: Gold and stocks,
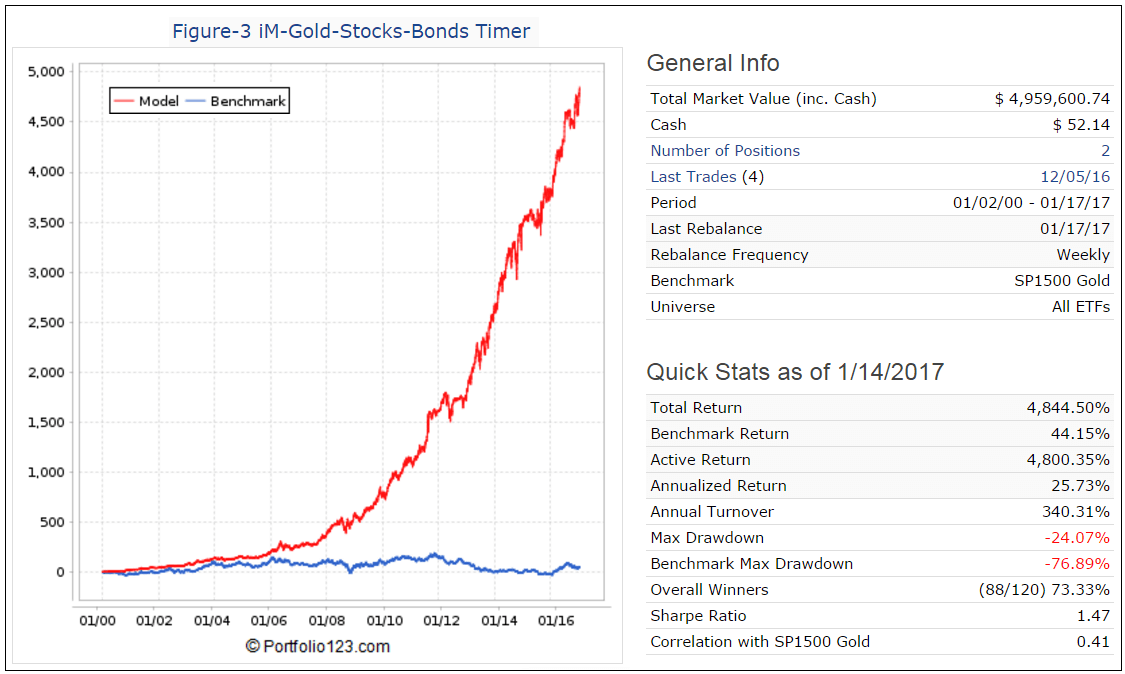
Figure-3: Gold, stocks, and bonds (iM-Gold-Stocks-Bonds Timer).
Note the approximately 1.5-times leverage when the model simultaneously holds RSP and SSO.
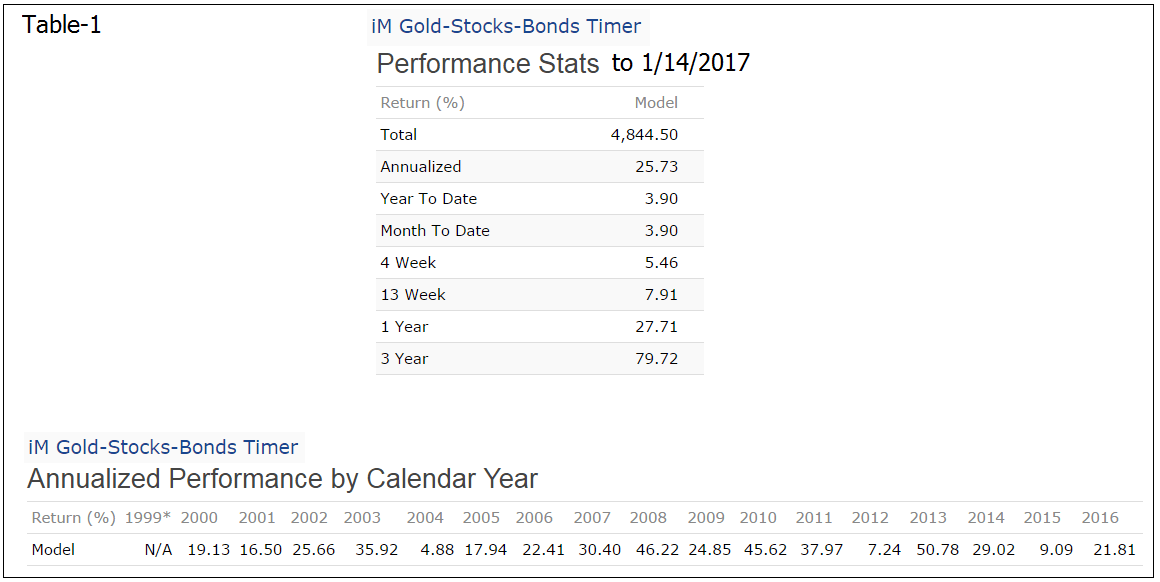
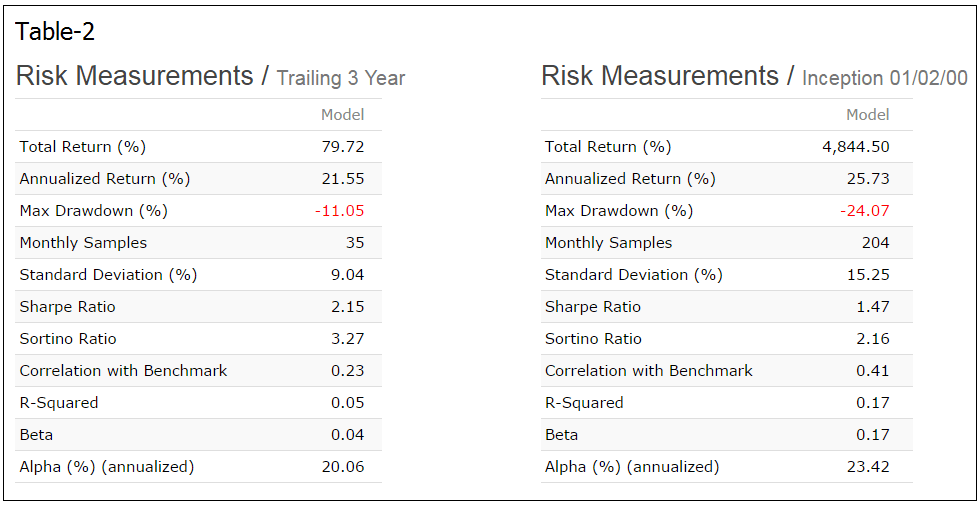
For the 17 year backtest period the simulated annualized return increases from 13.26% for the iM-Gold Timer to 25.73% for the iM-Gold-Stocks-Bonds Timer. Maximum drawdown occurred when the model was in gold, and remains the same -24% for all three versions.
Risk
Trading Statistics
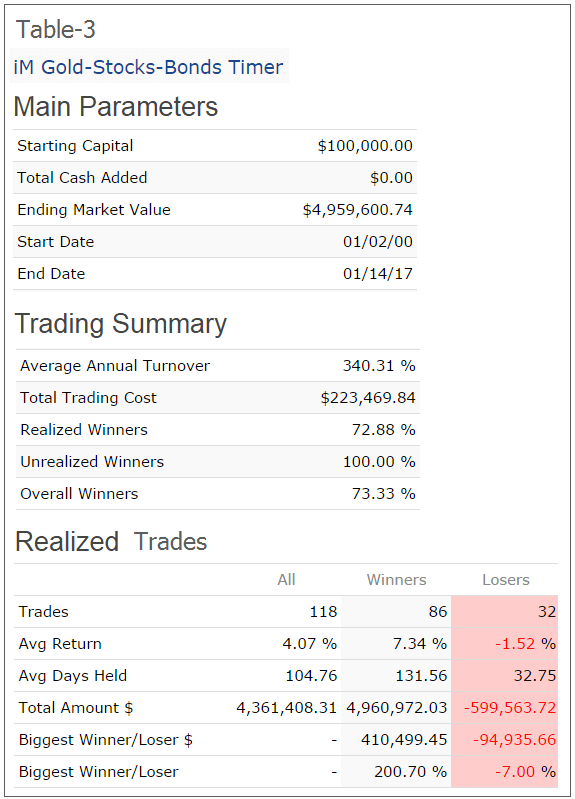
Following the model
On iMarketSignals (Gold membership required) we will track this model, with weekly trading signals normally provided on Sundays.
Disclaimer
Note: All performance results are hypothetical and the result of backtesting over the period 2000 to 2017. Out-of-sample performance may be different. No claim is made about future performance.
Appendix
List of historic trades
|
Symbol |
Open |
Close |
Days |
Pct. Return |
|
|
1 |
LQD |
01/03/2000 |
01/24/2000 |
21 |
-1.00% |
|
2 |
VWOB |
01/03/2000 |
01/18/2000 |
15 |
-1.30% |
|
3 |
XLU |
01/18/2000 |
01/31/2000 |
13 |
2.70% |
|
4 |
VWOB |
01/24/2000 |
02/07/2000 |
14 |
1.10% |
|
5 |
LQD |
01/31/2000 |
02/14/2000 |
14 |
0.20% |
|
6 |
RSP |
02/07/2000 |
06/19/2000 |
133 |
7.50% |
|
7 |
VWOB |
02/14/2000 |
02/28/2000 |
14 |
0.70% |
|
8 |
LQD |
02/28/2000 |
03/13/2000 |
14 |
-0.30% |
|
9 |
VWOB |
03/13/2000 |
03/27/2000 |
14 |
1.10% |
|
10 |
LQD |
03/27/2000 |
04/10/2000 |
14 |
1.10% |
|
11 |
VWOB |
04/10/2000 |
04/24/2000 |
14 |
-2.00% |
|
12 |
LQD |
04/24/2000 |
10/16/2000 |
175 |
3.40% |
|
13 |
VWOB |
06/19/2000 |
10/09/2000 |
112 |
5.40% |
|
14 |
SSO |
10/09/2000 |
11/06/2000 |
28 |
3.10% |
|
15 |
RSP |
10/16/2000 |
11/06/2000 |
21 |
6.50% |
|
16 |
LQD |
11/06/2000 |
04/02/2001 |
147 |
7.50% |
|
17 |
VWOB |
11/06/2000 |
04/02/2001 |
147 |
6.90% |
|
18 |
IAU |
04/02/2001 |
05/29/2001 |
57 |
7.50% |
|
19 |
GLD |
04/02/2001 |
05/29/2001 |
57 |
7.50% |
|
20 |
LQD |
05/29/2001 |
09/10/2001 |
104 |
4.80% |
|
21 |
VWOB |
05/29/2001 |
09/10/2001 |
104 |
1.30% |
|
22 |
IAU |
09/10/2001 |
03/17/2003 |
553 |
25.60% |
|
23 |
GLD |
09/10/2001 |
03/17/2003 |
553 |
25.30% |
|
24 |
LQD |
03/17/2003 |
03/31/2003 |
14 |
0.90% |
|
25 |
VWOB |
03/17/2003 |
03/31/2003 |
14 |
0.50% |
|
26 |
SSO |
03/31/2003 |
04/21/2003 |
21 |
10.20% |
|
27 |
RSP |
03/31/2003 |
04/21/2003 |
21 |
6.20% |
|
28 |
IAU |
04/21/2003 |
03/17/2008 |
1792 |
200.70% |
|
29 |
GLD |
04/21/2003 |
03/17/2008 |
1792 |
198.70% |
|
30 |
VWOB |
03/17/2008 |
05/05/2008 |
49 |
1.90% |
|
31 |
LQD |
03/17/2008 |
05/05/2008 |
49 |
1.60% |
|
32 |
GLD |
05/05/2008 |
09/29/2008 |
147 |
3.70% |
|
33 |
IAU |
05/05/2008 |
09/29/2008 |
147 |
3.50% |
|
34 |
LQD |
09/29/2008 |
03/30/2009 |
182 |
13.90% |
|
35 |
VWOB |
09/29/2008 |
03/23/2009 |
175 |
-3.80% |
|
36 |
XLU |
03/23/2009 |
04/06/2009 |
14 |
-1.70% |
|
37 |
VWOB |
03/30/2009 |
04/13/2009 |
14 |
6.60% |
|
38 |
LQD |
04/06/2009 |
04/20/2009 |
14 |
3.20% |
|
39 |
RSP |
04/13/2009 |
06/01/2009 |
49 |
15.90% |
|
40 |
VWOB |
04/20/2009 |
05/04/2009 |
14 |
2.40% |
|
41 |
LQD |
05/04/2009 |
05/18/2009 |
14 |
0.70% |
|
42 |
VWOB |
05/18/2009 |
06/08/2009 |
21 |
1.20% |
|
43 |
LQD |
06/01/2009 |
06/15/2009 |
14 |
1.50% |
|
44 |
GLD |
06/08/2009 |
02/01/2010 |
238 |
15.60% |
|
45 |
IAU |
06/15/2009 |
02/01/2010 |
231 |
18.60% |
|
46 |
SSO |
02/01/2010 |
04/05/2010 |
63 |
18.40% |
|
47 |
RSP |
02/01/2010 |
04/05/2010 |
63 |
11.60% |
|
48 |
IAU |
04/05/2010 |
08/08/2011 |
490 |
50.60% |
|
49 |
GLD |
04/05/2010 |
08/08/2011 |
490 |
50.40% |
|
50 |
SSO |
08/08/2011 |
08/29/2011 |
21 |
15.10% |
|
51 |
RSP |
08/08/2011 |
08/29/2011 |
21 |
9.20% |
|
52 |
LQD |
08/29/2011 |
01/30/2012 |
154 |
3.80% |
|
53 |
VWOB |
08/29/2011 |
01/30/2012 |
154 |
1.70% |
|
54 |
SSO |
01/30/2012 |
07/02/2012 |
154 |
8.00% |
|
55 |
XLU |
01/30/2012 |
02/13/2012 |
14 |
0.50% |
|
56 |
LQD |
02/13/2012 |
02/27/2012 |
14 |
0.50% |
|
57 |
XLU |
02/27/2012 |
03/12/2012 |
14 |
1.20% |
|
58 |
LQD |
03/12/2012 |
03/26/2012 |
14 |
-1.30% |
|
59 |
RSP |
03/26/2012 |
07/02/2012 |
98 |
-5.30% |
|
60 |
VWOB |
07/02/2012 |
09/04/2012 |
64 |
4.40% |
|
61 |
LQD |
07/02/2012 |
08/27/2012 |
56 |
1.70% |
|
62 |
XLU |
08/27/2012 |
09/10/2012 |
14 |
-0.50% |
|
63 |
LQD |
09/04/2012 |
09/17/2012 |
13 |
-0.20% |
|
64 |
VWOB |
09/10/2012 |
09/24/2012 |
14 |
-0.10% |
|
65 |
XLU |
09/17/2012 |
10/01/2012 |
14 |
-0.40% |
|
66 |
LQD |
09/24/2012 |
10/08/2012 |
14 |
0.50% |
|
67 |
VWOB |
10/01/2012 |
10/15/2012 |
14 |
1.40% |
|
68 |
XLU |
10/08/2012 |
10/22/2012 |
14 |
0.40% |
|
69 |
LQD |
10/15/2012 |
10/31/2012 |
16 |
-0.30% |
|
70 |
VWOB |
10/22/2012 |
11/05/2012 |
14 |
-0.90% |
|
71 |
XLU |
10/31/2012 |
11/12/2012 |
12 |
-7.00% |
|
72 |
LQD |
11/05/2012 |
11/19/2012 |
14 |
-0.40% |
|
73 |
SSO |
11/12/2012 |
04/01/2013 |
140 |
28.70% |
|
74 |
VWOB |
11/19/2012 |
12/03/2012 |
14 |
1.10% |
|
75 |
LQD |
12/03/2012 |
12/17/2012 |
14 |
-1.10% |
|
76 |
VWOB |
12/17/2012 |
12/31/2012 |
14 |
0.60% |
|
77 |
RSP |
12/31/2012 |
04/01/2013 |
91 |
11.00% |
|
78 |
VWOB |
04/01/2013 |
04/15/2013 |
14 |
2.60% |
|
79 |
LQD |
04/01/2013 |
04/22/2013 |
21 |
1.80% |
|
80 |
XLU |
04/15/2013 |
04/29/2013 |
14 |
3.70% |
|
81 |
SSO |
04/22/2013 |
01/06/2014 |
259 |
37.60% |
|
82 |
VWOB |
04/29/2013 |
05/13/2013 |
14 |
-0.90% |
|
83 |
XLU |
05/13/2013 |
05/28/2013 |
15 |
-3.30% |
|
84 |
RSP |
05/28/2013 |
01/06/2014 |
223 |
10.90% |
|
85 |
IAU |
01/06/2014 |
03/03/2014 |
56 |
9.00% |
|
86 |
GLD |
01/06/2014 |
03/03/2014 |
56 |
8.80% |
|
87 |
RSP |
03/03/2014 |
12/22/2014 |
294 |
11.20% |
|
88 |
XLU |
03/03/2014 |
03/17/2014 |
14 |
2.60% |
|
89 |
SSO |
03/17/2014 |
12/22/2014 |
280 |
25.80% |
|
90 |
VWOB |
12/22/2014 |
05/11/2015 |
140 |
1.80% |
|
91 |
LQD |
12/22/2014 |
05/04/2015 |
133 |
-1.20% |
|
92 |
RSP |
05/04/2015 |
06/08/2015 |
35 |
-2.00% |
|
93 |
LQD |
05/11/2015 |
05/26/2015 |
15 |
0.30% |
|
94 |
VWOB |
05/26/2015 |
07/06/2015 |
41 |
-2.60% |
|
95 |
LQD |
06/08/2015 |
07/06/2015 |
28 |
-0.10% |
|
96 |
SSO |
07/06/2015 |
07/27/2015 |
21 |
-0.30% |
|
97 |
RSP |
07/06/2015 |
07/27/2015 |
21 |
-1.50% |
|
98 |
XLU |
07/27/2015 |
08/24/2015 |
28 |
0.90% |
|
99 |
VWOB |
07/27/2015 |
08/24/2015 |
28 |
-2.60% |
|
100 |
SSO |
08/24/2015 |
09/08/2015 |
15 |
7.90% |
|
101 |
RSP |
08/24/2015 |
09/08/2015 |
15 |
3.70% |
|
102 |
XLU |
09/08/2015 |
11/16/2015 |
69 |
3.20% |
|
103 |
VWOB |
09/08/2015 |
11/09/2015 |
62 |
0.00% |
|
104 |
LQD |
11/09/2015 |
11/23/2015 |
14 |
0.80% |
|
105 |
SSO |
11/16/2015 |
12/07/2015 |
21 |
2.30% |
|
106 |
VWOB |
11/23/2015 |
06/27/2016 |
217 |
3.20% |
|
107 |
XLU |
12/07/2015 |
06/27/2016 |
203 |
19.40% |
|
108 |
RSP |
06/27/2016 |
07/18/2016 |
21 |
9.20% |
|
109 |
LQD |
06/27/2016 |
07/25/2016 |
28 |
1.10% |
|
110 |
VWOB |
07/18/2016 |
08/01/2016 |
14 |
-0.70% |
|
111 |
RSP |
07/25/2016 |
09/06/2016 |
43 |
0.80% |
|
112 |
LQD |
08/01/2016 |
08/15/2016 |
14 |
0.10% |
|
113 |
VWOB |
08/15/2016 |
08/29/2016 |
14 |
-0.10% |
|
114 |
SSO |
08/29/2016 |
09/19/2016 |
21 |
-3.90% |
|
115 |
VWOB |
09/06/2016 |
11/07/2016 |
62 |
-2.00% |
|
116 |
LQD |
09/19/2016 |
11/07/2016 |
49 |
-1.00% |
|
117 |
SSO |
11/07/2016 |
12/05/2016 |
28 |
7.20% |
|
118 |
RSP |
11/07/2016 |
12/05/2016 |
28 |
5.20% |
Anton, Another great piece of work that expands my ideas of diversification and timing. What would a 33.3% split of combo6, combo2, and gold stocks and bonds look like?
That is difficult to simulate as one cannot make combos with combos. Shortly we will publish a combo combining the three composite timer models.
The iM 3-model Composite Timer Combo combines
• the iM-Composite Timer (SPY-IEF),
• the iM-Composite (Gold-Stocks-Bond) Timer and
• the iM-Composite (SH-RSP) Timer,
and always holds 4 ETFs.
I am very interested in this combo. Any idea when? Also, will it have several choices in each class of investment, or allow duplicates, so that it can be concentrated if that is the best solution?
Anton/Georg
Like it! Quick question:
GLD and IAU seem to be almost identical investments in their performance. Is there really any benefit to holding both?? I may use a 2x gold ETF to replace IAU. Good luck……
Vman
There is no benefit to hold both GLD and IAU. We had to specify two gold ETFs because the model always holds two positions. Had we only specified one of them then it would only be allocated half of the available funds.
25.73% annually. holy moly!
How many shares of each ETF are traded in your model?
Henry
The number of shares of each ETF increases as the portfolio value increases.
I’m thinking of using this with just Gold/Stocks since it is difficult to implement the Bonds portion in Canada (difficult to replicate the Bonds closely with CAD ETFs). The Ann. Returns of Gold/Stocks is still very good. Do you see any major problems with doing this?
Brent
No problem with going to cash instead of bonds. Annualized Return is only about 2% lower.
What happens to your Sharpe and DD if you use only SSO instead of SSO and RSP?
Thanks.
Tom C
The model needs 2 different ETFs. If only SSO is specified then model allocates 50% of the money to SSO and the other 50% to cash.
However using GLD, SSO and BIV with 100% allocation to each then simulated return improves to 28.4%.
Number of Positions 1
Last Trades (2) 02/21/17
Period 01/02/00 – 03/27/17
Last Rebalance 03/27/17
Rebalance Frequency Weekly
Benchmark SPDR S&P 500 ETF Trust
Universe All ETFs
Quick Stats as of 3/25/2017
Total Return 7,393.98%
Benchmark Return 119.79%
Active Return 7,274.19%
Annualized Return 28.48%
Annual Turnover 248.13%
Max Drawdown -23.96%
Benchmark Max Drawdown -55.19%
Overall Winners (36/46) 78.26%
Sharpe Ratio 1.43
Correlation with SPDR S&P 500 ETF Trust 0.23
Hi Georg
Could you please backtest this single holding version (50%), and combine it with the QQQ strategy (25%), and the country rotation strategy (25%), going back as far as possible.
I think that is 3/jan/08 based on the max backtest for the country rotation strategy
I’d also be interested in a full backtest of 50% QQQ and 50% this single holding version going back as far as possible (im interest to see the usual stats but in particular the drawdown)
Thanks for your help as always
James
iM Gold-Stocks-Bonds GLD-SSO-BIV 50.00%
iM-Country Rotation System 25.00%
iM-Top5(QQQ)Select 25.00%
Period 03/09/09 – 05/01/25
Benchmark S&P 500 (SPY:USA)
Quick Stats as of 5/1/2025
Total Return……. 4,554.19%
Benchmark Return… 1,008.55%
Annualized Return.. 26.83%
Max Drawdown…. -25.00%
Benchmark Max Drawdown..-33.72%
Sharpe Ratio…. 1.61
Hi Georg
Could you please provide the calendar year returns and the drawdowns for each year (up to YTD 2026), going back as far as possible for this strategy:
iM Gold-Stocks-Bonds GLD-SSO-BIV 50.00%
iM-Country Rotation System 25.00%
iM-Top5(QQQ)Select 25.00%
Thanks
James
iM Gold-Stocks-Bonds GLD-SSO-BIV…50.00%
iM-Top5(QQQ)Select – from 2000 …50.00%
Period 12/31/99 – 05/01/25
Sizing Method Static Weight
Benchmark S&P 500 (SPY:USA)
Quick Stats as of 5/1/2025
Total Return…. 19,667.19%
Benchmark Return….. 498.42%
Annualized Return…. 23.19%
Max Drawdown…. -29.22%
Benchmark Max Drawdown. -55.19%
Sharpe Ratio…. 1.26
Thanks Georg
Is it possible to get this GLD-SSO-BIV model 50/50 QQQ version, over the same time period as the one aboe including the country rotation strategy. Ie. Period 03/09/09 – 05/01/25, so i can compare the two versions (with and without the country rotation strategy included)
Thanks again
Also curious about the last question, what happens to your Sharpe, DD, AR if you use only SSO instead of SSO and RSP?
Also – do you still plan to do this, and if so, do you know when:
That is difficult to simulate as one cannot make combos with combos. Shortly we will publish a combo combining the three composite timer models.
The iM 3-model Composite Timer Combo combines
• the iM-Composite Timer (SPY-IEF),
• the iM-Composite (Gold-Stocks-Bond) Timer and
• the iM-Composite (SH-RSP) Timer,
and always holds 4 ETFs.
This combo produces an annualized return of about 24% with a max D/D of -15%.
Number of Assets 3
Last Trades (2) 01/11/16
Period 12/31/00 – 03/24/17
Last Rebalance 03/20/17
Rebalance Frequency Weekly
Benchmark SPDR S&P 500 ETF Trust
Quick Stats as of 3/24/2017
Total Return 3,155.32%
Benchmark Return 147.99%
Active Return 3,007.33%
Annualized Return 23.94%
Max Drawdown -15.00%
Benchmark Max Drawdown -55.19%
Sharpe Ratio 2.08
Correlation with SPDR S&P 500 ETF Trust 0.32
Georg, would be interesting to see what (GLD&SCHP+VTV&VOE+BIV&LQD)would look like. Maybe DD would be less?
Please look at:
The iM-Low Turnover Composite Timer Combo
https://imarketsignals.com/2017/im-low-turnover-composite-timer-combo/
max D/D = -11.2%
Hi Georg and Anton
I’m anxious to see the ‘3-model Composite Market Timer Combo’ strategy you referenced above on February 24.
When do you think you will roll it out?? Great potential with these 3 Comp Timer strategies.
Many thanks,
Vman
Georg,
I would like this data as well. I know you published the results using the version of the iM-Composite Mkt Timer (GLD&SCHP+VTV&VOE+BIV&LQD)that has the 6 week hold period, but would it be possible to see the results using the original iM-Composite (Gold-Stock-Bond)Timer with iM-Composite Timer (SPY-IEF), and iM-Composite-(SH-RSP)combined into a book with 1/3 allocation to each?
Thnx
iM-Composite(SH-RSP) Timer with Standard & Composite Timer rules 33.33%
iM-Composite(Gold-Stocks-Bonds) Timer33.33%
iM-Composite(SPY-IEF) Timer Stocks/Bonds 33.33%
Live since 1/23/17
Period 01/23/17 – 04/28/17
Benchmark SPDR S&P 500 ETF Trust
Quick Stats as of 4/28/2017
Total Return 7.57%
Benchmark Return 5.73%
Active Return 1.84%
Max Drawdown -2.37%
Benchmark Max Drawdown -2.61%
Overall Winners (11/11) 100.00%
Simulation from 12/31/1999
Period 12/31/99 – 04/28/17
Benchmark SPDR S&P 500 ETF Trust
Quick Stats as of 4/28/2017
Total Return 3,390.63%
Benchmark Return 123.75%
Active Return 3,266.88%
Annualized Return 22.76%
Max Drawdown -14.75%
Benchmark Max Drawdown -55.19%
Sharpe Ratio 2.00
Correlation with SPDR S&P 500 ETF Trust 0.36
Georg,
Could you run this again using SSO instead of RSP and SPY? I’m trying to compare this model with the iM-5ETF Trader. One of the major differences is obviously the use of leverage,another being the ranking system, and the last possibly frequency of trading. Anything you can add that would help compare/contrast the Combo2 model (RSP-SH+RSP-IEF)+ Composite Timer Gold Stock Bonds, with iM-5ETF Trader would be greatly appreciated.
The iM Composite Timer Gold-Stocks-Bonds uses SSO and RSP for investment in stocks. I does not use SPY.
We will check if one can run it with SSO and UWM for more leverage.
Georg,
Can you tell me roughly how much of the outperformance of iM5-ETF Trader vs.
Combo2 +Composite Timer Gold Stock Bond ( no 6 week hold) is due to the ranking system and how much is due to leverage long and short?
Thnx
could you please state what year the “max DD ” occurred? Also if possible what was the second highest DD and in what year?
thanks
From the simulation:
Sep-11-2008: max D/D= -24%
Jun-23-2006: D/D= -21%
On what date was the max drawdown for GLD-IAU?
thanks
Tom C
Sorry about that, I just saw the answer above.
Tom C
What would the result be if the model indicates bonds, and you just used EDV and TLT regardless of MC-score? I assume there would still be positive expectancy by using these?
Tom C
can you post monthly returns going back to 12/31/2007
iM-Gold-Stocks-Bonds Timer
Performance by Month
Start Date …. Model …. SPY …. Excess Return
01/02/2008 …. 0.068 …. -0.052 …. 11.973
02/01/2008 …. 0.053 …. -0.026 …. 7.849
03/03/2008 …. 0.038 …. -0.009 …. 4.700
04/01/2008 …. 0.012 …. 0.048 …. -3.553
05/01/2008 …. 0.015 …. 0.015 …. 0.031
06/02/2008 …. 0.044 …. -0.084 …. 12.753
07/01/2008 …. -0.013 …. -0.009 …. -0.428
08/01/2008 …. -0.091 …. 0.015 …. -10.687
09/02/2008 …. 0.144 …. -0.094 …. 23.866
10/01/2008 …. -0.102 …. -0.165 …. 6.276
11/03/2008 …. 0.060 …. -0.070 …. 12.966
12/01/2008 …. 0.154 …. 0.010 …. 14.450
01/02/2009 …. -0.041 …. -0.082 …. 4.107
02/02/2009 …. -0.053 …. -0.107 …. 5.440
03/02/2009 …. 0.025 …. 0.083 …. -5.855
04/01/2009 …. 0.013 …. 0.099 …. -8.643
05/01/2009 …. 0.047 …. 0.058 …. -1.118
06/01/2009 …. -0.020 …. -0.001 …. -1.910
07/01/2009 …. 0.024 …. 0.075 …. -5.038
08/03/2009 …. 0.000 …. 0.037 …. -3.694
09/01/2009 …. 0.058 …. 0.035 …. 2.303
10/01/2009 …. 0.038 …. -0.019 …. 5.674
11/02/2009 …. 0.128 …. 0.062 …. 6.596
12/01/2009 …. -0.072 …. 0.019 …. -9.127
01/04/2010 …. -0.013 …. -0.036 …. 2.377
02/01/2010 …. 0.048 …. 0.031 …. 1.687
03/01/2010 …. 0.098 …. 0.061 …. 3.711
04/01/2010 …. 0.065 …. 0.015 …. 4.940
05/03/2010 …. 0.030 …. -0.079 …. 10.975
06/01/2010 …. 0.024 …. -0.052 …. 7.530
07/01/2010 …. -0.050 …. 0.068 …. -11.877
08/02/2010 …. 0.057 …. -0.045 …. 10.202
09/01/2010 …. 0.048 …. 0.090 …. -4.198
10/01/2010 …. 0.037 …. 0.038 …. -0.106
11/01/2010 …. 0.021 …. 0.000 …. 2.106
12/01/2010 …. 0.025 …. 0.067 …. -4.212
01/03/2011 …. -0.064 …. 0.023 …. -8.718
02/01/2011 …. 0.060 …. 0.035 …. 2.520
03/01/2011 …. 0.016 …. 0.000 …. 1.619
04/01/2011 …. 0.089 …. 0.029 …. 6.029
05/02/2011 …. -0.018 …. -0.011 …. -0.690
06/01/2011 …. -0.024 …. -0.017 …. -0.695
07/01/2011 …. 0.084 …. -0.020 …. 10.405
08/01/2011 …. 0.188 …. -0.055 …. 24.269
09/01/2011 …. -0.022 …. -0.069 …. 4.741
10/03/2011 …. 0.038 …. 0.109 …. -7.119
11/01/2011 …. -0.022 …. -0.004 …. -1.800
12/01/2011 …. 0.027 …. 0.010 …. 1.644
01/03/2012 …. 0.012 …. 0.046 …. -3.435
02/01/2012 …. 0.042 …. 0.043 …. -0.150
03/01/2012 …. 0.032 …. 0.032 …. 0.026
04/02/2012 …. -0.012 …. -0.007 …. -0.543
05/01/2012 …. -0.093 …. -0.060 …. -3.309
06/01/2012 …. 0.056 …. 0.041 …. 1.558
07/02/2012 …. 0.033 …. 0.012 …. 2.083
08/01/2012 …. -0.003 …. 0.025 …. -2.804
09/04/2012 …. 0.010 …. 0.025 …. -1.558
10/01/2012 …. 0.001 …. -0.018 …. 1.913
11/01/2012 …. -0.007 …. 0.006 …. -1.236
12/03/2012 …. 0.006 …. 0.009 …. -0.243
01/02/2013 …. 0.084 …. 0.051 …. 3.264
02/01/2013 …. 0.016 …. 0.013 …. 0.295
03/01/2013 …. 0.059 …. 0.038 …. 2.106
04/01/2013 …. 0.058 …. 0.019 …. 3.903
05/01/2013 …. -0.007 …. 0.024 …. -3.107
06/03/2013 …. -0.022 …. -0.013 …. -0.896
07/01/2013 …. 0.081 …. 0.052 …. 2.949
08/01/2013 …. -0.046 …. -0.030 …. -1.599
09/03/2013 …. 0.054 …. 0.032 …. 2.186
10/01/2013 …. 0.068 …. 0.046 …. 2.177
11/01/2013 …. 0.041 …. 0.030 …. 1.175
12/02/2013 …. 0.041 …. 0.026 …. 1.511
01/02/2014 …. -0.017 …. -0.035 …. 1.856
02/03/2014 …. 0.064 …. 0.046 …. 1.814
03/03/2014 …. 0.047 …. 0.008 …. 3.877
04/01/2014 …. 0.008 …. 0.007 …. 0.119
05/01/2014 …. 0.033 …. 0.023 …. 0.977
06/02/2014 …. 0.035 …. 0.021 …. 1.426
07/01/2014 …. -0.026 …. -0.013 …. -1.261
08/01/2014 …. 0.061 …. 0.039 …. 2.130
09/02/2014 …. -0.028 …. -0.014 …. -1.374
10/01/2014 …. 0.037 …. 0.024 …. 1.357
11/03/2014 …. 0.042 …. 0.027 …. 1.413
12/01/2014 …. 0.007 …. -0.003 …. 0.974
01/02/2015 …. 0.022 …. -0.030 …. 5.121
02/02/2015 …. 0.000 …. 0.056 …. -5.611
03/02/2015 …. 0.004 …. -0.016 …. 1.926
04/01/2015 …. 0.003 …. 0.010 …. -0.698
05/01/2015 …. -0.011 …. 0.013 …. -2.380
06/01/2015 …. -0.015 …. -0.020 …. 0.512
07/01/2015 …. 0.009 …. 0.023 …. -1.378
08/03/2015 …. 0.038 …. -0.061 …. 9.855
09/01/2015 …. 0.012 …. -0.026 …. 3.751
10/01/2015 …. 0.019 …. 0.085 …. -6.624
11/02/2015 …. 0.008 …. 0.004 …. 0.397
12/01/2015 …. 0.002 …. -0.017 …. 1.897
01/04/2016 …. 0.024 …. -0.050 …. 7.384
02/01/2016 …. 0.019 …. -0.001 …. 1.994
03/01/2016 …. 0.057 …. 0.067 …. -1.051
04/01/2016 …. -0.005 …. 0.004 …. -0.916
05/02/2016 …. 0.006 …. 0.017 …. -1.077
06/01/2016 …. 0.065 …. 0.003 …. 6.133
07/01/2016 …. 0.021 …. 0.036 …. -1.538
08/01/2016 …. -0.005 …. 0.001 …. -0.656
09/01/2016 …. -0.008 …. 0.000 …. -0.804
10/03/2016 …. -0.014 …. -0.017 …. 0.285
11/01/2016 …. 0.059 …. 0.037 …. 2.189
12/01/2016 …. -0.013 …. 0.020 …. -3.371
01/03/2017 …. 0.054 …. 0.018 …. 3.582
02/01/2017 …. 0.077 …. 0.039 …. 3.819
03/01/2017 …. -0.003 …. 0.001 …. -0.464
04/03/2017 …. 0.049 …. 0.010 …. 3.878
05/01/2017 …. 0.018 …. 0.014 …. 0.373
06/01/2017 …. -0.021 …. 0.006 …. -2.781
07/03/2017 …. 0.023 …. 0.021 …. 0.274
08/01/2017 …. 0.041 …. 0.003 …. 3.853
09/01/2017 …. -0.033 …. 0.020 …. -5.311
10/02/2017 …. -0.008 …. 0.024 …. -3.137
11/01/2017 …. 0.003 …. 0.031 …. -2.715
12/01/2017 …. 0.021 …. 0.012 …. 0.901
01/02/2018 …. 0.035 …. 0.062 …. -2.695
Is this system using the timer described here?
https://imarketsignals.com/2017/im-gold-timer-rev1/
If so, why did this change on 12/17 whereas the signals page says the Gold Timer changed on 12/31?
Tom C
???
Would you please post annual returns for the years 2016, 2017 & 2018.
Also I think it would be of value to have a spreadsheet showing annual returns for all the various systems just as a general comparison or “Master list of returns”.
Return (%) … 2016 … 2017 … 2018 … 2019
Model … 21.81 … 23.9 … -14.78 … 14.11
Benchmark … 12 … 21.71 … -4.57 … 18.17
Excess … 9.81 … 2.2 … -10.21 … -4.05
Hi Georg and Anton Can you updated the sharpe ratio and std dev From inception for this model ? Thanks
This questions is unrelated to this model, but “The modified Coppock Silver indicator” does not have a thread and I was hoping you could give me an update on the backtest performance for this model, from 2013 to present? Thank-you in advance.
We will extract the buy sell signals and the then prevailing silver price from our Excel model and forward them to you when done.
oh thank you very much! Love your work, been with you for years!