
- The system screens for S&P 500 stocks which yield significantly more than the average yield of the index and which also have a low 3-yr beta (low volatility).
- It is shown that holding continuously all the screen-selected high-yielding, low-volatility stocks of the S&P500 would have provided an average annualized return of about 14% from Jan-2000 to Jun-2016.
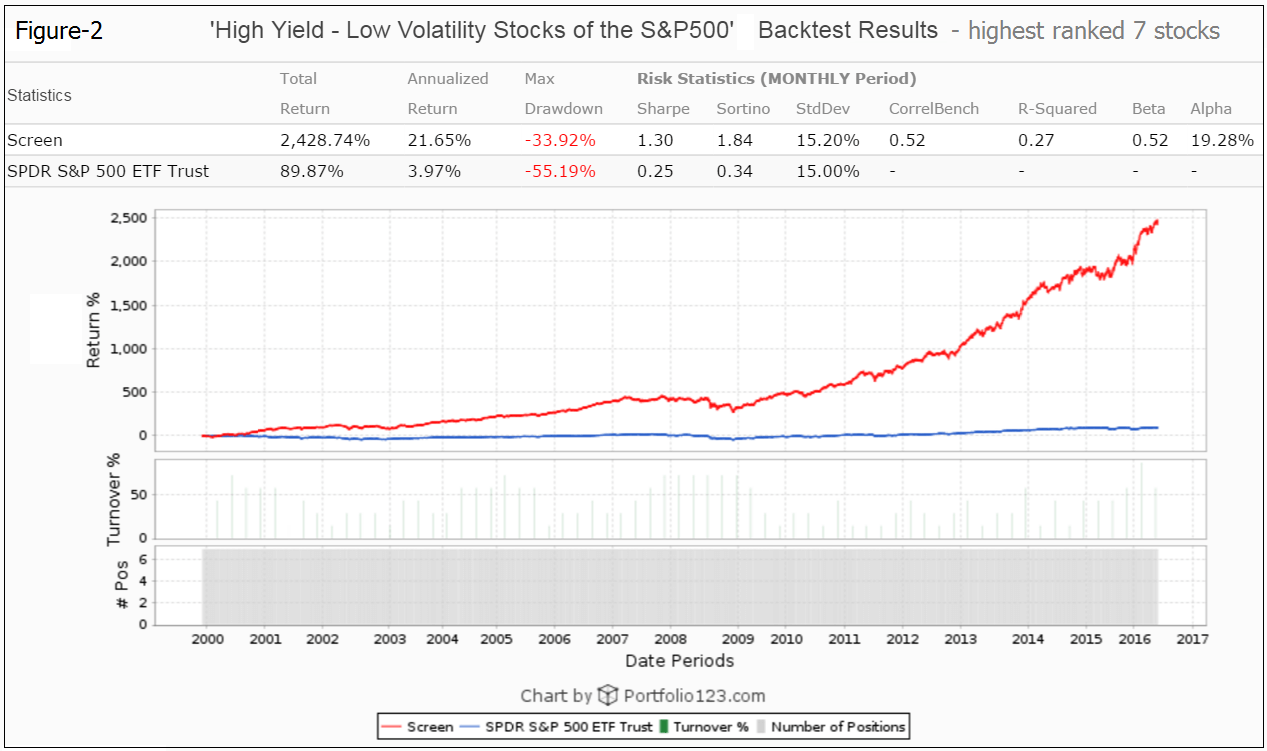
- Holding only the highest ranked seven stocks of this group and periodically rebalancing would have produced a higher annualized return of about 22% with a maximum drawdown of -34%.
- The iM HiD-LoV-7 System, consisting of the seven highest ranked High Dividend – Low Volatility stocks, achieved much higher returns with less risk than the S&P500 Low Volatility High Dividend Index
Historic Performance of the S&P500 HiD-LoV Stock Universe
The model was backtested using the on-line portfolio simulation platform Portfolio 123.
The number of high-yield, low-volatility stocks in the S&P500 (selected point-in-time) varied from a minimum of 9 to a maximum of 69 over the backtest period Jan-2000 to Jun-2016, all as shown in the #Pos bar-chart of Figure 1.
Figure 1 shows the performance of an equal weighted investment in all the high-yield, low-volatility stocks of the S&P500 from beginning of January 2000 to June 2016, when rebalanced to equal weight every three months. The annualized return would have been 14.1% with a maximum drawdown of -35.5%. This is considerably better than the 3.97% return of SPY (the ETF tracking the S&P500 adjusted for dividends) which had a maximum drawdown of -55.2%.
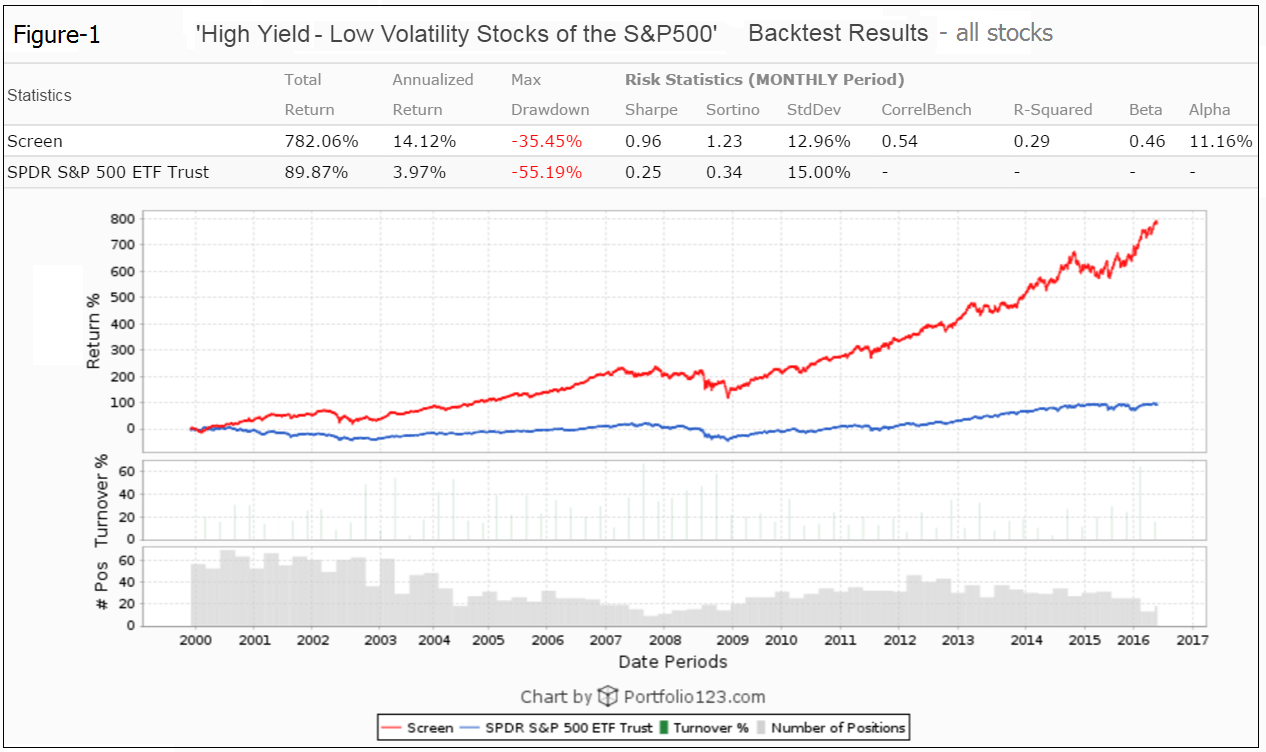
Thus continuously only holding this group of stocks would have been a good investment. Currently (6/26/2016) there are only 19 stocks in this group, as listed below.
|
Ticker |
Name |
Rank |
MCap |
Yield % |
IndCode |
|
|
1 |
(VZ) |
Verizon Communications Inc |
89 |
221.9B |
4.15 |
TELECOMDIV |
|
2 |
(CME) |
CME Group Inc |
87.6 |
32.7B |
5.47 |
FINDIVSVCE |
|
3 |
(IBM) |
International Business Machines Corp |
82.6 |
140.7B |
3.82 |
TECHSVCE |
|
4 |
(PM) |
Philip Morris International Inc |
68.8 |
151.6B |
4.18 |
TOBACCO |
|
5 |
(O) |
Realty Income Corp. |
53.6 |
16.5B |
3.64 |
REIT |
|
6 |
(PEG) |
Public Service Enterprise Group Inc |
50 |
22.3B |
3.72 |
UTILMULTI |
|
7 |
(FE) |
FirstEnergy Corp. |
30.4 |
14.0B |
4.38 |
UTILELECTRIC |
|
8 |
(PPL) |
PPL Corp |
28.8 |
25.1B |
4.09 |
UTILELECTRIC |
|
9 |
(EXC) |
Exelon Corp |
25.4 |
31.7B |
3.70 |
UTILELECTRIC |
|
10 |
(T) |
AT&T Inc |
5 |
255.6B |
4.62 |
TELECOMDIV |
|
11 |
(SO) |
Southern Co (The) |
24.6 |
47.0B |
4.38 |
UTILELECTRIC |
|
12 |
(DUK) |
Duke Energy Corp |
21.2 |
56.8B |
4.00 |
UTILELECTRIC |
|
13 |
(ETR) |
Entergy Corp. |
19 |
13.9B |
4.36 |
UTILELECTRIC |
|
14 |
(D) |
Dominion Resources Inc. |
16.8 |
44.3B |
3.78 |
UTILMULTI |
|
15 |
(CCI) |
Crown Castle International Corp |
14 |
32.6B |
3.67 |
REIT |
|
16 |
(HCN) |
Welltower Inc |
9.2 |
25.9B |
4.75 |
REIT |
|
17 |
(EXR) |
Extra Space Storage Inc |
8.8 |
10.9B |
3.59 |
REIT |
|
18 |
(VTR) |
Ventas Inc. |
8 |
23.5B |
4.19 |
REIT |
|
19 |
(HCP) |
HCP Inc |
5.2 |
16.0B |
6.72 |
REIT |
Historic Performance of the 7 highest ranked S&P500 HiD-LoV Stocks
A two-factor ranking system is used to periodically select the seven highest ranked high-yield, low-volatility stocks. There is no market timing in the backtest rules or in the ranking system.
Figure 2 shows the performance of an equal weighted investment in seven HiD-LoV stocks from January 2000 to June 2016, when rebalanced to equal weight every three months. The annualized return would have been 21.7% with a maximum drawdown of -33.9%.
The iM HiD-LoV-7 System
The model holds seven positions, approximately equal weight, for a minimum period of about 3 months.
Stocks are bought and sold at the next day’s closing price after a signal is generated. Variable slippage of about 0.12% of a trade amount was applied to provide for transaction slippage and brokerage fees.
The two main buy rules specify the minimum yield and maximum three-year beta.
(A beta of 1 signifies a close link with the S&P 500 index; a beta of 0.1 suggests almost no connection.)
There is only one sell rule to ensure a minimum holding period of about 3 months.
There is no market timing in the model’s algorithm.
Performance Results
In the below figures the red graph represents the model and the blue graph shows the performance of benchmark SPY.
Figure-3: Simulated Performance 2000-2016: Annualized Return= 21.6%, Max DD= -32.3%. The backtest period was from Jan-2000 to Jun-2016.
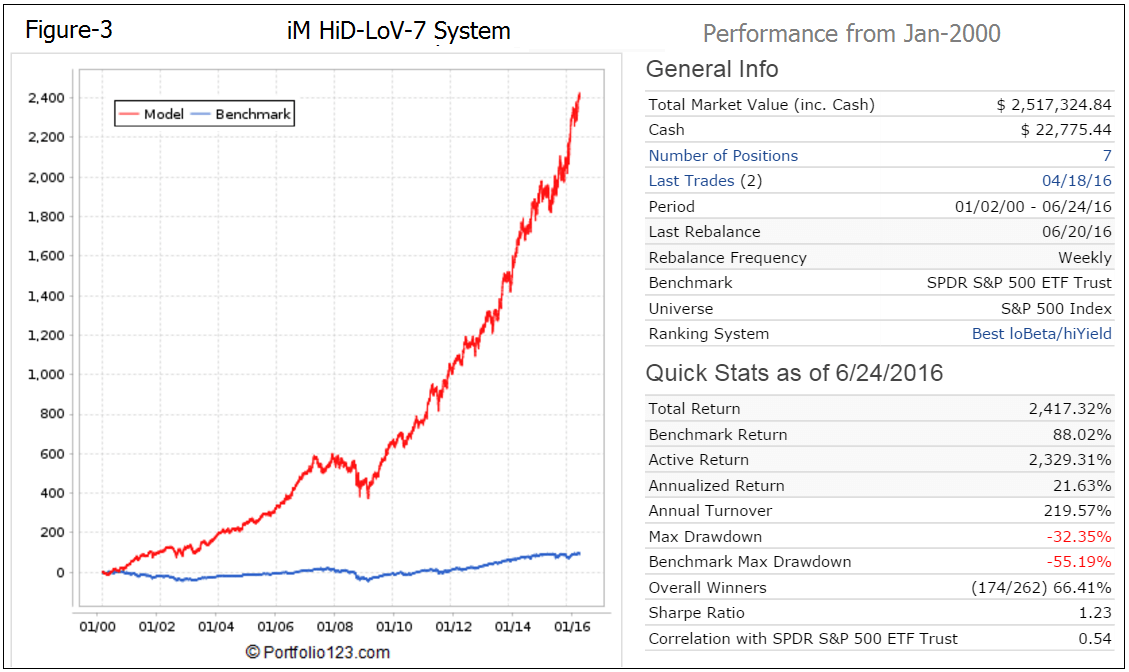
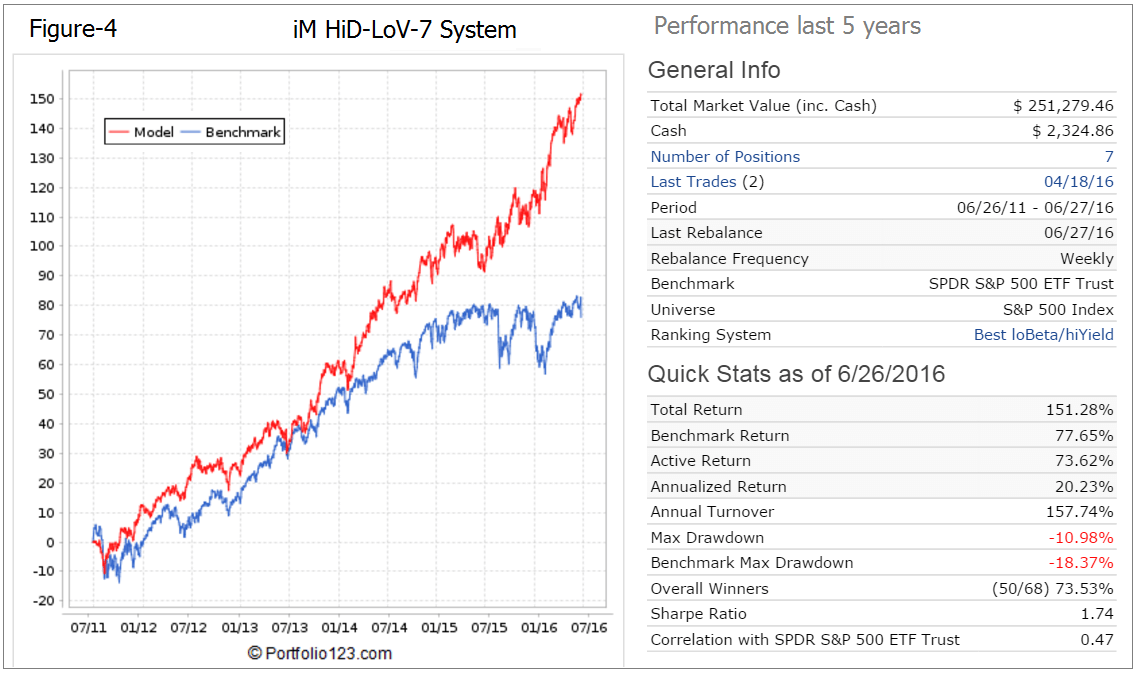
Figure-4: Simulated Performance last 5 years: Annualized Return= 20.2%, Max DD= -11.0%. Recently this model did not follow the market lower.
Performance comparison with S&P 500 Low Volatility High Dividend Index
The S&P 500 Low Volatility High Dividend Index measures the performance of the 50 least-volatile high dividend-yielding stocks in the S&P 500. The index is designed to serve as a benchmark for income-seeking investors in the U.S. equity market.
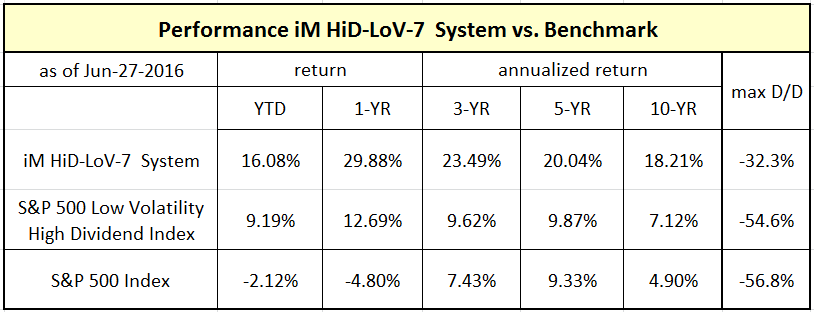
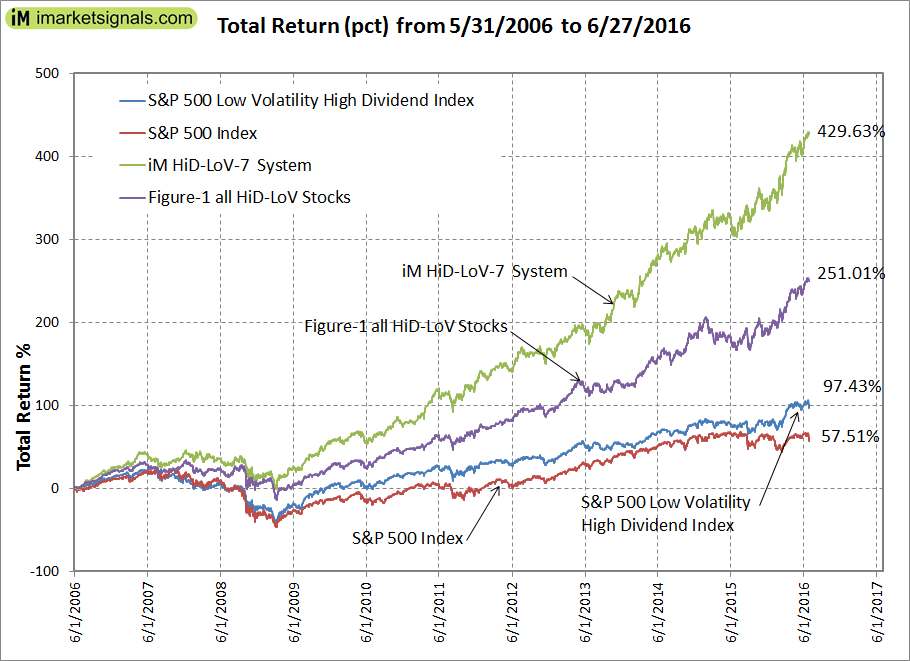
It is apparent that the returns from iM HiD-LoV-7 System and also from the screen-selected stocks (Figure-1) greatly exceeded the S&P 500 Low Volatility High Dividend Index returns, and maximum drawdown was also significantly better for the model and screen. Note, that the system and screen returns include dividends and trading costs, whereas the Index includes neither.
Also of interest, and shown in the figure above, is the performance of the S&P 500 Low Volatility High Dividend Index versus the S&P 500 Index, which highlights the superior returns from the least-volatile high dividend-yielding stocks in the S&P 500.
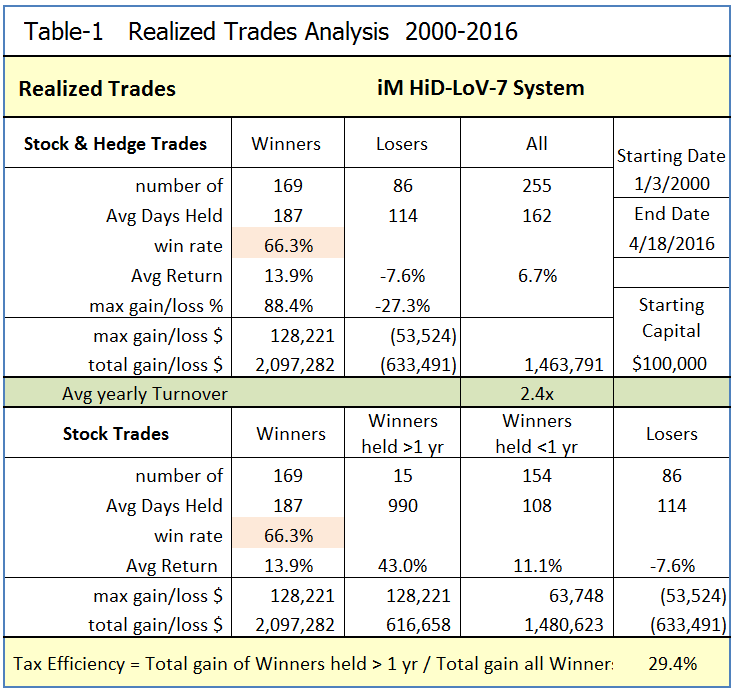
Realized Trades Analysis
An analysis of all the model’s realized trades is shown in Table 1. There were 169 winning trades out of 255 completed trades, resulting in a win rate of 66%. The average yearly turnover was about 2.4 times the annual end-of-year portfolio value. On average a position was held for 162 days. There were 15 winners held longer than one year, resulting in a Tax Efficiency of 29% for this model.
Liquidity
Currently this model holds seven positions: MO, O, T, CME, SO, PPL, and FE, all large-cap stocks with ample liquidity for the normal investor.
Rolling 3-year Returns
Over any 3-year period, starting Jan-2000 and 1 month offset intervals, this model showed returns ranging from -1% to +131%, whereas SPY returns ranged from -41% to +97% over the same periods.

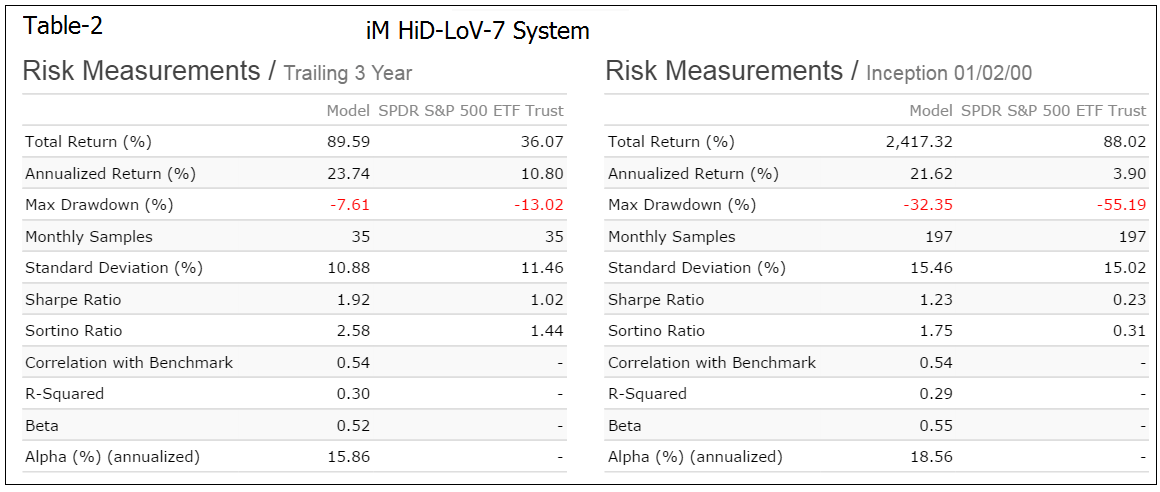
Risk Measurements
Table 2 lists the annualized returns, maximum drawdown, and various risk measurements for the trailing three years and for the full backtest period.
Hedging
The simulated performance of his model can be improved by hedging using the signals from our iM Standard Market Timer. In Figure-6 the hedge periods are indicated by the grey vertical bars, with the most recent hedging period having started on May-19-2016. Performance is shown when hedging by shortening the ETF (SSO) at 50% of current holdings.
Figure-6: Performance 2000-2016: Hedged short SSO at 50% of current holdings. Annualized Return= 31.2%, Max DD= -17.8%. The backtest period was from Jan-2000 to Jun-2016.
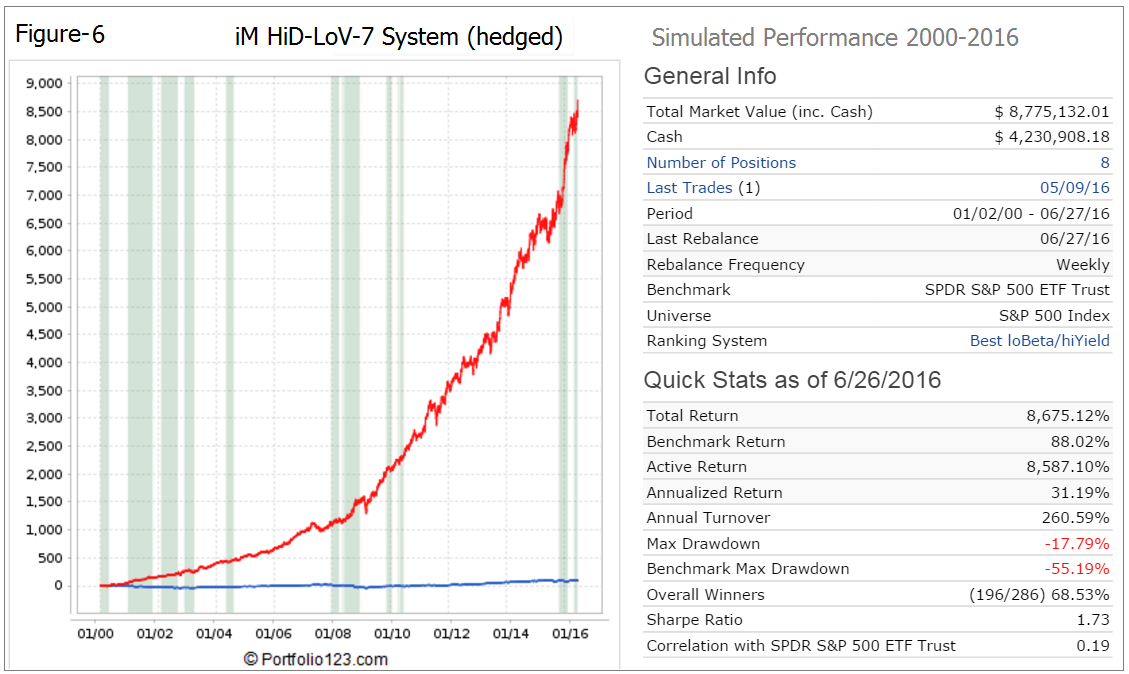
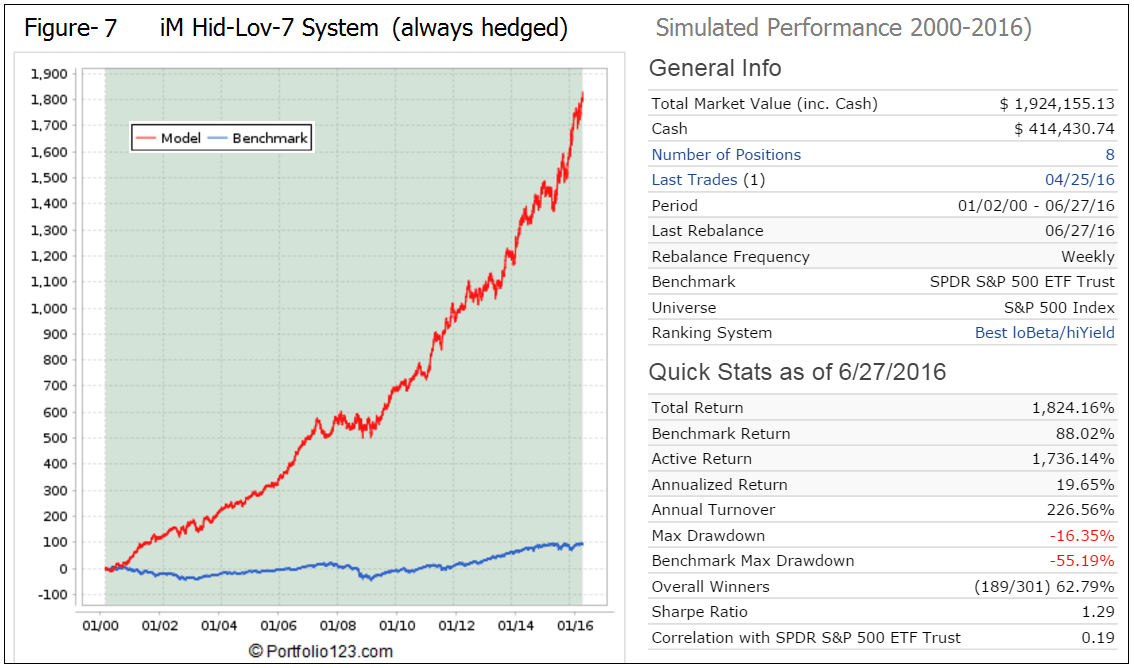
Figure-7: Performance 2000-2016: Always hedged short SSO at 20% of current holdings. Annualized Return= 19.7%, Max DD= -16.4%. The backtest period was from Jan-2000 to Jun-2016.
Following the Model
The backtests confirm that a successful strategy is to invest in the high-yielding, low-volatility stocks of the S&P500 according to the HiD-LoV-7 System. This model can be followed live at iMarketSignals (gold subscription required, model will be launched shortly) where it will be updated weekly together with our other trading models.
Disclaimer
One should be aware that all results shown for the HiD-LoV-7 System are from a simulation and not from actual trading.
All information for this model and its index prior to their launch dates is back-tested, based on the methodology that was in effect on the launch dates. Back-tested performance, which is hypothetical and not actual performance, is subject to inherent limitations because it reflects application of a methodology and selection criteria in hindsight. Actual returns may differ from, and be lower than, back-tested returns.
All results are presented for informational and educational purposes only and shall not be construed as advice to invest in any assets. Backtesting results should be interpreted in light of differences between simulated performance and actual trading, and an understanding that past performance is no guarantee of future results. All investors should make investment choices based upon their own analysis of the asset, its expected returns and risks, or consult a financial adviser.
Georg,
Is sim performance calculated with hedge paid using margin, and if not could you provide that breakdown.
Could you also provide breakdown of CAGR/DD by year for backtest period?
Thanks
The hedged simulations use a margin carry cost of 2% when a short position exists. Hedge slippage is assumed at 0.25% at entry and exit.
Anton,
It would also be interesting if you could show us what the ETF SPHD would return using the Standard Market Timer with 50% SSO hedge over the same time period.
Thanks,
Jon
Anton,
Please disregard my last request as I can calculate from the published exit and entrance dates of the hedge. Can you tell me the exit date for the hedge initiated on 11/2/15 as well, as the entrance date of the current hedge?
Thanks
The exit date of the hedge initiated on 11/2/15 was 2/22/16.
The entrance date of the current hedge was on May-19-2016 as stated in the model description.
Anton,
Just want to clarify the Hedged option.Since the Hedge is “on” and the SSO “doubles” the SH position the entire portfolio would be currently Hedged .So in reality we would be short the SPY and long the 7 current positions ?
Dave
Short 50% SSO is approx. equal to short 100% SPY.
If you wanted to be long SH one would have to sell 50% of current holdings for a long:short ratio of 1:1
Dave and Anton,
My take is
25% SDS in effect shorts 50% of portfolio as hedge?
Mark
For the hedging model, performance can be improved using the signals from iM Standard Market Timer.
How did you determine the most recent hedging period date as having started on May 19, 2016?
According to the iM Standard Market Timer blog posted Mar 18, 2016, the enter hedge date was 11/2/15 with no exit hedge date listed yet. Also on the home page the iM Standard Market Timer has been listed as:Hedge On since Mar 18, 2016.
Thank you
Good observation. We will investigate and ask P123 why the same rules produce different results for a portfolio and a simulation.
It would appear that the discrepancy is due to data revisions from the data provider. Please see:
https://www.portfolio123.com/mvnforum/viewthread_thread,9831_lastpage,yes#lastpost
Hi Georg and Anton
I’d like to buy long SDS instead of shorting SSO when the hedge is on. How would you recommend I do this? Or, maybe better, sell 50% of stock holdings; use proceeds to buy SH??
Thanks
Jim
We do not make any recommendations here, as we are not Financial Advisers. If one wanted to hedge one’s whole portfolio with SDS then one would sell approximately 30% of the portfolio and buy SDS. That would provide approximately a long:short ratio of 70:60.
Georg,
Would it be possible for you to do a short article on the issues with data revisions from P123 and how this is, or might, affect the performance of your portfolios in real time? It would be especially helpful to know which data sets, and portfolios are most likely to succumb to this issue.
Thanks
This problem is being discussed on the P123 forum. Please see:
http://www.portfolio123.com/mvnforum/viewthread_thread,9831_offset,0
Georg,
I read through the thread and my take away is that henceforth, you will refrain from using any estimated data. If this is correct, would you please tell us what models are using estimated data. I’m particularly interested in The Standard Market Timer, but I’m sure other subscribers would have differing interests.
Thanks,
Jon
Since the Standard Market Timer uses estimated earnings I guess that’s my answer, which then begs the question, is this model fatally flawed………
We will soon have another market timer at iM which is less subject to data revisions. It uses both momentum and economic data.
Quick question from a novice investor to Anton or anyone else. In this particular model, when hedging is signaled, what exactly should happen? For the
hedging example Anton gave (50% short SSO), should a portion of the current holdings be sold and this amount should be used to buy a short position in SSO? Or should another trade/position (short) be taken in SSO in the amount of 50% of the current portfolio?
Going short SSO does not require selling long positions. Hedging short means selling short SSO at 50% of current market value of the long positions.
Georg,
Love your work here.
2 questions:
1. Did AMZN huge gain affect the Vice stocks too much? its a one in a generation type company, what does the backtest data look like without them from 2000 to 2016? or was it not as big a factor in BESTOGA?
2. I keep seeing SPY all over your models.. would it not be prudent to substitute RSP ETF (equal weighted SP 500) instead of market cap weighted?
– geonada
1. AMZN is not a Vice stock, it is not used in Bestoga3.
2. We use SPY as the benchmark for most of our models. Also RSP inception date was 4/24/03, too late for our backtests, which usually begin 1/2/2000.
When do you estimate the “new” market timer to be ready? as stated above on July 11
One can use the Market Climate Score model. Hedge on when MCS > 2 and off when MCS < 3. However it's results are somewhat lower than the Standard Market Timer.
Hi Anton/Georg:
So, when the Standard Market Timer is ‘On’, it’s suggested to hedge 50% of the strategies stock holdings. Can this be done by selling 50% of these positions and using the proceeds to buy SH. This would create a 50:50 long/short position.
Many thanks
Vman
Figure-6 is a backtest example of hedging short 50% SSO when the Standard Market Timer is ‘On’. This would create a 50:50 long/short position.
If on sold 50% of the holdings and bought SDS as a hedge the long/short position would be 33:67 as on would be long 50% and short 2×50%. For a 50:50 long short position one would only sell 33.3% of holdings and buy SDS. Then one would be 66.7% long and 2×33.3% short.
Hi Georg
Do you think the new Composite Market Timer would be better than the Standard Market Timer as an hedge indicator for this strategy??
Thanks
Vman
Simulated performance of Best7(HiD-LoV) when hedged with short SSO and Hedge Ratio 50%.
Hedged according to Standard Market Timer (10 hedge periods):
Annualized Return 32.33%
Annual Turnover 293.08%
Max Drawdown -16.68%
Overall Winners (217/310) 70.00%
Sharpe Ratio 1.93
Hedged according to Composite Market Timer (35 hedge periods):
Annualized Return 31.14%
Annual Turnover 344.18%
Max Drawdown -16.13%
Overall Winners (227/332) 68.37%
Sharpe Ratio 1.80
Yes this is good system I like it.
Geovrba can you hedging this system as you did with BestogaX-5,
hedging with SDS 20% and 50%.
Thank you for good systems.
Gogo
Simulated performance of Best7(HiD-LoV) when hedging long 35% SDS gives approx hedge ratio long/short 65%/70% or (1/1.08).
Hedged according to Standard Market Timer (10 hedge periods):
Annualized Return 28.51%
Annual Turnover 271.16%
Max Drawdown -17.93%
Overall Winners (277/415) 66.75%
Sharpe Ratio 1.94
Thanks Gerg,
Very good system,
But please can you make a system of 2:
Best7-no hedged 60%
And switching SH-RSP 40%
Please change procentige for best performance.
I appreciate very much your work
Thank you
Combo of 60% Best7-not hedged and 40% SH-RSP
Simulated performance from Jan-200 to Nov-2016
Quick Stats as of 11/25/2016
Total Return 4,700.80%
Benchmark Return 106.07%
Active Return 4,594.72%
Annualized Return 25.74%
Max Drawdown -17.45%
Benchmark Max Drawdown -55.19%
Sharpe Ratio 1.91
Thank you for fast answer
It is good system
Aside from hedging – how would the results differ if the portfolio was rebalanced every three months instead of weekly
thanks
Stocks are only bought or sold in January, April, July, and October. This is why the average annual turnover is only about 240%.
The iM-model Best7(HiD-LoV) is not hedged.
In the model description hedging was only shown for illustration purposes.
If one only rebalanced in January, April, July, and October when positions are bought and sold instead of a weekly rebalance – how would this effect the return. I really would like to only make changes quarterly
thank you
Stocks are only bought or sold in January, April, July, and October. During those months trades can take place on the first trading day of any week, because the model is rebalanced weekly.
So the next time trades can occur will be in January 2017. Until then the portfolio holdings will not change.
Forgive my lack of communication skills – what would happen if no weekly rebalance occurred and the only time the portfolio was rebalanced was when stock was bought or sold
We run these models on the Portfolio P123 platform which does not allow this option.
Georg
How about Combo 30% Betoga5 system no hedge, 30% Best7-not hedged and 40% SH-RSP?