
In an effort to satisfy request for low turnover models with low drawdowns and reasonable returns we provide this model, which combines:
- the iM-Comp Mkt Timer Stocks/Bonds (VOE-BIV) based on the iM-Composite Timer (SPY-IEF) which holds only one ETF at any time (33% weight in the combo),
- and the iM-Composite Mkt Timer(GLD&SCHP+VTV&VOE+BIV&LQD) based on the iM-Composite (Gold-Stocks-Bond) Timer which holds two ETFs concurrently (67% weight in the combo).
- This combination model therefore always holds three or two ETFs at any time for a minimum period of six weeks before any of them can be sold.
The combo showed a 17.6% annualized return with a maximum drawdown of -11.2% when backtested from Jan-2000 to Mar-2017 on the simulation platform Portfolio 123. Trading costs of 0.1% of all trade amounts were applied to provide for slippage and broker commission.
ETFs and Mutual Funds
P123 provides extended price data for ETFs prior to their inception dates calculated from their proxies. Most ETFs used have also corresponding Vanguard mutual funds, as listed below.
Gold:
SPDR Gold Shares (GLD) or Vanguard Precious Metals and Mining Inv (VGPMX)
TIPS Fund:
Schwab US TIPS ETF (SCHP) or Vanguard Inflation-Protected Secs Adm (VAIPX)
Bond Funds:
Vanguard Interm-Term Bond ETF (BIV) or Vanguard Interm-Term Bond Index Adm (VBILX)
iShares iBoxx Invst-Grade Crp Bond (LQD) or Vanguard Interm-Term Invst-Grade Adm (VFIDX)
Stock Funds:
Vanguard Value ETF (VTV) or Vanguard Value Index Adm (VVIAX)
Vanguard Mid-Cap Value ETF (VOE) or Vanguard Mid-Cap Value Index Adm (VMVAX)
Possible combinations are:
33% GLD + 33% SCHP + 33% BIV,
33% GLD + 33% SCHP + 33% VOE,
33% VOE + 33% BIV + 33% LQD,
33% BIV + 33% VTV + 33% VOE,
67% VOE + 33% VTV and
67% BIV + 33% LQD.
As of Mar-23-2017, the model holds 67% BIV + 33% LQD.
Historic performance of ETF positions
On average the ETFs when held by the model showed the following weekly returns:
Gold: 0.64%, Stocks: 0.58%, Bonds: 0.07%.
In the model the average weekly return for bond ETFs is much lower than for gold and stock ETFs. Thus shorter-term bond funds could be used without affecting performance too much. When replacing SCHP with VTIP, BIV with BSV, and LQD with IEI, then the combo showed a 15.5% annualized return with a maximum drawdown of -10.0% when backtested from Jan-2000 to Mar-2017.
Performance
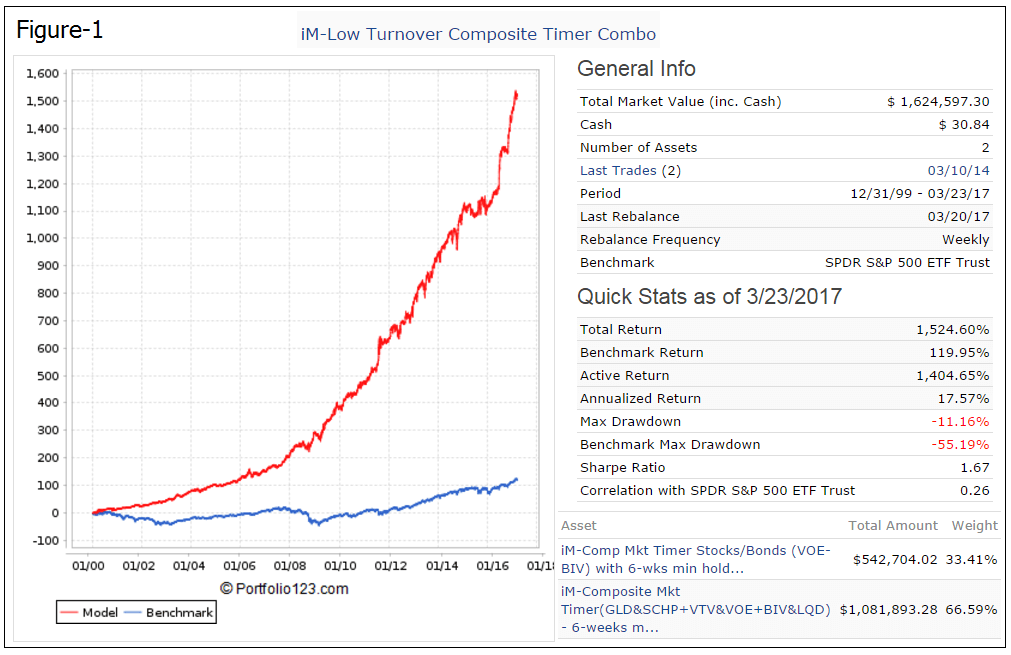
The simulated performance from Jan-2000 to Mar-2017 is shown in Figure-1. The red graph represents the performance of the model and the blue graph shows the corresponding performance of benchmark SPY.
For the backtest period the simulated annualized return was 17.6% with a -11.2% maximum drawdown.
The simulated performance from Mar-2009 to Mar-2017 is shown in Figure-2. The start date for this period is the date when the S&P 500 was at its lowest level during the financial crisis recession.
For the 8-year backtest period the simulated annualized return was 20.3% with a maximum drawdown of -7.3%. The model moderately out-performed with much lower drawdown the SPDR S&P 500 ETF (SPY).
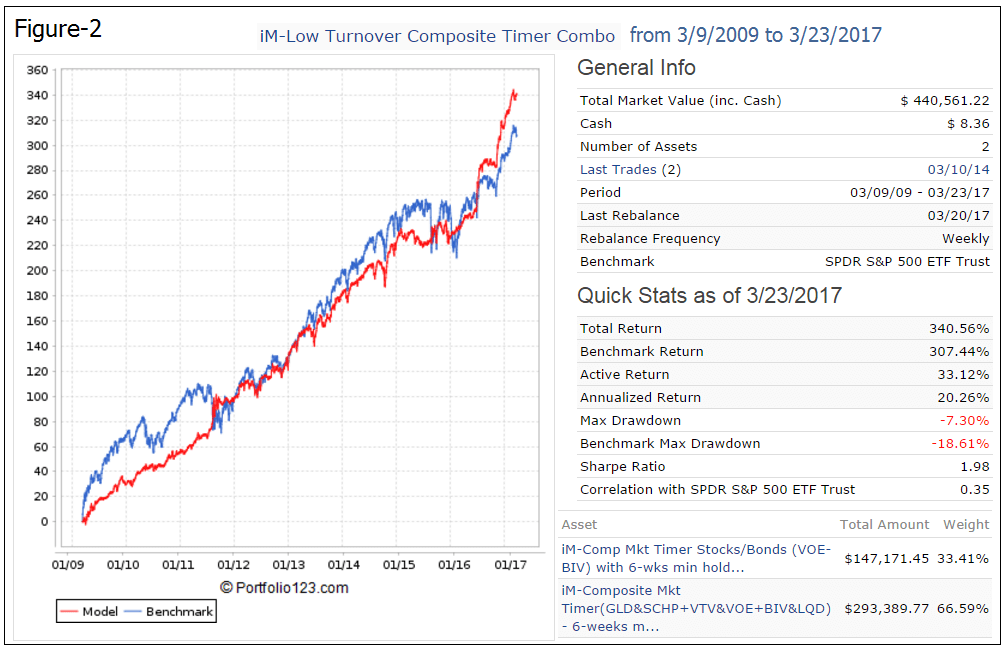
Table 1 shows the realized trades analysis for the combination model. There were only 142 realized trades.
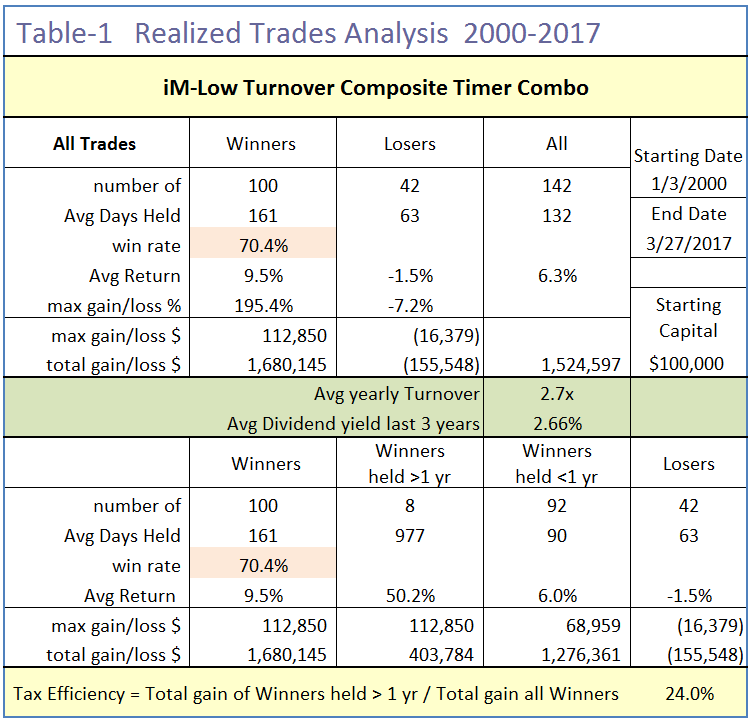
Holding periods and number of trades are listed below. Positions were held for an average of 132 days.
| Holding period | Number of trades |
| 42-92 days | 92 |
| 93-183 days | 33 |
| 184-240 days | 8 |
| 241-365 days | 1 |
| More than a year | 8 |
Number of trades per year ranged from a minimum of 2 trades in 2002, to a maximum of 17 trades in 2015. On average there were 8 trades per year.
Table 2 shows the performance statistics for the combination model. It never made a loss over a calendar year. The worst performance was for 2015, about the same as for benchmark SPY.
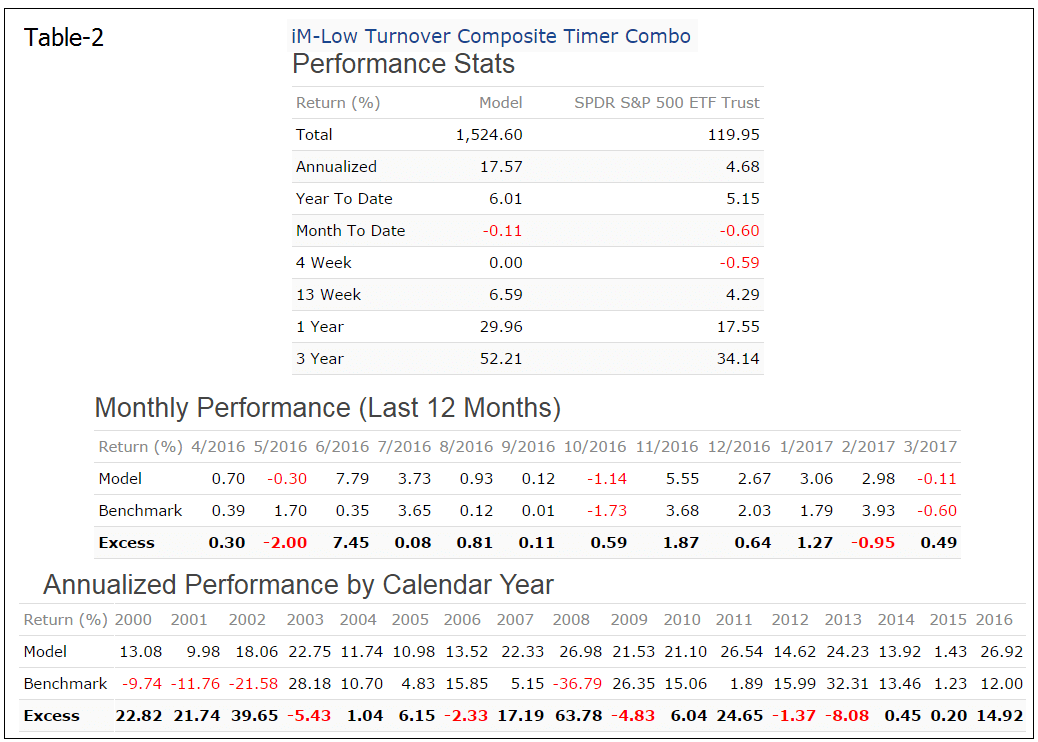
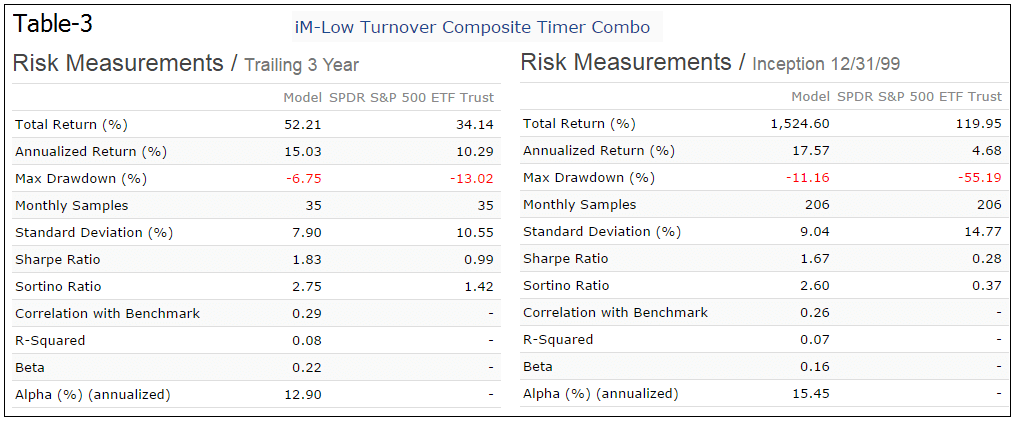
Table-3 gives risk measurements for the preceding 3-years and for the entire backtest period.
Following the model
This model should be of interest to investors who wish to keep their trading activity to a minimum. During up-market periods the model cannot perform much better than the benchmark SPY, but because of the various market timers built into the two component-models it should prevent major drawdowns when stocks perform poorly.
Also, in anticipation of rising interest rates it may be prudent to replace the bond ETFs with shorter-term bond ETFs which would have resulted in lowering the annualized return by only about 2% over the full backtest period.
On iMarketSignals we will report the performance of this combination model, with weekly trading signals normally provided on Sundays to Gold level members.
Disclaimer
Note: All performance results are hypothetical and the result of backtesting over the period 2000 to 2017. Out-of-sample performance may be different. No claim is made about future performance.
With drawdowns this low, some may wish to invest in 2x equities if they are available. What do you get if you substitute 2x equities wherever possible?
This model is intended for conservative investors, and has been structured that for most ETFs there is a comparable mutual fund available.
More aggressive investors may want to consider the iM Composite Timer Gold-Stocks-Bonds, which is 1.5x leveraged when the model is in stocks.
another nice one. I assume the model shown represents gold etf. gold and VGPMX behave a bit differently. what happens when you substitute with VGPMX, as mentioned in the summary?
Yes, the performance of VGPMX differs a bit from GLD, it is not the perfect substitute for GLD. However for the investment periods $1.00 invested would have grown to $7.44 for GLD, and to $8.98 for VGPMX.
GLD … 04/02/2001 to 05/14/2001 … 4.64% … 1.05
GLD … 09/10/2001 to 03/17/2003 … 25.26% … 1.31
GLD … 04/28/2003 to 03/17/2008 … 195.38% … 3.87
GLD … 05/05/2008 to 09/29/2008 … 3.67% … 4.01
GLD … 07/20/2009 to 02/01/2010 … 15.92% … 4.65
GLD … 04/26/2010 to 08/08/2011 … 47.92% … 6.88
GLD … 12/19/2016 to 02/06/2017 … 8.17% … 7.44
VGPMX … 04/02/2001 to 05/14/2001 … 24.96% … 1.25
VGPMX … 09/10/2001 to 03/17/2003 … 35.36% … 1.69
VGPMX … 04/28/2003 to 03/17/2008 … 445.57% … 9.23
VGPMX … 05/05/2008 to 09/29/2008 … -42.42% … 5.31
VGPMX … 07/20/2009 to 02/01/2010 … 23.46% … 6.56
VGPMX … 04/26/2010 to 08/08/2011 … 6.95% … 7.02
VGPMX … 12/19/2016 to 02/06/2017 … 28.07% … 8.98
Nice system.
I don’t see it on your list of systems though. Am i missing something ?
https://imarketsignals.com/wp-content/uploads/2015/03/iM-fees.png
Also, where can i see every trade ? Thank you
Brandon
Is there an error on the current holdings? Should it be GLD instead of LQD?
Thank you for pointing this out.
The model holds GLD, SCHP, and VOE, all according to our Sunday email.