
- The Vanguard Dividend Growth Fund VDIGX is closed to new investors. Want-to-be investors can possibly do better than the fund by investing only in a few positions of the fund’s holdings.
- The iM-Best10(VDIGX)-Trader relies on the expertise of the Vanguard’s advisors to make the primary stock selection. VDIGX currently holds 45 large-cap stocks from which the Trader periodically picks its stocks.
- The Trader invests in the ten highest ranked stocks of VDIGX. This strategy, postulated in 2014, has produced to Jun-2017 a 3-year return of more than double that of VDIGX.
- The 3-year performance of the Trader was 64.1% versus 28.4% for VDIGX, giving an excess return of 35.7%. Trading frequency was low, with positions held on average for 126 days.
According to Vanguard, the Dividend Growth Fund
“focuses on high-quality companies that have both the ability and the commitment to grow their dividends over time and seeks above-average current income and long-term growth of capital and income. The advisor, Wellington Management Company, LLP, invests in a diversified array of stable, well-managed companies that have a history of or a potential for growing dividends over time. Valuation is key to security selection, with the advisor preferring stocks that trade at a discount to the market or that possess an attractive risk/reward profile”.
In this previous article we showed by backtesting that better returns than those from the fund could be obtained by applying a ranking system to the stock holding of VDIGX (the universe), and investing periodically only in the ten highest ranked stocks, bought and sold according to certain rules.
For the live model all rules remained the same as for the original simulation, except that the model’s universe was periodically updated with the stock holding of VDIGX which Vanguard publishes approximately every three months.
The model assumes an initial investment of $100,000 and runs on the on-line platform Portfolio 123. Trading costs, including slippage was taken as variable, which amounts to approximately 0.10% to 0.15% of trade amounts.
Performance
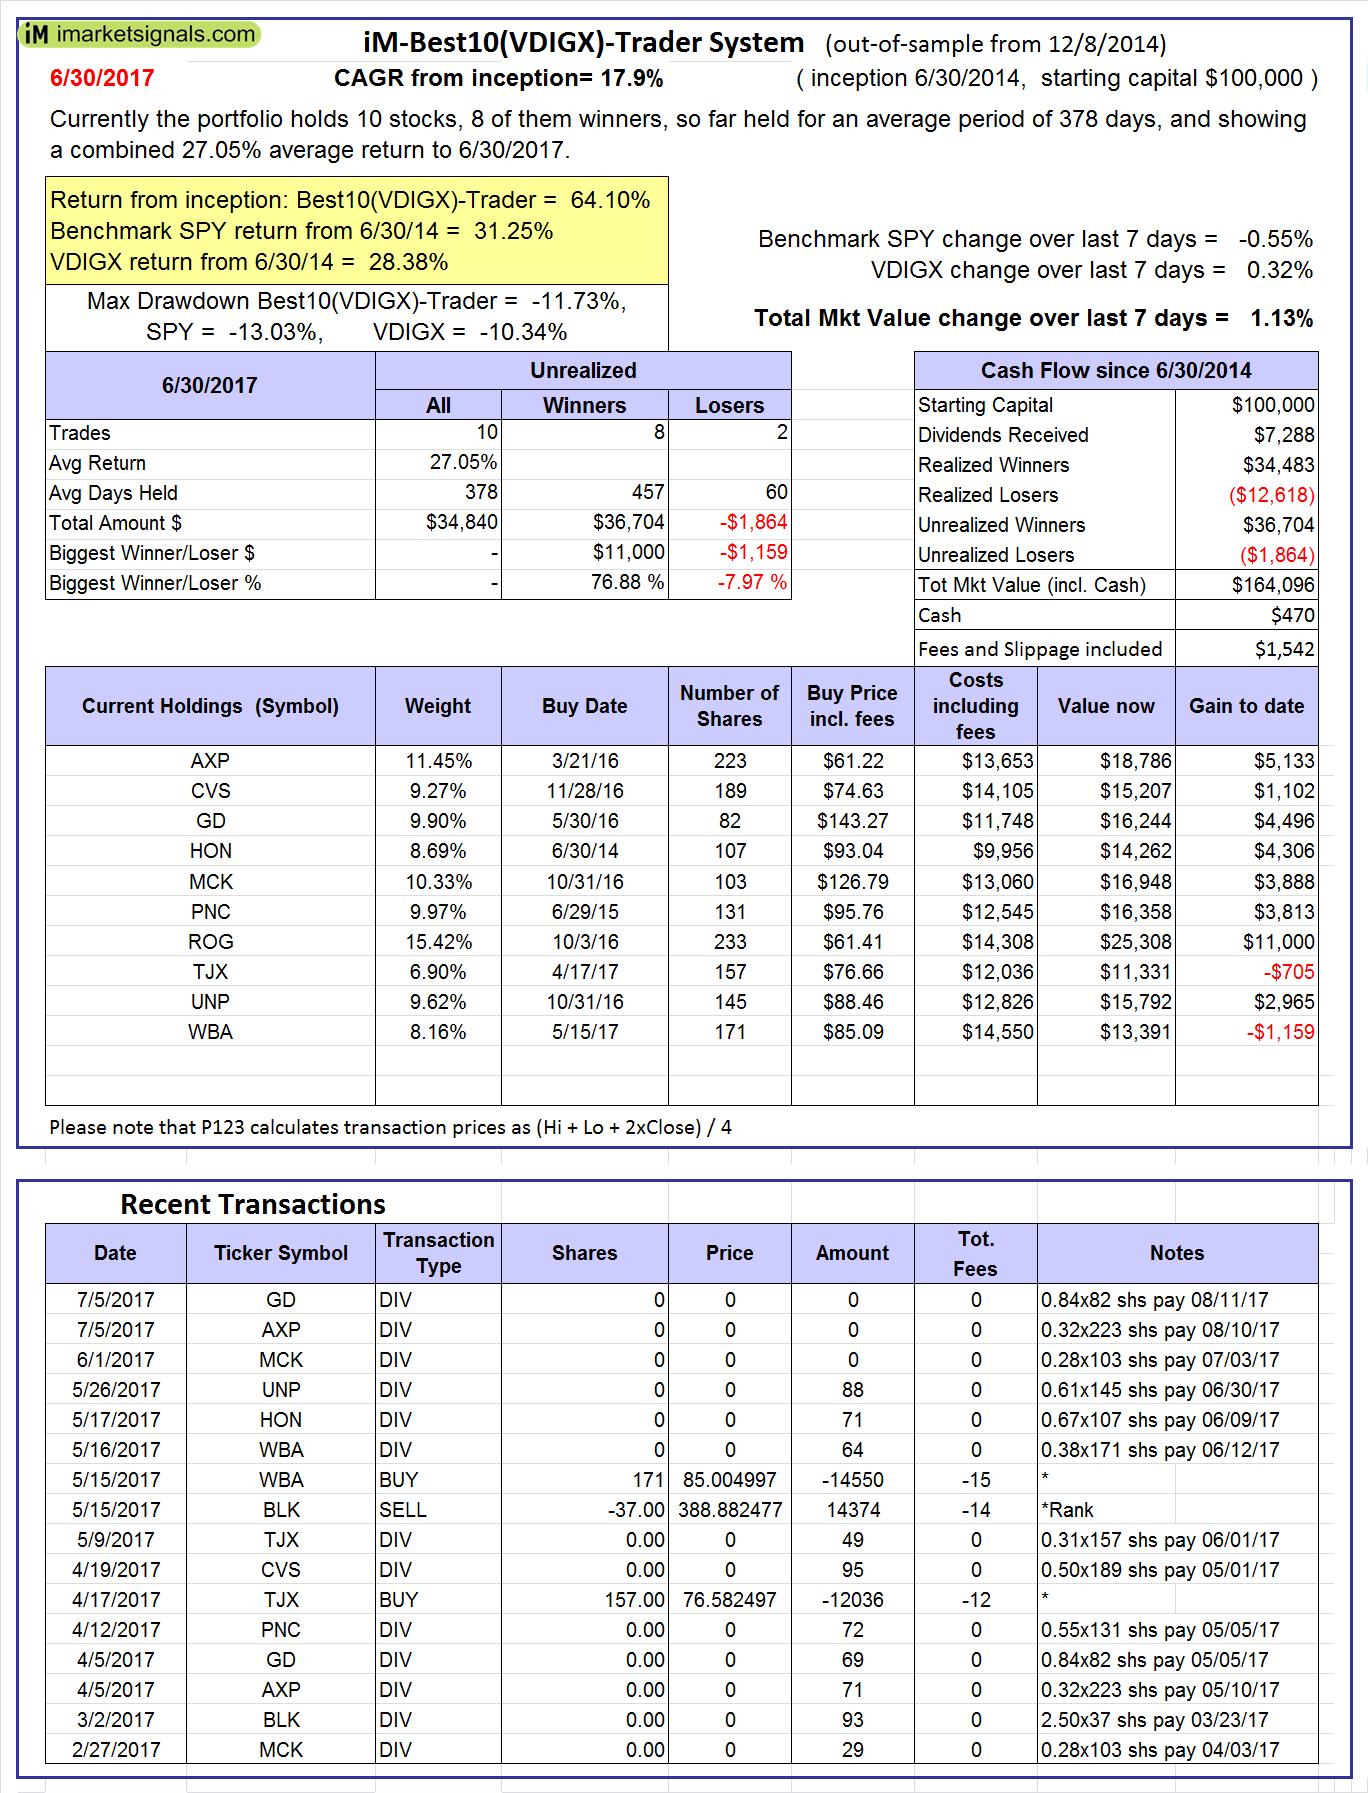
The iM-Best10(VDIGX)-Trader is now three years old, and since Dec-2014 we have published trade signals, holdings and performance on our website iMarketSignals.com. An example of the weekly update can be found in the Appendix.
The Figure-1 below depicts the performance from Jun-30-2014 together with the well diversified sector allocation of the current holdings. The 3-year performance of the iM-Best10(VDIGX)-Trader was 64.1% versus 28.4% for VDIGX and 31.2% for SPDR S&P 500 ETF (SPY).
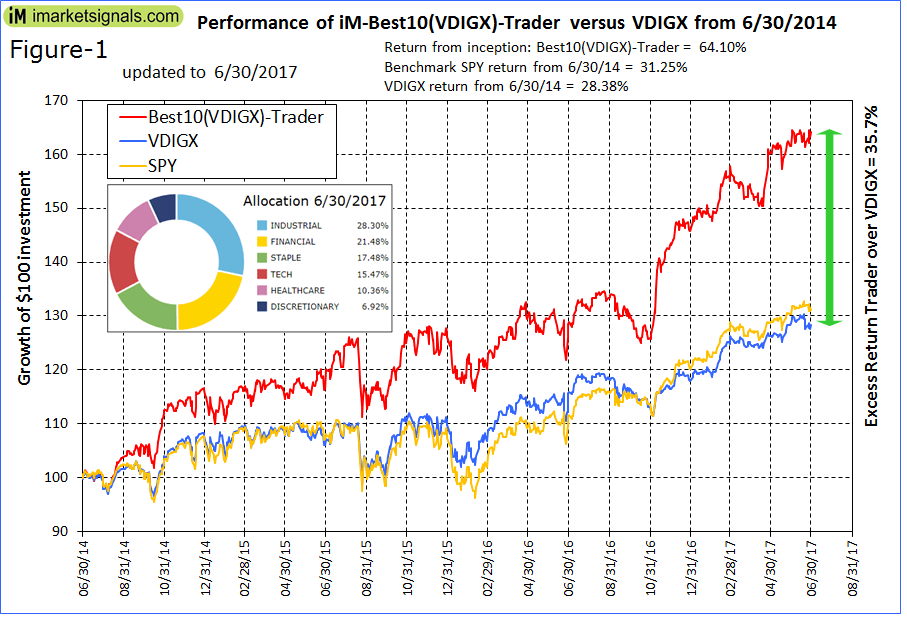
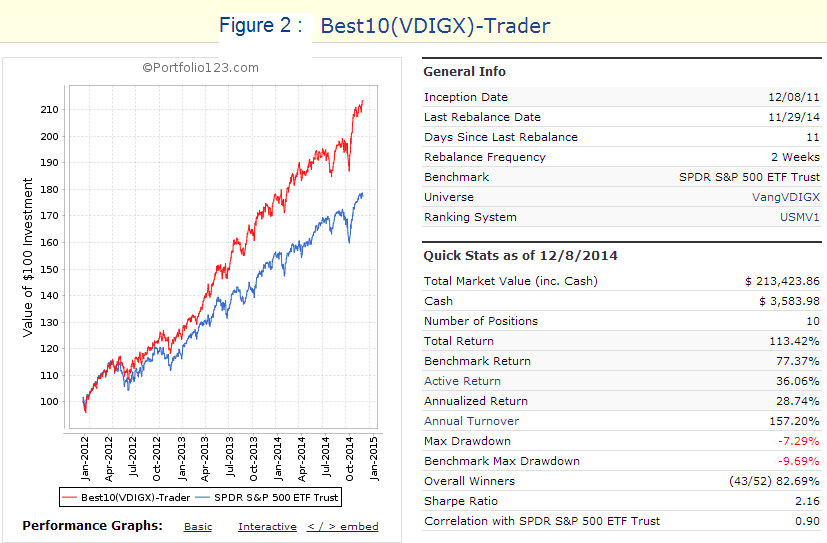
Figure-2 is taken from Portfolio 123 and gives performance statistics from 6/29/2014 to 6/30/2017. The total return for the Trader was 64.1% and the annualized return (CAGR) was 17.9 %. The total return for benchmark SPY was 31.2%, about half of the Trader’s return.

Current Holdings
|
Holdings of iM-Best10(VDIGX)-Trader on 6/30/2017 |
|||||
|
Ticker |
Name |
MktCap ($ millions) |
Sector Code |
Yield (%) |
PEG |
|
AXP |
American Express Co |
75,395 |
FINANCIAL |
1.52 |
1.88 |
|
CVS |
CVS Health Corp |
82,632 |
STAPLE |
2.49 |
0.87 |
|
GD |
General Dynamics Corp |
59,764 |
INDUSTRIAL |
1.70 |
6.06 |
|
HON |
Honeywell International Inc |
101,612 |
INDUSTRIAL |
2.00 |
1.70 |
|
MCK |
McKesson Corp |
34,718 |
HEALTHCARE |
0.68 |
0.80 |
|
PNC |
PNC Financial Services Group Inc. |
60,562 |
FINANCIAL |
1.76 |
1.38 |
|
ROG |
Rogers Corp. |
1,968 |
TECH |
0.00 |
0.86 |
|
TJX |
TJX Companies Inc (The) |
46,425 |
DISCRETIONARY |
1.73 |
1.72 |
|
UNP |
Union Pacific Corp |
88,127 |
INDUSTRIAL |
2.22 |
1.56 |
|
WBA |
Walgreens Boots Alliance Inc |
83,799 |
STAPLE |
1.92 |
0.58 |
Conclusion
Using a ranking system to rank the stock holdings of VDIGX and only investing periodically in the 10 highest ranked stocks produced much better returns over the last three years than the fund itself. This is confirmation of the expected performance from backtest (B) in the original model description reproduced in the Appendix below for easy reference.
The backtest was over a 3-year period and shows that the model should out-perform SPY. In the backtest the model produced about 1.5-times more than SPY, which is less than the actual 3-year performance to Jun-2017 of about 2.0-times that of SPY.
Following the Models
To receive the signals and weekly performance updates of the iM-Best10(VDIGX)-Trader a Silver subscription is required.
Disclaimer
The performance data shown represent past performance, which is not a guarantee of future results. Investment returns and portfolio value will fluctuate, so stocks when sold may be worth more or less than their original cost. Future performance may be lower or higher than the performance data cited.
Appendix
Extract from original model description:
Results for backtest (B) with 10 selected stocks from VDIGX’s current holdings:
Had one on Dec-8-2011 invested equal weight in the 10 highest ranked stocks, rebalanced every 2 weeks and applied buy and sell rules, then over 3 years to Dec-8-2014 the total return would have been 113.4% and the annualized return (CAGR) would have been 28.7 %. Allowance was made for an expense ratio of 0.31% as for the fund.
This strategy would have provided much higher returns than Vanguard’s Dividend Growth Fund or SPY. Going forward, it will be a simple matter to update the Trader model periodically with the point-in-time holdings of VDIGX to eliminate any possible effect of survivorship bias.
Example of Weekly Update
Leave a Reply
You must be logged in to post a comment.