
- This system always holds five ETFs (equity-, fixed income-, leveraged equity-, short equity-, and Gold-ETFs) selected according to stock market climate and rank.
- Typically, during good-equity markets it holds equity-ETFs and/or leveraged-equity ETFs, and during bad-markets fixed income-ETFs and/or short equity-ETFs. Also at times it can hold three gold-ETFs with other ETFs.
- A one factor ranking system selects five ETFs from a preselected list of 33 ETFs. A simulation from 2000 to 2017 shows a 35% annualized return with a maximum drawdown of -13%.
The model was backtested on the on-line simulation platform Portfolio 123 which also provides extended price data for ETFs prior to their inception dates calculated from their proxies. ETFs, other than P123 extended ETFs, were only considered for selection six months after their inception. Trading costs, including slippage, were assumed as 0.1% of the trade amounts using closing prices.
Model Philosophy
The basic approach is to invest in five equity-ETFs during up-market periods and in five fixed-income-ETFs during down-market periods (Basic model). Market timing rules, listed further down, were applied to identify those periods.
To improve return and Sharpe ratio, the model invests in three gold-ETFs when gold timing rules indicate this to be profitable and permitted by the ranking system. During those periods the model could have a 60% investment in gold-ETFs.
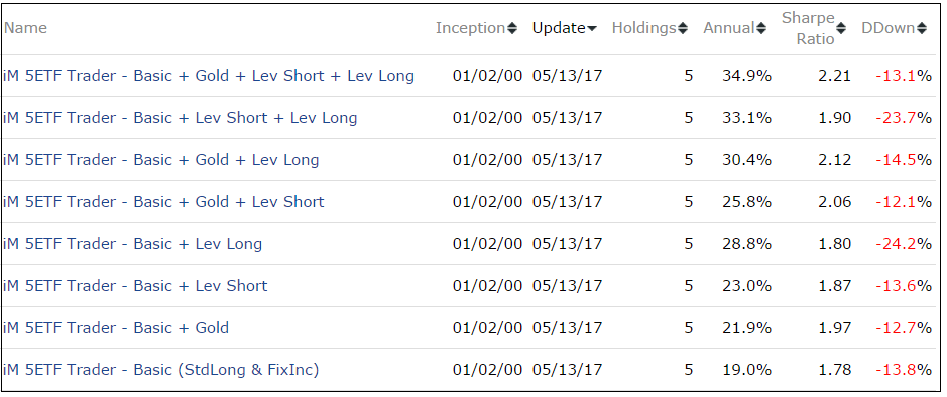
Further improvement to annualized return is achieved by adding inverse- or leveraged equity-ETFs during down- or up-markets, respectively. The table below shows returns for all possible ETF type combinations with the Basic model. The model on top of the table has the highest return, high Sharpe Ratio with reasonable maximum drawdown and is the one to which this model description applies
The Ranking System
The ranking system’s approach assumes trading ETFs, rather than investing for longer periods.
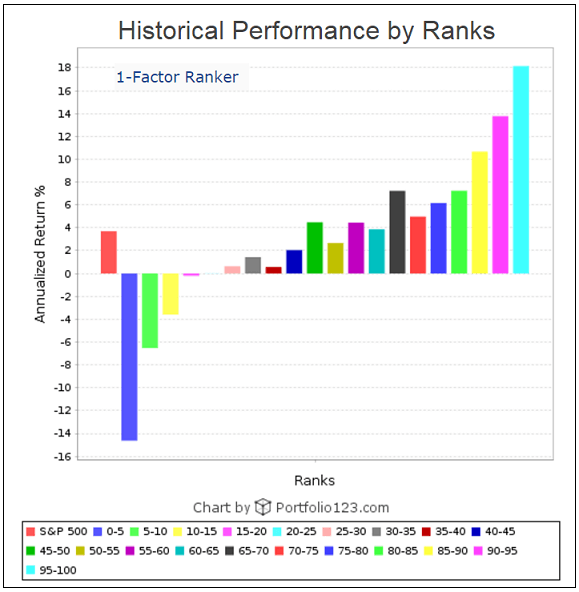
The one factor system is based on the price changes over a short period. The idea being that ETFs which have experienced a decline over a short period will bounce back, reverting and doing better than ETFs which have not declined in this way.
When testing this simple ranking system on the entire universe of all ETFs and CEFs traded on US markets one finds that, when rebalanced weekly, it produces a well-defined performance decline from higher to lower ranks, as shown in the diagram below.
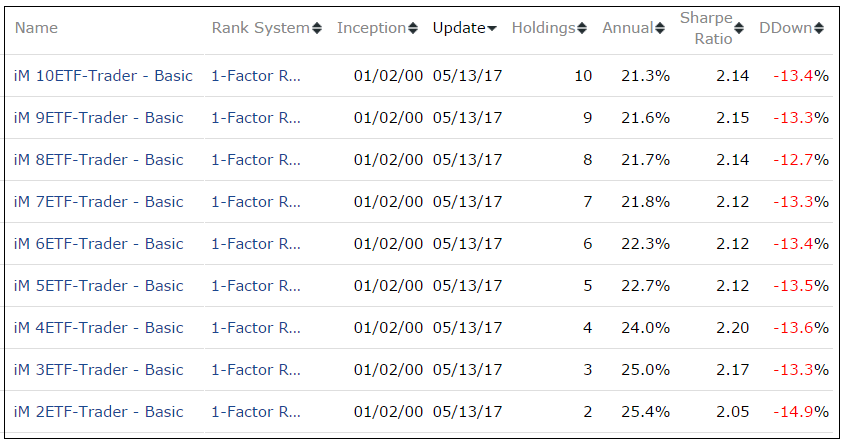
Also, one would expect that an efficient ranking system would produce higher returns for lower number of holdings in the model. This is indeed what happens when varying the number of holdings from two to ten in the ETF Trader Basic model. Trading costs were set to 0% so as not to affect the test. The model holding two ETFs produced an annualized return of 25.4%, which diminishes consistently as holdings were increased, all as shown in the table below.
The ETF Selection List
The model typically holds five ETFs from the list below, periodically selected by the ranking system and buy rules.
|
Ticker |
ETF Name |
AssetClass |
AvgDailyTot $-million |
Inception |
|
|
IWB |
iShares Russell 1000 |
Equity Std Long |
91.1 |
5/19/2000 |
E |
|
IWF |
iShares Russell 1000 Growth |
Equity Std Long |
178.6 |
5/26/2000 |
|
|
IWV |
iShares Russell 3000 |
Equity Std Long |
19.0 |
5/26/2000 |
E |
|
USMV |
iShares Edge MSCI Min Vol USA |
Equity Std Long |
65.9 |
10/20/2011 |
E |
|
MTUM |
iShares Edge MSCI USA Momentum Factor |
Equity Std Long |
59.2 |
4/18/2013 |
|
|
VIG |
Vanguard Dividend Appreciation |
Equity Std Long |
58.5 |
4/27/2006 |
E |
|
VNQ |
Vanguard REIT |
Equity Std Long |
417.2 |
9/29/2004 |
E |
|
VOE |
Vanguard Mid-Cap Value |
Equity Std Long |
27.0 |
8/24/2006 |
E |
|
NOBL |
ProShares S&P 500 Dividend Aristocrats |
Equity Std Long |
11.2 |
10/10/2013 |
|
|
PXLG |
PowerShares Russell Top 200 Pure Growth |
Equity Std Long |
2.6 |
6/16/2011 |
|
|
QQQ |
PowerShares QQQ Trust Series 1 |
Equity Std Long |
2,869.2 |
3/10/1999 |
|
|
RSP |
Guggenheim S&P 500 Equal Weight |
Equity Std Long |
53.4 |
4/30/2003 |
E |
|
SPY |
SPDR S&P 500 ETF Trust |
Equity Std Long |
14,087.1 |
1/29/1993 |
|
|
UWM |
ProShares Ultra Russell2000 |
Equity Levgd Long |
13.5 |
1/25/2007 |
E |
|
DDM |
ProShares Ultra Dow30 |
Equity Levgd Long |
14.0 |
6/21/2006 |
|
|
SSO |
ProShares Ultra S&P500 |
Equity Levgd Long |
139.3 |
6/21/2006 |
E |
|
QLD |
ProShares Ultra QQQ |
Equity Levgd Long |
64.0 |
6/21/2006 |
|
|
SDS |
ProShares UltraShort S&P500 |
Equity Levgd Short |
67.1 |
7/13/2006 |
E |
|
ANGL |
VanEck Vectors Fallen Angel High Yield |
Fixed Income |
10.7 |
4/11/2012 |
|
|
CIU |
iShares Intermediate Credit Bond |
Fixed Income |
40.4 |
1/11/2007 |
E |
|
CSJ |
iShares 1-3 Year Credit Bond |
Fixed Income |
46.0 |
1/11/2007 |
|
|
EMB |
iShares JPMorgan USD Emerging Mkts |
Fixed Income |
230.5 |
12/19/2007 |
E |
|
IEF |
iShares 7-10 Year Treasury Bond |
Fixed Income |
192.2 |
7/26/2002 |
E |
|
IEI |
iShares 3-7 Year Treasury Bond |
Fixed Income |
29.8 |
1/11/2007 |
E |
|
LQD |
iShares iBoxx Investment Grade Corp |
Fixed Income |
355.8 |
7/26/2002 |
E |
|
SHY |
iShares 1-3 Year Treasury Bond |
Fixed Income |
79.2 |
7/26/2002 |
E |
|
BND |
Vanguard Total Bond Market |
Fixed Income |
147 |
4/10/2007 |
E |
|
BNDX |
Vanguard Total International Bond |
Fixed Income |
34.9 |
6/4/2013 |
E |
|
VMBS |
Vanguard Mortgage-Backed Securities |
Fixed Income |
25.5 |
11/24/2009 |
E |
|
VWOB |
Vanguard Emerging Markets Govt |
Fixed Income |
5.7 |
6/4/2013 |
E |
|
GLD |
SPDR Gold Trust |
Commodities |
853.5 |
11/18/2004 |
E |
|
IAU |
iShares Gold Trust |
Commodities |
98.3 |
1/28/2005 |
E |
|
DBP |
PowerShares DB Precious Metals |
Commodities |
2.1 |
1/5/2007 |
|
| E = P123 extended data from 12/31/98 | |||||
Market timing Rules
Up- and down-markets definition is based on:
- the S&P 500 Risk Premium,
- the score of the iM-Composite Market Timers,
- and the current-year consensus S&P 500 EPS estimate.
(Risk Premium= SP500 Estimated Earnings Yield – 10Y T-Note Yield)
Down-markets are defined as periods when up-market conditions are absent.
Definition of Gold-markets is based on the algorithm of the iM-Gold Timer.
Buy- and Sell Rules
Buy highest ranked and:
Buy Gold-ETFs when gold-buy-signal is present, or
buy Fixed Income-ETFs, or Inverse-ETFs when down-market conditions exist, or
buy Equity-ETFs or Leveraged Equity-ETFs when up-market conditions exist.
Sell-rule is independent of rank:
Sell Gold-ETFs when gold-sell-signal is present, or
sell Equity-ETFs or Leveraged Equity-ETFs when down-market condition exist, or
sell Fixed Income-ETFs, or Inverse-ETFs when up-market conditions exist.
Performance of the iM-5ETF Trader
Performance 2000-2017
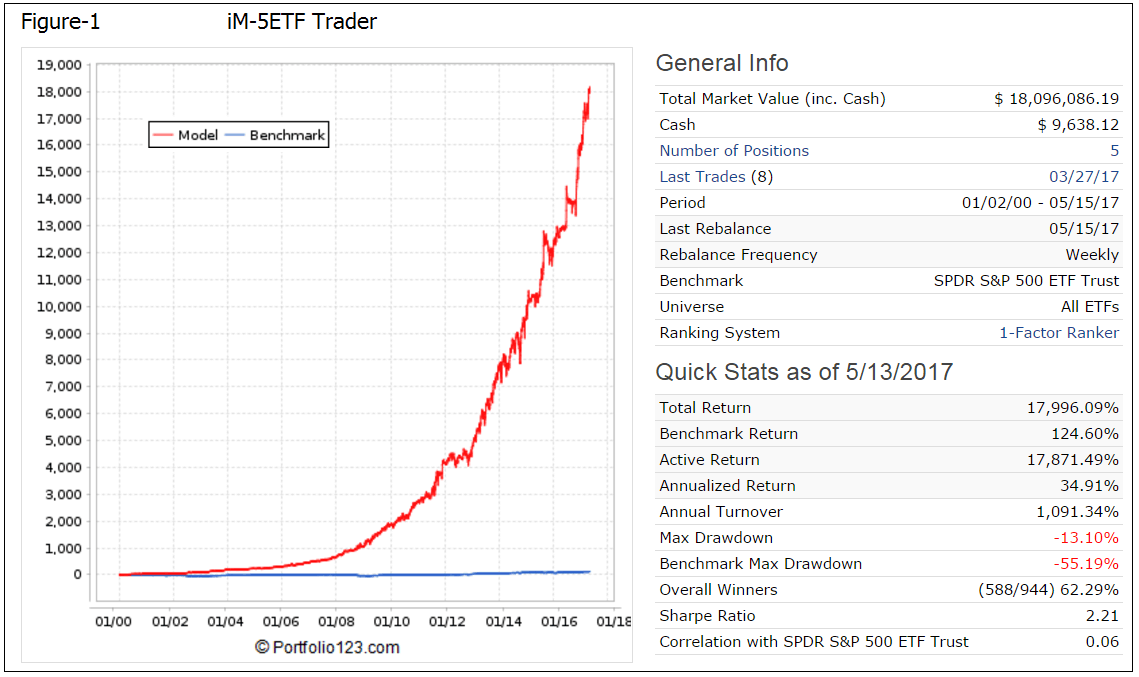
Performance from Jan-2000 to May-2017 is shown in Figure-1. The model showed an annualized return 34.9% with a -13.1% maximum drawdown.
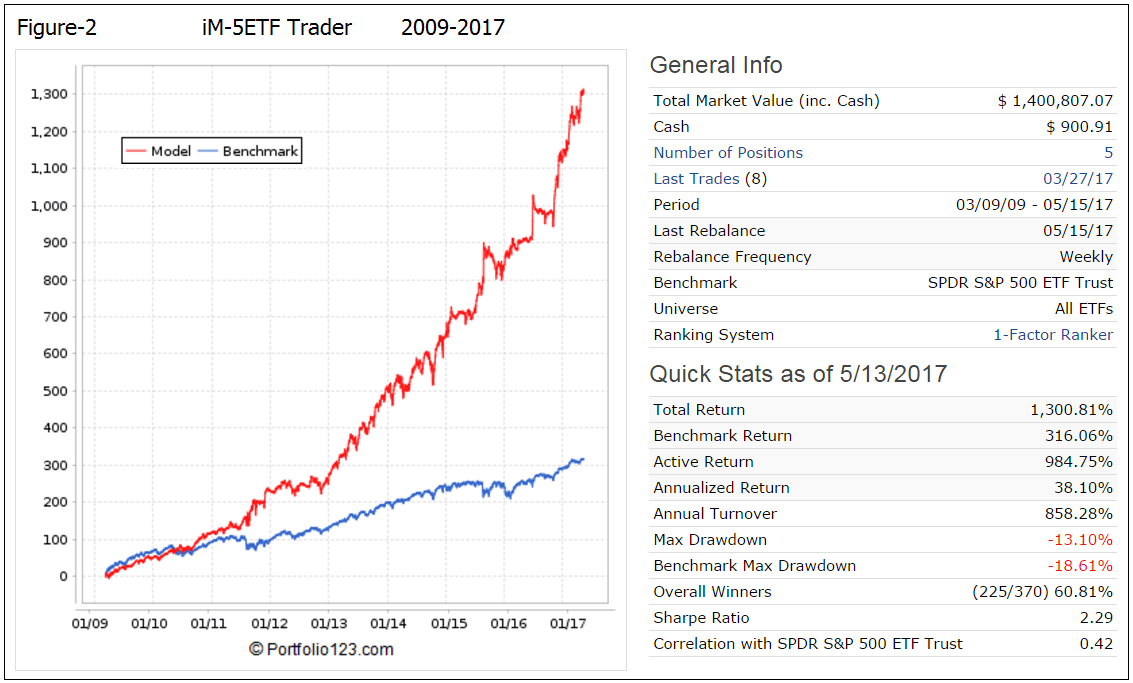
Performance 2009-2017
The simulated performance from Mar-9-2009 to May-2017 is shown in Figure-2. The start date for this period is the date when the S&P 500 was at its lowest level during the financial crisis recession. For the approximately 8-year backtest period the simulated annualized return was 38.1% with a maximum drawdown of -13.1%. The model significantly out-performed with lower drawdown the SPDR S&P 500 ETF (SPY) over this up-market period.
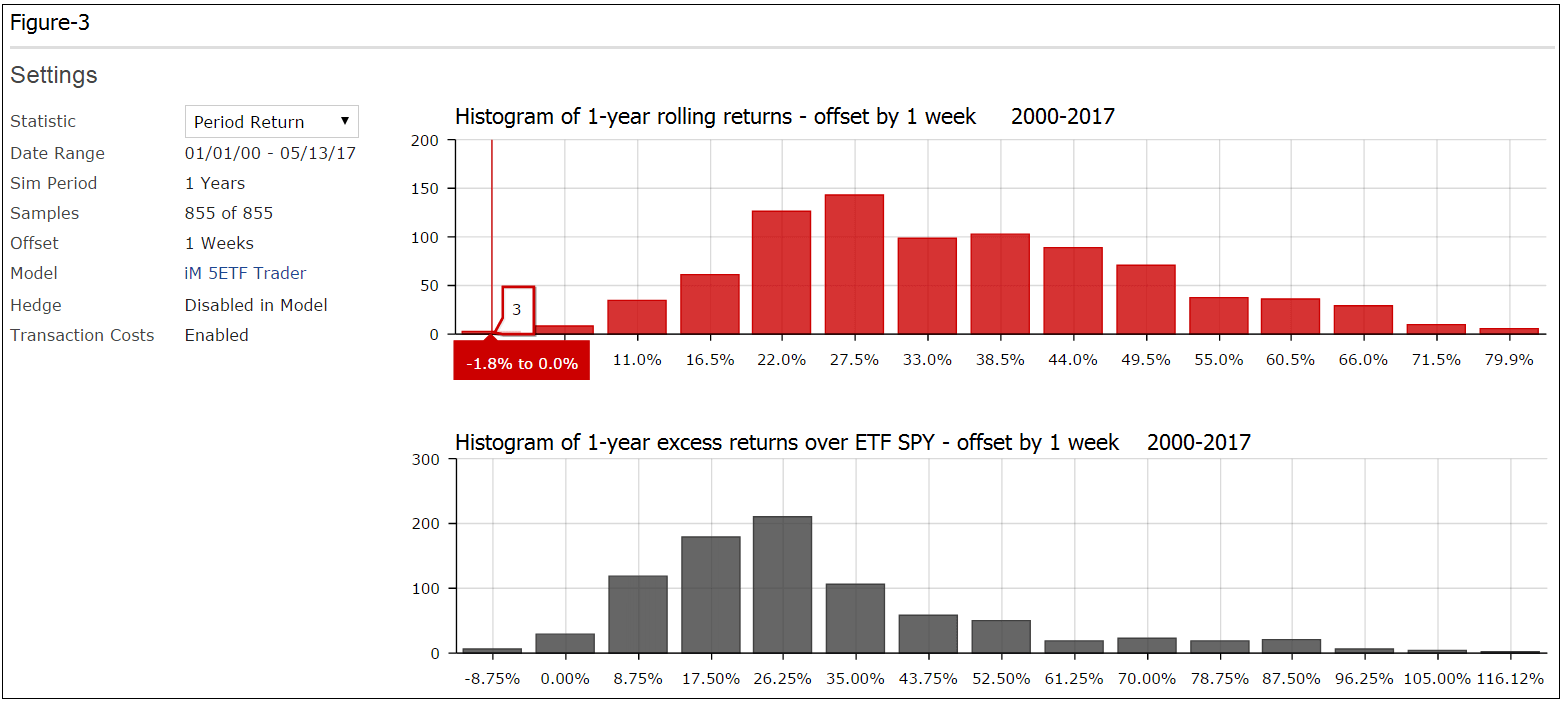
Performance Histogram 2000-2017
Rolling 1-year returns with a 1 week offset are shown in Figure-3. There were 3 out of 855 samples with a small negative 1-year return of about -1.8% to 0.0%, with trading costs included.
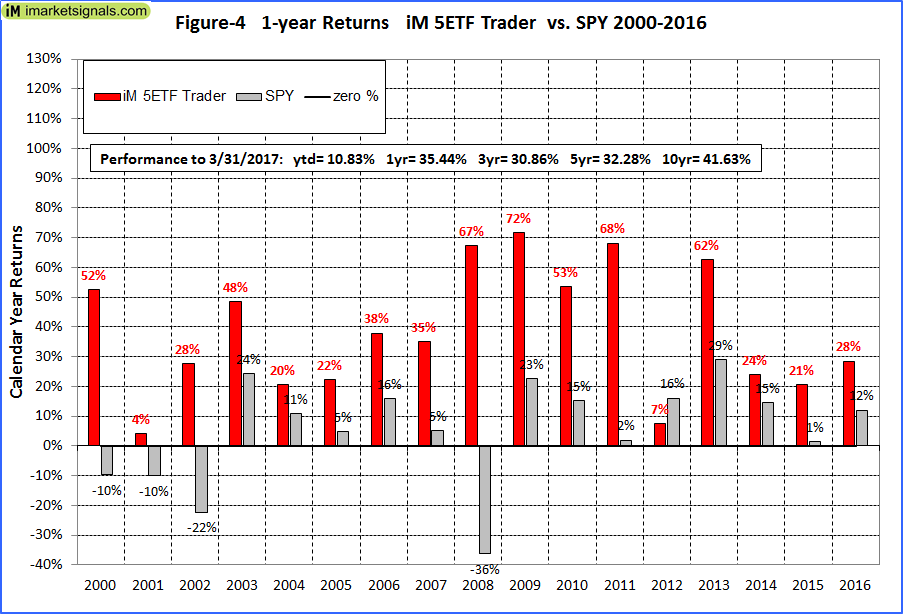
Calendar year performance
Calendar year returns are shown in Figure-4. There was never a year when the model had a negative return.
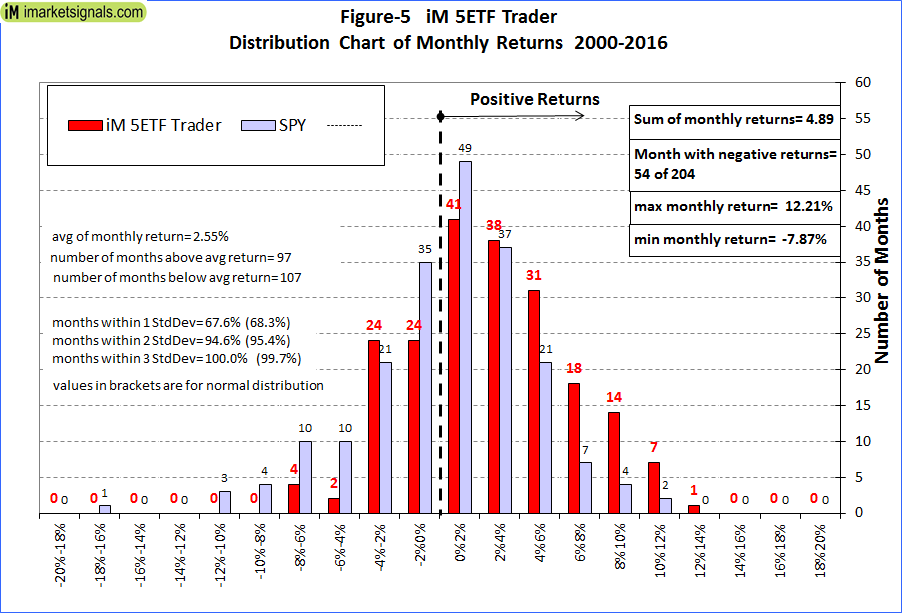
Distribution of monthly returns
Monthly return distribution is shown in Figure-5. There were only 54 negative monthly returns out of 204, versus 84 for SPY. Also, all monthly returns are within three standard deviations away from the mean, indicating that performance is not due to a few outliers with extreme returns.
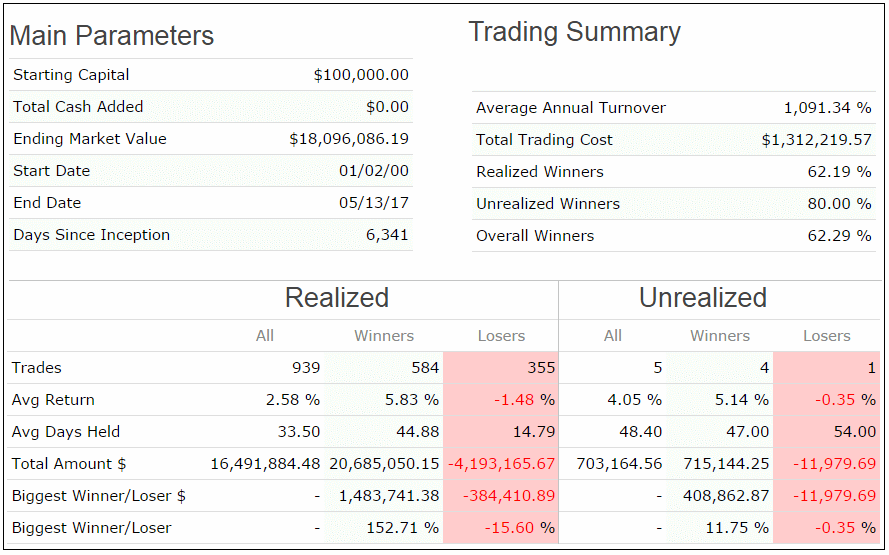
Trading Statistics
This is a trading model with an average annual turnover of about 1,090% (11 x). The average holding period of a position was 33 days, 62% of all trades were winners, and the biggest loss of a trade was -15.6%, all as shown in the table below.
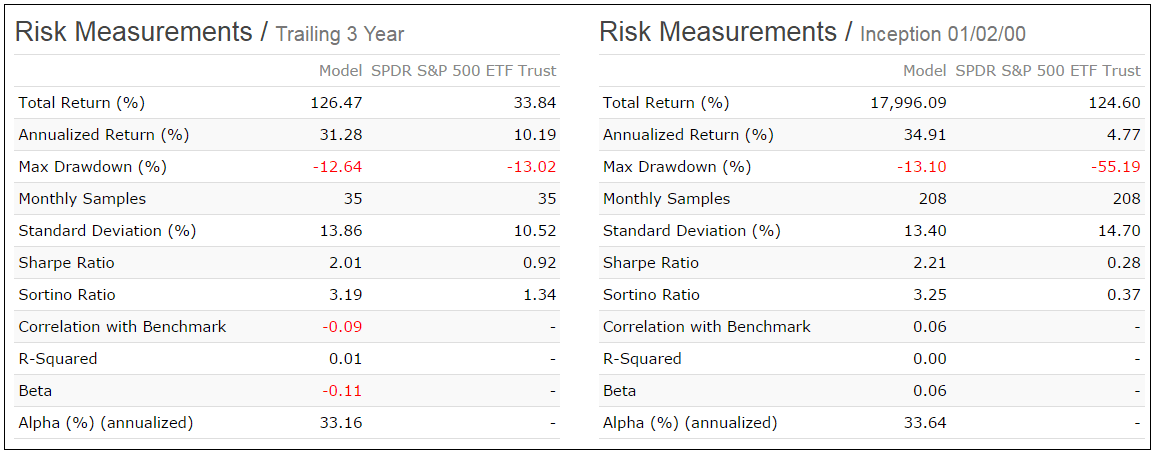
Risk Measurements
Risk measurements are from Portfolio 123.
Portfolio size and trading costs
Slippage including brokerage fees 0.1% of trade amounts was assumed in the backtest. Slippage is related to trade size, average volume traded, trade duration, daily volatility and shares outstanding. The slippage formula can be found in this article, and the calculation for the estimates of daily volatility is located here.
As portfolio size increases the slippage also increases. Since this model trades in many liquid ETFs slippage should not exceed the assumed value until the total portfolio size becomes very large.
Following the model
This model could be of interest to investors willing to accept a fair amount of trading activity. See also “Best Practices” for ETF Trading.
Note, that this is a trading model with 80% of all trades having a holding period of three weeks or less. There were 54 trades per year on average, and the maximum was 127 trades in 2015.
|
Holding |
Percent |
Number of trades |
|
7-21 days |
80.3% |
752 |
|
22-42 days |
7.4% |
69 |
|
43-92 days |
6.6% |
62 |
|
93-183 days |
2.5% |
23 |
|
184-240 days |
0.6% |
6 |
|
241-365 days |
0.7% |
7 |
|
More than a year |
1.8% |
17 |
On iMarketSignals we will report the performance of this model, with weekly trading signals normally provided on Sundays to Gold level members.
On 5/15/2017 the model held: DDM, QLD, SSO, UWM and VOE.
Disclaimer
Note: All performance results are hypothetical and the result of backtesting over the period 2000 to 2017. Since performance is greatly dependent on market-timing rules, the future out-of-sample performance may be significantly less if those rules are not as effective as they were during the backtest period. No claim is made about future performance.
Anton and Georg
Good one! Are the 5 ETF’s equal weighted at all times??
Thanks
Vman
Yes, all equal weight. We will publish signals from May-21 onward.
Please provide the return % and the drawdown % based on a monthly rebalance vs the weekly rebalance?
Thanks, Bud
Yes, I also would like to know how a monthly rebalance compares to this model’s weekly rebalance. Is it possible to provide some summary numbers to compare?
This is a trading model which needs to be weekly rebalanced.
4-week rebalancing:
Period 01/02/99 – 10/19/17
Last Reconstituted (Every 4 Weeks) 10/16/17
Last Rebalanced (Every 4 Weeks) 10/16/17
Benchmark S&P 500 (SPY)
Quick Stats as of 10/19/2017
Total Return 2,840.04%
Benchmark Return 191.90%
Active Return 2,648.14%
Annualized Return 19.71%
Annual Turnover 351.06%
Max Drawdown -36.39%
Benchmark Max Drawdown -55.19%
Overall Winners (227/335) 67.76%
Sharpe Ratio 1.06
Hello,
regarding ETF best practices, do you generally advocate inputing transactions for execution at open of business on monday, or making trades later on monday morning?
thanks
Vanguard’s ETF best practices advises never to trade in the first and last half hour of the day.
Our models assume trading on the first trading day of the week, and the 5ETF Trader’s simulated returns are calculated from the closing prices assuming slippage of 0.1%.
Georg and Anton,
Can you elaborate a bit more on the ranking system ? Am I correct in understanding that it is based on mean reversion rather than momentum?
It would be very helpful if you would construct a correlation table of the newer models you have developed, or possibly all the models in the performance table. I imagine there are quite a few of us trading multiple models with no real understanding of how they are potentially correlated.
Thanks,
Jon
The ranking system is based on mean reversion, not on momentum. That is why the model trades frequently.
We will soon publish a correlation table for all 12 ETF models for which trades are reported individually, or as part of a combo.
Georg,
Seems like another great system. Trying to understand the system. For the equity portion of the model it seems like the model would have a propensity to select a leveraged equity ETF making it extremely leveraged the majority of the time. Model currently 1.8 leveraged. Is this true or are there rules to ratchet down leverage with equity standard long choices?
The model selects the highest ranked ETFs.
EquityETFs or LevEquETFs during up-markets. It would appear that the LevEquETFs seem to be currently the highest ranked. There are no rules to ratchet down leverage with equity standard long choices, unless the ranking system selects them.
Georg,
Can you explain why the ranking system would prioritize a leveraged ETF over it’s underlying ETF? It must be something other than % movement away from the mean that is being utilized in this calculation as leveraged will always move further than their underlying. What am I missing?
It is the percentage change which determines the rank, not the absolute difference. As a result the leveraged ETFs should typically be higher ranked.
Georg, Will SPEPCY inconsistencies affect timing of this model?
We use mainly the six-component composite market timer to determine up- and downmarket periods. SPEPCY has only a minor influence, so we do not expect any future inconsistencies of this indicator to affect this model.
Georg –
Another great system. Thanks for all you do for us Gold investors.
During 2008, did the system hold SDS, IEF, etc. Is TLT NOT one of the ETFs the system can invest in?
Appreciate any other insights into the inner working of the system you can provide in context of my question above.
Adding TLT to the list of fixed income ETFs does not meaningful improve returns for this model. The simulation shows a marginal increase of 0.42% annualized return with TLT included, from 34.92% to 35.34%.
Georg –
What would CAGR & Max. drawdown for 2000-2017 look like for portfolios comprising of:
50% invested in Combo5 & 50% invested in iM-5 ETF Trader
Also
50% invested in Bestoga3 & 50% invested in iM-5 ETF Trader
50% invested in Combo5 & 50% invested in iM-5 ETF Trader:
Quick Stats as of 6/15/2017
Total Return 8,268.07%
Benchmark Return 129.10%
Active Return 8,138.97%
Annualized Return 28.87%
Max Drawdown -10.34%
Benchmark Max Drawdown -55.19%
Sharpe Ratio 2.40
50% invested in Bestoga3 & 50% invested in iM-5 ETF Trader:
Quick Stats as of 6/15/2017
Total Return 9,511.80%
Benchmark Return 129.10%
Active Return 9,382.70%
Annualized Return 29.89%
Max Drawdown -11.89%
Benchmark Max Drawdown -55.19%
Sharpe Ratio 2.19
Hey guys,
Great stuff. Curious, did you model using leveraged Gold when the signals point to max Gold exposure?
Tom C
Tom, please see ETF selection list in the model description. The long leveraged gold ETFs are not old enough to be included in the backtest.
Can you attach a history of signals over the backtest period?
Tom C
Symbol Open Close Pct
IEF 01/3/00 01/10/00 0.10%
IEI 01/3/00 01/10/00 0.00%
BND 01/3/00 01/10/00 -0.10%
BNDX 01/3/00 01/10/00 -0.10%
SDS 01/3/00 01/10/00 -1.20%
UWM 01/10/00 01/18/00 4.20%
QQQ 01/10/00 01/18/00 1.70%
IWV 01/10/00 01/18/00 0.10%
IWB 01/10/00 01/18/00 -0.10%
SSO 01/10/00 01/18/00 -0.70%
SDS 01/18/00 01/24/00 7.40%
IEF 01/18/00 01/31/00 0.40%
VMBS 01/18/00 01/24/00 0.30%
LQD 01/18/00 01/24/00 0.10%
BND 01/18/00 01/31/00 -0.10%
SSO 01/24/00 02/7/00 2.70%
VIG 01/24/00 01/31/00 -0.80%
RSP 01/24/00 01/31/00 -1.30%
UWM 01/31/00 02/7/00 14.60%
QQQ 01/31/00 02/7/00 9.10%
IWB 01/31/00 02/7/00 2.20%
SPY 01/31/00 02/7/00 1.80%
SDS 02/7/00 02/14/00 4.50%
VMBS 02/7/00 02/14/00 0.40%
SHY 02/7/00 02/14/00 0.10%
VNQ 02/7/00 02/14/00 -1.80%
VIG 02/7/00 02/22/00 -4.80%
SPY 02/14/00 03/6/00 0.00%
SSO 02/14/00 03/6/00 -0.20%
RSP 02/14/00 02/22/00 -1.40%
USMV 02/14/00 03/6/00 -1.90%
IWV 02/22/00 02/28/00 0.40%
IWB 02/22/00 02/28/00 0.10%
RSP 02/28/00 03/6/00 1.90%
VIG 02/28/00 03/6/00 -0.70%
SDS 03/6/00 03/13/00 0.50%
IEF 03/6/00 03/13/00 0.20%
IEI 03/6/00 03/13/00 0.10%
CIU 03/6/00 03/13/00 0.00%
BND 03/6/00 03/13/00 -0.10%
SSO 03/13/00 03/20/00 10.20%
VIG 03/13/00 03/20/00 6.60%
USMV 03/13/00 03/20/00 6.50%
RSP 03/13/00 03/20/00 6.00%
LQD 03/13/00 03/20/00 1.10%
QQQ 03/20/00 03/27/00 9.20%
EMB 03/20/00 03/27/00 0.60%
VWOB 03/20/00 03/27/00 0.60%
SDS 03/20/00 04/3/00 -6.00%
UWM 03/20/00 04/10/00 -10.20%
IEI 03/27/00 04/3/00 0.80%
BND 03/27/00 04/3/00 0.80%
VMBS 03/27/00 04/3/00 0.50%
IWV 04/3/00 04/10/00 -0.30%
SPY 04/3/00 04/10/00 -0.50%
SSO 04/3/00 04/10/00 -0.50%
QQQ 04/3/00 05/1/00 -5.40%
SDS 04/10/00 04/17/00 13.30%
VIG 04/10/00 04/17/00 -2.10%
EMB 04/10/00 04/17/00 -2.40%
VOE 04/10/00 04/24/00 -4.20%
UWM 04/17/00 05/1/00 26.30%
SSO 04/17/00 05/1/00 9.10%
IWV 04/17/00 04/24/00 1.70%
RSP 04/24/00 05/1/00 1.90%
VIG 04/24/00 05/1/00 0.30%
SDS 05/1/00 05/8/00 5.80%
CIU 05/1/00 05/8/00 -1.10%
IEF 05/1/00 05/8/00 -1.70%
BND 05/1/00 05/8/00 -1.80%
LQD 05/1/00 05/15/00 -2.30%
QQQ 05/8/00 06/5/00 6.00%
SSO 05/8/00 06/5/00 5.20%
EMB 05/8/00 05/22/00 -2.10%
VWOB 05/8/00 05/22/00 -2.10%
UWM 05/15/00 06/5/00 5.70%
VOE 05/22/00 06/5/00 7.00%
IWV 05/22/00 05/30/00 0.90%
IWB 05/30/00 06/5/00 5.30%
SDS 06/5/00 06/12/00 2.80%
CIU 06/5/00 06/12/00 0.10%
BNDX 06/5/00 06/12/00 0.00%
IEI 06/5/00 06/12/00 0.00%
SHY 06/5/00 06/12/00 -0.10%
SSO 06/12/00 06/19/00 5.20%
VOE 06/12/00 06/19/00 3.10%
USMV 06/12/00 06/19/00 1.10%
RSP 06/12/00 07/3/00 -1.20%
VIG 06/12/00 07/10/00 -4.40%
SDS 06/19/00 10/2/00 6.20%
SPY 06/19/00 06/26/00 -1.70%
UWM 06/19/00 06/26/00 -2.80%
SSO 06/26/00 07/3/00 1.60%
QQQ 06/26/00 07/3/00 0.80%
VOE 07/3/00 07/10/00 2.30%
VNQ 07/3/00 07/10/00 2.20%
IWV 07/3/00 07/10/00 0.40%
CIU 07/10/00 10/2/00 2.80%
BNDX 07/10/00 10/9/00 1.80%
SHY 07/10/00 10/9/00 1.70%
BND 07/10/00 10/2/00 1.10%
SPY 10/2/00 10/9/00 -2.90%
QQQ 10/2/00 10/16/00 -6.00%
SSO 10/2/00 10/23/00 -6.20%
UWM 10/9/00 10/23/00 -0.60%
IWV 10/9/00 10/23/00 -0.80%
VOE 10/9/00 10/16/00 -2.10%
SPY 10/16/00 10/23/00 1.50%
IWB 10/16/00 10/23/00 1.00%
VIG 10/23/00 10/30/00 4.80%
VWOB 10/23/00 10/30/00 0.30%
EMB 10/23/00 10/30/00 0.30%
SHY 10/23/00 10/30/00 -0.30%
SDS 10/23/00 10/30/00 -0.80%
UWM 10/30/00 11/6/00 8.50%
QQQ 10/30/00 11/6/00 7.20%
SSO 10/30/00 11/6/00 4.50%
VOE 10/30/00 11/6/00 4.20%
IWV 10/30/00 11/6/00 3.00%
SDS 11/6/00 09/3/02 96.30%
IEF 11/6/00 09/3/02 24.70%
IEI 11/6/00 09/3/02 22.40%
CIU 11/6/00 09/3/02 20.00%
BND 11/6/00 09/3/02 14.20%
UWM 09/3/02 09/9/02 6.70%
SSO 09/3/02 09/9/02 5.50%
IWF 09/3/02 09/9/02 3.30%
SPY 09/3/02 09/9/02 2.50%
QQQ 09/3/02 09/9/02 1.70%
LQD 09/9/02 11/18/02 1.60%
VMBS 09/9/02 10/21/02 0.20%
SHY 09/9/02 10/21/02 -0.30%
IEI 09/9/02 10/21/02 -0.30%
CIU 09/9/02 10/21/02 -1.80%
GLD 10/21/02 07/6/04 25.90%
BND 10/21/02 12/16/02 1.20%
IEF 10/21/02 12/16/02 0.20%
SDS 10/21/02 12/16/02 -4.80%
IAU 11/18/02 07/6/04 23.80%
QQQ 12/16/02 12/23/02 -0.90%
SSO 12/16/02 12/23/02 -3.10%
UWM 12/16/02 12/30/02 -6.40%
SDS 12/23/02 12/30/02 3.70%
VNQ 12/23/02 12/30/02 0.50%
SSO 12/30/02 01/6/03 11.20%
SPY 12/30/02 01/6/03 5.30%
IWV 12/30/02 01/6/03 5.20%
SDS 01/6/03 01/21/03 8.80%
BND 01/6/03 01/21/03 0.60%
IEF 01/6/03 01/21/03 0.60%
QQQ 01/21/03 01/27/03 -2.20%
SSO 01/21/03 02/18/03 -8.00%
UWM 01/21/03 02/18/03 -9.70%
SPY 01/27/03 02/3/03 1.00%
QQQ 02/3/03 02/10/03 -2.10%
RSP 02/10/03 02/18/03 1.10%
SDS 02/18/03 03/3/03 3.30%
VNQ 02/18/03 02/24/03 0.60%
VOE 02/18/03 02/24/03 -1.60%
IEI 02/24/03 03/3/03 0.50%
SHY 02/24/03 03/3/03 -0.10%
SSO 03/3/03 03/17/03 6.40%
UWM 03/3/03 03/17/03 3.10%
VIG 03/3/03 03/10/03 -4.60%
QQQ 03/10/03 03/17/03 10.60%
SDS 03/17/03 03/31/03 2.50%
VIG 03/17/03 03/24/03 0.00%
LQD 03/17/03 03/24/03 -0.70%
IEF 03/24/03 03/31/03 1.10%
BND 03/24/03 03/31/03 1.10%
UWM 03/31/03 05/5/03 25.80%
SSO 03/31/03 05/5/03 18.80%
QQQ 03/31/03 05/5/03 11.70%
IEF 05/5/03 05/12/03 1.80%
VMBS 05/5/03 05/12/03 0.00%
SDS 05/5/03 05/12/03 -4.30%
QQQ 05/12/03 06/16/03 6.90%
IWB 05/12/03 06/16/03 6.70%
USMV 05/12/03 06/16/03 6.20%
VIG 06/16/03 06/23/03 -2.60%
VNQ 06/16/03 06/23/03 -3.10%
UWM 06/16/03 06/23/03 -8.00%
LQD 06/23/03 06/30/03 -1.20%
EMB 06/23/03 06/30/03 -1.30%
VWOB 06/23/03 06/30/03 -1.30%
SSO 06/30/03 07/7/03 6.00%
IWF 06/30/03 07/7/03 3.40%
RSP 06/30/03 07/7/03 2.50%
EMB 07/7/03 07/21/03 0.40%
BNDX 07/7/03 07/14/03 0.30%
LQD 07/7/03 07/14/03 0.30%
SDS 07/14/03 07/21/03 4.80%
VWOB 07/14/03 07/21/03 -0.40%
UWM 07/21/03 07/28/03 7.10%
BND 07/21/03 09/29/03 2.00%
IEF 07/21/03 09/29/03 1.20%
LQD 07/28/03 09/29/03 2.00%
UWM 09/29/03 10/6/03 9.60%
SSO 09/29/03 10/6/03 5.30%
QQQ 09/29/03 10/6/03 3.70%
LQD 10/6/03 10/13/03 -0.10%
IEF 10/6/03 10/27/03 -0.50%
SDS 10/6/03 10/20/03 -2.30%
SHY 10/13/03 10/20/03 -0.50%
BNDX 10/20/03 10/27/03 0.50%
QQQ 10/20/03 10/27/03 -2.60%
UWM 10/27/03 11/3/03 8.60%
SSO 10/27/03 11/3/03 5.30%
VNQ 10/27/03 11/3/03 1.40%
SDS 11/3/03 11/10/03 1.90%
IEF 11/3/03 11/17/03 1.10%
LQD 11/3/03 11/17/03 0.80%
BNDX 11/10/03 11/17/03 1.40%
UWM 11/17/03 12/1/03 10.70%
SSO 11/17/03 12/1/03 4.90%
QQQ 11/17/03 12/1/03 3.30%
IEF 12/1/03 12/8/03 0.90%
IEI 12/1/03 12/8/03 0.60%
SDS 12/1/03 12/8/03 -0.20%
QQQ 12/8/03 12/15/03 -1.50%
VOE 12/8/03 12/15/03 -1.60%
UWM 12/8/03 12/15/03 -3.20%
LQD 12/15/03 12/22/03 0.70%
IEF 12/15/03 12/22/03 0.30%
SDS 12/15/03 02/2/04 -11.20%
UWM 12/22/03 12/29/03 5.20%
SHY 12/22/03 12/29/03 -0.20%
LQD 12/29/03 01/12/04 0.80%
VWOB 12/29/03 01/5/04 0.40%
IEF 01/5/04 01/12/04 2.00%
VIG 01/12/04 01/20/04 1.00%
USMV 01/12/04 01/20/04 0.40%
EMB 01/20/04 01/26/04 -0.40%
VWOB 01/20/04 01/26/04 -0.40%
LQD 01/26/04 02/2/04 -0.60%
IEF 01/26/04 02/2/04 -0.60%
UWM 02/2/04 02/9/04 1.40%
SSO 02/2/04 02/9/04 0.60%
QQQ 02/2/04 02/9/04 0.20%
EMB 02/9/04 02/17/04 0.30%
VWOB 02/9/04 02/17/04 0.30%
SDS 02/9/04 02/23/04 -0.60%
VNQ 02/17/04 02/23/04 -0.60%
QQQ 02/17/04 02/23/04 -2.80%
UWM 02/23/04 03/1/04 8.50%
VOE 02/23/04 03/1/04 3.50%
SSO 02/23/04 03/1/04 2.50%
SDS 03/1/04 03/8/04 1.20%
QQQ 03/1/04 04/5/04 0.90%
IWF 03/1/04 04/5/04 -0.80%
IWV 03/8/04 04/5/04 -0.30%
SDS 04/5/04 05/3/04 5.20%
LQD 04/5/04 05/3/04 -2.30%
IEF 04/5/04 05/3/04 -2.40%
QQQ 05/3/04 05/10/04 -1.40%
UWM 05/3/04 05/24/04 -4.50%
SSO 05/3/04 05/10/04 -5.60%
VWOB 05/10/04 05/17/04 3.50%
EMB 05/10/04 05/17/04 3.50%
QQQ 05/17/04 05/24/04 2.20%
VOE 05/17/04 05/24/04 2.00%
SSO 05/24/04 06/1/04 4.50%
IWF 05/24/04 06/1/04 2.50%
USMV 05/24/04 06/1/04 2.10%
SDS 06/1/04 07/6/04 0.10%
BNDX 06/1/04 07/6/04 0.10%
SHY 06/1/04 06/14/04 -0.80%
LQD 06/14/04 07/6/04 2.10%
RSP 07/6/04 07/19/04 -1.70%
SSO 07/6/04 08/2/04 -1.90%
IWF 07/6/04 07/26/04 -5.00%
QQQ 07/6/04 07/26/04 -5.60%
UWM 07/6/04 08/2/04 -6.90%
IWB 07/19/04 07/26/04 -1.90%
IAU 07/26/04 03/17/08 152.70%
GLD 07/26/04 03/17/08 152.00%
VNQ 07/26/04 08/2/04 3.30%
SDS 08/2/04 08/9/04 7.50%
IEF 08/2/04 08/9/04 1.30%
BND 08/2/04 08/9/04 0.90%
UWM 08/9/04 08/23/04 9.40%
QQQ 08/9/04 08/23/04 3.70%
SSO 08/9/04 08/16/04 2.50%
VNQ 08/16/04 08/23/04 3.30%
BND 08/23/04 08/30/04 0.20%
BNDX 08/23/04 09/7/04 -0.10%
SDS 08/23/04 09/27/04 -1.80%
SHY 08/30/04 09/7/04 -0.50%
QQQ 09/7/04 09/13/04 3.10%
LQD 09/7/04 09/13/04 0.70%
SHY 09/13/04 09/27/04 -0.20%
VNQ 09/13/04 09/27/04 -1.20%
UWM 09/27/04 10/4/04 11.10%
SSO 09/27/04 10/4/04 5.60%
IWF 09/27/04 10/4/04 3.20%
SDS 10/4/04 10/11/04 1.60%
LQD 10/4/04 10/11/04 0.80%
IEF 10/4/04 10/11/04 0.30%
SSO 10/11/04 11/1/04 0.90%
IWF 10/11/04 10/18/04 -0.90%
UWM 10/11/04 10/25/04 -2.40%
VOE 10/18/04 10/25/04 -0.10%
USMV 10/25/04 11/1/04 2.80%
VIG 10/25/04 11/1/04 2.20%
IEF 11/1/04 11/22/04 -0.70%
IEI 11/1/04 11/22/04 -0.80%
SDS 11/1/04 11/22/04 -8.20%
UWM 11/22/04 11/29/04 4.00%
VNQ 11/22/04 11/29/04 1.50%
SSO 11/22/04 11/29/04 0.00%
LQD 11/29/04 12/13/04 1.10%
IEF 11/29/04 12/13/04 1.00%
IEI 11/29/04 12/13/04 0.70%
VIG 12/13/04 12/20/04 0.10%
UWM 12/13/04 12/20/04 -0.20%
SSO 12/13/04 12/20/04 -0.90%
SDS 12/20/04 01/24/05 4.80%
VMBS 12/20/04 01/24/05 0.60%
IEF 12/20/04 01/24/05 0.10%
QQQ 01/24/05 02/7/05 2.90%
SSO 01/24/05 01/31/05 2.80%
IWF 01/24/05 01/31/05 1.50%
VNQ 01/31/05 02/7/05 3.00%
SDS 01/31/05 02/22/05 -0.90%
SHY 02/7/05 02/14/05 -0.20%
IEI 02/7/05 02/14/05 -0.20%
UWM 02/14/05 02/28/05 -0.40%
BNDX 02/14/05 02/22/05 -0.90%
EMB 02/22/05 02/28/05 -0.70%
IEF 02/22/05 02/28/05 -0.80%
VNQ 02/28/05 03/7/05 3.10%
BNDX 02/28/05 03/7/05 0.00%
SDS 02/28/05 03/14/05 -0.80%
EMB 03/7/05 03/14/05 -1.90%
VWOB 03/7/05 03/14/05 -1.90%
VNQ 03/14/05 03/21/05 -1.50%
UWM 03/14/05 03/21/05 -3.00%
SSO 03/14/05 04/4/05 -5.30%
IWF 03/21/05 03/28/05 -0.60%
QQQ 03/21/05 03/28/05 -0.90%
VNQ 03/28/05 04/4/05 0.50%
UWM 03/28/05 04/11/05 -2.80%
SDS 04/4/05 04/18/05 4.90%
IWF 04/4/05 04/11/05 0.60%
VWOB 04/11/05 04/18/05 0.70%
EMB 04/11/05 04/18/05 0.70%
UWM 04/18/05 07/25/05 29.40%
SSO 04/18/05 07/25/05 14.20%
QQQ 04/18/05 07/25/05 12.80%
BND 07/25/05 08/1/05 -0.20%
IEI 07/25/05 08/8/05 -0.80%
SDS 07/25/05 08/1/05 -1.30%
BNDX 08/1/05 08/8/05 -0.70%
IEF 08/1/05 08/8/05 -0.90%
UWM 08/8/05 10/3/05 2.50%
VNQ 08/8/05 08/22/05 2.50%
VOE 08/8/05 08/15/05 1.00%
SDS 08/15/05 08/22/05 1.70%
SSO 08/22/05 09/19/05 1.20%
VOE 08/22/05 09/19/05 0.90%
EMB 09/19/05 09/26/05 -0.60%
VWOB 09/19/05 09/26/05 -0.60%
VNQ 09/26/05 10/3/05 1.70%
SSO 09/26/05 10/3/05 1.60%
SDS 10/3/05 10/10/05 6.40%
IEF 10/3/05 10/10/05 0.10%
BNDX 10/3/05 10/10/05 0.00%
SSO 10/10/05 10/31/05 2.80%
UWM 10/10/05 10/24/05 2.20%
VNQ 10/10/05 10/17/05 0.40%
VOE 10/17/05 10/24/05 1.40%
IWB 10/24/05 10/31/05 0.10%
SPY 10/24/05 10/31/05 -0.10%
VWOB 10/31/05 11/7/05 -0.70%
EMB 10/31/05 11/7/05 -0.70%
SDS 10/31/05 12/5/05 -8.80%
VNQ 11/7/05 11/14/05 3.40%
BNDX 11/7/05 11/21/05 0.80%
SHY 11/14/05 12/5/05 -0.20%
BND 11/21/05 11/28/05 -0.10%
CIU 11/28/05 12/5/05 -0.80%
VNQ 12/5/05 12/12/05 0.00%
IEF 12/5/05 12/12/05 0.00%
BND 12/5/05 12/12/05 -0.20%
SSO 12/12/05 12/19/05 -0.40%
QQQ 12/12/05 12/19/05 -2.50%
UWM 12/12/05 12/27/05 -4.00%
VOE 12/19/05 12/27/05 0.50%
SDS 12/19/05 01/3/06 -1.70%
QQQ 12/27/05 01/30/06 2.60%
VIG 12/27/05 01/30/06 1.10%
UWM 01/3/06 01/30/06 13.40%
SDS 01/30/06 02/6/06 2.90%
BNDX 01/30/06 02/6/06 -0.20%
IEF 01/30/06 02/6/06 -0.50%
UWM 02/6/06 04/24/06 9.30%
SSO 02/6/06 04/10/06 4.40%
QQQ 02/6/06 04/10/06 3.30%
VNQ 04/10/06 04/24/06 1.20%
BNDX 04/10/06 04/17/06 -0.50%
SSO 04/17/06 04/24/06 3.30%
SDS 04/24/06 05/1/06 0.20%
BND 04/24/06 05/1/06 -0.60%
QQQ 04/24/06 05/1/06 -1.40%
UWM 05/1/06 05/8/06 5.10%
VNQ 05/1/06 05/8/06 2.10%
VOE 05/1/06 05/8/06 1.90%
SDS 05/8/06 05/15/06 4.30%
VWOB 05/8/06 05/15/06 -0.50%
IEF 05/8/06 05/15/06 -0.50%
QQQ 05/15/06 05/22/06 -3.20%
SSO 05/15/06 05/30/06 -5.60%
UWM 05/15/06 05/30/06 -7.50%
VOE 05/22/06 05/30/06 -0.60%
SDS 05/30/06 06/12/06 3.40%
VWOB 05/30/06 06/5/06 0.20%
EMB 05/30/06 06/5/06 0.20%
BNDX 06/5/06 06/12/06 0.20%
SHY 06/5/06 06/12/06 -0.10%
UWM 06/12/06 07/3/06 13.50%
SSO 06/12/06 06/19/06 0.30%
VOE 06/12/06 06/19/06 -0.20%
VNQ 06/19/06 07/3/06 4.00%
EMB 06/19/06 06/26/06 -0.90%
SSO 06/26/06 07/3/06 4.40%
SDS 07/3/06 07/10/06 1.80%
BND 07/3/06 07/10/06 0.10%
BNDX 07/3/06 07/10/06 -0.10%
QQQ 07/10/06 07/31/06 -0.90%
UWM 07/10/06 07/31/06 -2.90%
IWF 07/10/06 07/17/06 -3.10%
SSO 07/17/06 07/24/06 3.70%
VOE 07/24/06 07/31/06 1.80%
SDS 07/31/06 08/14/06 1.50%
BNDX 07/31/06 08/7/06 0.20%
SHY 07/31/06 08/7/06 -0.40%
QQQ 08/7/06 08/14/06 0.00%
VIG 08/7/06 08/14/06 -0.60%
UWM 08/14/06 08/21/06 6.60%
VOE 08/14/06 08/21/06 2.40%
VNQ 08/14/06 08/21/06 2.00%
BNDX 08/21/06 08/28/06 0.50%
SHY 08/21/06 08/28/06 -0.10%
SDS 08/21/06 08/28/06 -0.40%
UWM 08/28/06 09/5/06 5.70%
QQQ 08/28/06 09/5/06 2.00%
VOE 08/28/06 09/5/06 1.10%
SDS 09/5/06 09/11/06 2.10%
BND 09/5/06 09/11/06 -0.10%
SHY 09/5/06 09/11/06 -0.20%
UWM 09/11/06 09/18/06 5.80%
SSO 09/11/06 09/18/06 3.10%
VOE 09/11/06 09/18/06 1.60%
IEI 09/18/06 09/25/06 0.90%
VMBS 09/18/06 09/25/06 0.80%
SDS 09/18/06 09/25/06 -0.60%
UWM 09/25/06 01/3/07 15.40%
VOE 09/25/06 01/3/07 8.50%
SSO 09/25/06 01/3/07 7.70%
QLD 01/3/07 01/16/07 9.40%
EMB 01/3/07 01/8/07 0.60%
VWOB 01/3/07 01/8/07 0.60%
UWM 01/8/07 01/16/07 3.40%
SSO 01/8/07 01/16/07 2.40%
SDS 01/16/07 01/22/07 0.90%
VWOB 01/16/07 01/22/07 0.00%
EMB 01/16/07 01/22/07 0.00%
UWM 01/22/07 02/5/07 5.10%
QLD 01/22/07 02/5/07 1.60%
QQQ 01/22/07 01/29/07 -0.40%
DDM 01/29/07 02/5/07 2.50%
SDS 02/5/07 02/12/07 1.60%
SHY 02/5/07 02/12/07 -0.10%
BNDX 02/5/07 02/12/07 -0.20%
QLD 02/12/07 02/20/07 5.90%
DDM 02/12/07 02/20/07 3.40%
SSO 02/12/07 02/20/07 3.30%
SDS 02/20/07 02/26/07 1.20%
SHY 02/20/07 02/26/07 0.00%
VNQ 02/20/07 04/30/07 -8.10%
DDM 02/26/07 04/30/07 5.20%
USMV 02/26/07 04/30/07 1.50%
VMBS 04/30/07 05/7/07 -0.10%
BND 04/30/07 05/7/07 -0.30%
SDS 04/30/07 05/7/07 -3.40%
VNQ 05/7/07 05/14/07 -0.40%
QQQ 05/7/07 05/14/07 -0.60%
QLD 05/7/07 05/14/07 -1.20%
UWM 05/14/07 05/29/07 3.40%
IWF 05/14/07 05/21/07 0.90%
IEF 05/14/07 05/21/07 -0.70%
VNQ 05/21/07 05/29/07 2.90%
SDS 05/21/07 05/29/07 0.60%
QLD 05/29/07 06/4/07 3.10%
SSO 05/29/07 06/4/07 2.10%
DDM 05/29/07 06/4/07 1.80%
SDS 06/4/07 06/11/07 4.20%
EMB 06/4/07 06/11/07 -2.10%
VWOB 06/4/07 06/11/07 -2.10%
UWM 06/11/07 06/18/07 2.80%
SSO 06/11/07 06/18/07 2.40%
VNQ 06/11/07 07/9/07 -1.90%
SDS 06/18/07 06/25/07 3.80%
BNDX 06/18/07 06/25/07 0.10%
UWM 06/25/07 07/2/07 3.30%
DDM 06/25/07 07/2/07 2.20%
SSO 07/2/07 07/9/07 1.20%
VOE 07/2/07 07/9/07 0.70%
SDS 07/9/07 07/30/07 7.70%
EMB 07/9/07 07/30/07 -0.10%
VWOB 07/9/07 07/30/07 -0.10%
VNQ 07/30/07 08/6/07 1.90%
UWM 07/30/07 08/13/07 -1.50%
SSO 07/30/07 08/13/07 -3.70%
VOE 08/6/07 08/13/07 -0.50%
IEF 08/13/07 08/20/07 1.00%
QLD 08/13/07 08/27/07 0.40%
SDS 08/13/07 08/20/07 0.30%
DBP 08/20/07 03/17/08 49.10%
DDM 08/20/07 08/27/07 3.10%
SHY 08/27/07 09/4/07 -0.40%
SDS 08/27/07 09/4/07 -3.40%
SSO 09/4/07 09/10/07 -5.00%
UWM 09/4/07 09/17/07 -6.30%
DDM 09/10/07 09/17/07 4.00%
SDS 09/17/07 01/28/08 16.10%
IEF 09/17/07 10/1/07 -1.00%
UWM 10/1/07 10/8/07 3.30%
IEF 10/8/07 01/28/08 7.40%
QLD 01/28/08 02/4/08 2.10%
QQQ 01/28/08 02/4/08 1.20%
SDS 02/4/08 02/11/08 5.50%
CSJ 02/4/08 02/11/08 0.00%
SSO 02/11/08 02/19/08 2.90%
QLD 02/11/08 02/19/08 -1.90%
VMBS 02/19/08 02/25/08 -0.60%
SDS 02/19/08 02/25/08 -2.90%
UWM 02/25/08 03/3/08 -7.50%
QLD 02/25/08 03/10/08 -12.30%
SSO 03/3/08 03/24/08 2.60%
UWM 03/10/08 03/17/08 1.20%
IWV 03/17/08 03/24/08 5.20%
IWB 03/17/08 03/24/08 4.90%
USMV 03/17/08 03/24/08 4.60%
LQD 03/17/08 03/24/08 0.40%
SDS 03/24/08 03/31/08 4.00%
CSJ 03/24/08 03/31/08 0.30%
IWF 03/24/08 03/31/08 -1.90%
QLD 03/24/08 03/31/08 -4.50%
UWM 03/24/08 03/31/08 -5.30%
DDM 03/31/08 04/7/08 5.50%
VNQ 03/31/08 04/7/08 4.70%
VOE 03/31/08 04/7/08 4.50%
USMV 03/31/08 04/7/08 3.20%
IEF 03/31/08 04/14/08 -1.20%
SDS 04/7/08 04/14/08 6.10%
IEI 04/7/08 04/14/08 0.30%
BNDX 04/7/08 04/14/08 0.30%
SHY 04/7/08 04/14/08 0.10%
QLD 04/14/08 04/21/08 13.30%
UWM 04/14/08 04/21/08 9.30%
SSO 04/14/08 04/21/08 8.60%
DDM 04/14/08 04/21/08 7.70%
VNQ 04/14/08 04/21/08 3.90%
SDS 04/21/08 01/20/09 49.80%
IEF 04/21/08 01/20/09 9.10%
BNDX 04/21/08 01/20/09 7.60%
IEI 04/21/08 01/20/09 6.90%
BND 04/21/08 01/20/09 1.10%
DDM 01/20/09 02/9/09 7.60%
QLD 01/20/09 01/26/09 7.20%
UWM 01/20/09 02/2/09 5.20%
SSO 01/20/09 02/2/09 4.50%
RSP 01/20/09 01/26/09 3.80%
VWOB 01/26/09 02/2/09 0.10%
EMB 01/26/09 02/2/09 -0.40%
RSP 02/2/09 02/9/09 6.20%
VOE 02/2/09 02/9/09 6.00%
VNQ 02/2/09 02/9/09 2.40%
IEF 02/2/09 03/23/09 1.20%
VWOB 02/9/09 03/23/09 3.00%
EMB 02/9/09 03/23/09 2.40%
SDS 02/9/09 03/23/09 2.10%
LQD 02/9/09 03/23/09 -4.70%
VNQ 03/23/09 06/1/09 27.90%
DDM 03/23/09 06/1/09 24.70%
IWV 03/23/09 06/1/09 15.20%
SPY 03/23/09 06/1/09 15.00%
VIG 03/23/09 06/1/09 12.40%
SDS 06/1/09 06/22/09 10.40%
BNDX 06/1/09 06/15/09 0.10%
IEF 06/1/09 06/15/09 -0.40%
VWOB 06/1/09 06/15/09 -0.60%
EMB 06/1/09 06/15/09 -0.70%
DBP 06/15/09 08/8/11 95.00%
IAU 06/15/09 08/8/11 83.20%
GLD 06/15/09 08/8/11 83.10%
VNQ 06/15/09 06/29/09 -3.70%
DDM 06/22/09 07/6/09 -1.00%
UWM 06/29/09 07/6/09 -6.40%
QLD 07/6/09 07/13/09 0.40%
SSO 07/6/09 07/13/09 0.30%
UWM 07/13/09 07/20/09 13.70%
VNQ 07/13/09 07/20/09 6.80%
IEF 07/20/09 07/27/09 -0.90%
SDS 07/20/09 08/17/09 -6.90%
BNDX 07/27/09 08/3/09 0.20%
SHY 08/3/09 08/10/09 -0.30%
IEF 08/10/09 08/17/09 2.00%
UWM 08/17/09 08/24/09 12.00%
VNQ 08/17/09 08/24/09 6.40%
CSJ 08/24/09 08/31/09 0.10%
SDS 08/24/09 09/8/09 -0.50%
UWM 08/31/09 09/14/09 9.60%
VNQ 09/8/09 09/14/09 6.10%
CSJ 09/14/09 09/21/09 -0.20%
SDS 09/14/09 09/28/09 -3.20%
IEF 09/21/09 09/28/09 1.10%
UWM 09/28/09 10/12/09 0.10%
VNQ 09/28/09 10/12/09 -3.10%
SDS 10/12/09 10/26/09 1.10%
CIU 10/12/09 10/19/09 -0.20%
VNQ 10/19/09 10/26/09 -2.20%
SSO 10/26/09 11/9/09 4.50%
UWM 10/26/09 11/9/09 -1.80%
BNDX 11/9/09 11/16/09 0.60%
SDS 11/9/09 11/23/09 -2.90%
SHY 11/16/09 11/23/09 -0.10%
QLD 11/23/09 12/28/09 9.50%
QQQ 11/23/09 12/28/09 4.50%
IEF 12/28/09 01/4/10 -0.20%
SDS 12/28/09 01/4/10 -1.30%
VNQ 01/4/10 01/19/10 1.90%
UWM 01/4/10 01/11/10 0.80%
SDS 01/11/10 01/25/10 8.60%
QLD 01/19/10 05/17/10 0.50%
DDM 01/25/10 05/17/10 8.90%
SDS 05/17/10 05/24/10 11.00%
IEF 05/17/10 05/24/10 1.60%
QLD 05/24/10 06/1/10 1.90%
UWM 05/24/10 06/1/10 -0.40%
SDS 06/1/10 06/7/10 3.10%
DDM 06/1/10 08/30/10 -0.50%
UWM 06/7/10 08/30/10 -6.70%
QLD 08/30/10 06/6/11 60.30%
QQQ 08/30/10 05/16/11 31.40%
DDM 05/16/11 05/23/11 -2.60%
UWM 05/23/11 05/31/11 8.30%
DDM 05/31/11 06/13/11 -9.40%
UWM 06/6/11 06/20/11 -1.70%
QLD 06/13/11 06/27/11 2.50%
QQQ 06/20/11 06/27/11 2.00%
SSO 06/27/11 07/5/11 9.20%
DDM 06/27/11 07/5/11 8.80%
SDS 07/5/11 07/18/11 4.40%
IEF 07/5/11 07/11/11 1.40%
CSJ 07/11/11 07/18/11 -0.30%
SSO 07/18/11 07/25/11 4.80%
UWM 07/18/11 07/25/11 3.50%
SDS 07/25/11 08/1/11 7.70%
IEF 07/25/11 08/1/11 1.60%
DDM 08/1/11 08/29/11 -9.90%
UWM 08/1/11 08/29/11 -15.60%
VNQ 08/8/11 08/15/11 16.00%
SSO 08/8/11 08/29/11 15.10%
QLD 08/8/11 08/29/11 14.50%
SPY 08/15/11 08/22/11 -6.70%
QQQ 08/22/11 08/29/11 8.50%
SDS 08/29/11 09/12/11 7.00%
IEF 08/29/11 09/6/11 1.80%
LQD 08/29/11 09/6/11 1.50%
BND 08/29/11 09/6/11 0.60%
VMBS 08/29/11 09/6/11 0.30%
SSO 09/6/11 09/19/11 6.40%
UWM 09/6/11 09/19/11 5.10%
DDM 09/6/11 09/19/11 4.50%
IWB 09/6/11 09/12/11 -0.40%
QLD 09/12/11 09/19/11 10.50%
RSP 09/12/11 09/19/11 3.00%
SDS 09/19/11 09/26/11 6.20%
IEF 09/19/11 09/26/11 0.00%
BNDX 09/19/11 09/26/11 -0.10%
LQD 09/19/11 09/26/11 -0.50%
EMB 09/19/11 09/26/11 -5.40%
UWM 09/26/11 10/10/11 5.40%
QLD 09/26/11 10/10/11 3.90%
VNQ 09/26/11 10/17/11 -1.00%
DDM 09/26/11 10/3/11 -7.20%
SSO 09/26/11 10/3/11 -10.90%
QQQ 10/3/11 10/10/11 9.20%
IWF 10/3/11 10/10/11 8.90%
IEF 10/10/11 11/21/11 1.90%
IEI 10/10/11 11/21/11 0.80%
LQD 10/10/11 11/21/11 0.20%
SDS 10/10/11 11/21/11 -3.20%
BNDX 10/17/11 11/21/11 0.10%
UWM 11/21/11 12/5/11 12.10%
SSO 11/21/11 12/5/11 10.70%
QLD 11/21/11 12/5/11 10.20%
DDM 11/21/11 12/5/11 9.60%
RSP 11/21/11 11/28/11 -0.30%
QQQ 11/28/11 12/5/11 4.40%
IEF 12/5/11 01/30/12 1.70%
CSJ 12/5/11 01/23/12 0.60%
BND 12/5/11 01/30/12 0.50%
SHY 12/5/11 01/23/12 -0.20%
SDS 12/5/11 01/30/12 -9.30%
BNDX 01/23/12 01/30/12 0.90%
IEI 01/23/12 01/30/12 0.60%
SSO 01/30/12 07/2/12 8.00%
USMV 01/30/12 07/2/12 7.70%
DDM 01/30/12 07/2/12 4.00%
SPY 01/30/12 07/2/12 3.70%
VIG 01/30/12 07/2/12 0.70%
PXLG 07/2/12 07/9/12 2.70%
BNDX 07/2/12 08/27/12 0.50%
VMBS 07/2/12 08/27/12 0.40%
SHY 07/2/12 08/27/12 -0.10%
SDS 07/2/12 08/27/12 -8.00%
CSJ 07/9/12 08/27/12 0.40%
UWM 08/27/12 04/1/13 34.40%
DDM 08/27/12 04/1/13 24.40%
SSO 08/27/12 04/1/13 23.30%
VOE 08/27/12 04/1/13 17.20%
RSP 08/27/12 04/1/13 15.70%
VWOB 04/1/13 04/8/13 2.50%
EMB 04/1/13 04/8/13 2.50%
VMBS 04/1/13 04/8/13 0.20%
CSJ 04/1/13 04/8/13 -0.10%
SDS 04/1/13 04/8/13 -0.40%
QLD 04/8/13 12/22/14 133.70%
SSO 04/8/13 12/22/14 79.50%
UWM 04/8/13 12/22/14 63.50%
QQQ 04/8/13 12/22/14 53.00%
VOE 04/8/13 12/22/14 34.20%
SDS 12/22/14 01/5/15 5.40%
IEF 12/22/14 01/5/15 0.70%
IEI 12/22/14 01/5/15 0.30%
SHY 12/22/14 12/29/14 -0.20%
CIU 12/22/14 12/29/14 -0.50%
BND 12/29/14 01/5/15 0.60%
VMBS 12/29/14 01/5/15 0.30%
SSO 01/5/15 01/26/15 3.30%
DDM 01/5/15 01/26/15 1.70%
ANGL 01/5/15 01/20/15 1.50%
PXLG 01/5/15 01/12/15 0.30%
QLD 01/5/15 01/12/15 0.00%
UWM 01/12/15 01/26/15 3.20%
RSP 01/12/15 01/20/15 -0.50%
QLD 01/20/15 01/26/15 4.80%
QQQ 01/20/15 01/26/15 2.30%
SDS 01/26/15 02/2/15 3.20%
IEF 01/26/15 02/2/15 0.90%
IEI 01/26/15 02/2/15 0.40%
BND 01/26/15 02/2/15 0.30%
CSJ 01/26/15 02/2/15 -0.10%
DDM 02/2/15 02/9/15 4.20%
UWM 02/2/15 02/9/15 3.40%
SSO 02/2/15 02/9/15 2.50%
PXLG 02/2/15 02/9/15 1.50%
QLD 02/2/15 02/9/15 1.30%
VNQ 02/9/15 02/17/15 0.10%
IEI 02/9/15 05/4/15 -0.20%
LQD 02/9/15 02/23/15 -0.20%
IEF 02/9/15 05/4/15 -1.40%
SDS 02/9/15 05/4/15 -7.90%
BND 02/17/15 05/4/15 -0.30%
VNQ 02/23/15 03/16/15 -2.60%
QLD 03/16/15 03/23/15 3.20%
ANGL 03/23/15 05/4/15 0.60%
UWM 05/4/15 06/8/15 3.70%
MTUM 05/4/15 06/8/15 -0.50%
QQQ 05/4/15 06/8/15 -1.20%
QLD 05/4/15 06/8/15 -2.30%
VNQ 05/4/15 06/15/15 -3.90%
VWOB 06/8/15 06/22/15 0.40%
IEF 06/8/15 06/15/15 0.10%
DDM 06/8/15 06/15/15 0.00%
LQD 06/8/15 06/15/15 -0.20%
QLD 06/15/15 06/22/15 4.80%
QQQ 06/15/15 06/22/15 2.10%
EMB 06/15/15 06/22/15 1.10%
ANGL 06/15/15 06/29/15 -1.00%
SDS 06/22/15 06/29/15 5.80%
SHY 06/22/15 06/29/15 -0.10%
CSJ 06/22/15 06/29/15 -0.10%
BNDX 06/22/15 06/29/15 -0.20%
QLD 06/29/15 07/20/15 13.50%
VNQ 06/29/15 07/13/15 4.00%
VIG 06/29/15 07/13/15 2.40%
IEF 06/29/15 07/6/15 -0.10%
LQD 06/29/15 07/6/15 -0.20%
SSO 07/6/15 07/13/15 2.70%
UWM 07/6/15 07/13/15 2.50%
QQQ 07/13/15 07/20/15 3.80%
SDS 07/13/15 07/27/15 2.80%
LQD 07/13/15 07/20/15 0.10%
VOE 07/13/15 07/20/15 -1.00%
SHY 07/20/15 07/27/15 -0.10%
CSJ 07/20/15 07/27/15 -0.20%
ANGL 07/20/15 07/27/15 -0.60%
EMB 07/20/15 07/27/15 -1.10%
UWM 07/27/15 08/3/15 2.70%
SSO 07/27/15 08/3/15 2.60%
QLD 07/27/15 08/3/15 2.50%
DDM 07/27/15 08/3/15 1.40%
IWV 07/27/15 08/3/15 1.30%
CSJ 08/3/15 08/10/15 -0.30%
SHY 08/3/15 08/10/15 -0.40%
BNDX 08/3/15 08/10/15 -0.50%
BND 08/3/15 08/10/15 -0.60%
SDS 08/3/15 08/10/15 -1.00%
MTUM 08/10/15 08/17/15 0.50%
UWM 08/10/15 08/17/15 0.20%
SSO 08/10/15 08/17/15 -0.20%
QLD 08/10/15 08/17/15 -0.50%
DDM 08/10/15 08/17/15 -0.80%
SDS 08/17/15 08/24/15 22.20%
IEF 08/17/15 08/24/15 1.10%
LQD 08/17/15 08/24/15 -0.30%
VWOB 08/17/15 08/24/15 -2.30%
ANGL 08/17/15 08/24/15 -2.50%
QLD 08/24/15 08/31/15 11.20%
SSO 08/24/15 08/31/15 8.30%
DDM 08/24/15 08/31/15 8.10%
UWM 08/24/15 08/31/15 7.90%
QQQ 08/24/15 08/31/15 5.70%
BNDX 08/31/15 09/8/15 0.70%
IEF 08/31/15 09/8/15 -0.10%
VNQ 08/31/15 09/14/15 -0.20%
USMV 08/31/15 09/8/15 -0.20%
SDS 08/31/15 09/8/15 -0.70%
QLD 09/8/15 09/14/15 0.10%
UWM 09/8/15 09/14/15 -1.60%
DDM 09/8/15 09/14/15 -1.60%
SSO 09/8/15 09/14/15 -1.80%
CSJ 09/14/15 11/2/15 0.00%
VMBS 09/14/15 11/2/15 -0.20%
IEF 09/14/15 11/2/15 -0.30%
LQD 09/14/15 11/9/15 -1.10%
SDS 09/14/15 11/2/15 -15.30%
UWM 11/2/15 11/30/15 1.80%
EMB 11/2/15 11/9/15 -0.60%
ANGL 11/2/15 11/9/15 -0.80%
VNQ 11/2/15 11/30/15 -2.90%
VIG 11/9/15 11/30/15 0.70%
USMV 11/9/15 11/30/15 0.70%
NOBL 11/9/15 11/30/15 0.70%
VMBS 11/30/15 12/7/15 -0.10%
SDS 11/30/15 12/7/15 -0.10%
SHY 11/30/15 12/7/15 -0.30%
VWOB 11/30/15 12/7/15 -1.10%
ANGL 11/30/15 12/7/15 -1.10%
BNDX 12/7/15 12/14/15 -0.20%
VNQ 12/7/15 12/14/15 -1.30%
EMB 12/7/15 12/14/15 -1.50%
UWM 12/7/15 12/28/15 -2.70%
PXLG 12/7/15 12/14/15 -3.10%
SSO 12/14/15 12/28/15 2.80%
QLD 12/14/15 12/28/15 1.70%
DDM 12/14/15 12/28/15 1.10%
ANGL 12/14/15 12/21/15 0.40%
LQD 12/21/15 02/16/16 -1.60%
SDS 12/28/15 02/16/16 14.70%
IEI 12/28/15 02/16/16 2.20%
BND 12/28/15 02/16/16 1.10%
VMBS 12/28/15 02/16/16 1.10%
DDM 02/16/16 02/22/16 5.20%
UWM 02/16/16 02/22/16 5.10%
VNQ 02/16/16 02/22/16 3.20%
RSP 02/16/16 02/22/16 2.90%
VOE 02/16/16 02/22/16 2.80%
LQD 02/22/16 02/29/16 0.70%
BND 02/22/16 02/29/16 0.00%
IEI 02/22/16 03/21/16 -0.90%
IEF 02/22/16 03/21/16 -1.40%
SDS 02/22/16 03/28/16 -9.10%
SHY 02/29/16 03/28/16 -0.40%
VMBS 02/29/16 03/7/16 -0.50%
BND 03/7/16 03/14/16 0.00%
VMBS 03/14/16 03/28/16 -0.10%
BNDX 03/21/16 03/28/16 -0.20%
CSJ 03/21/16 03/28/16 -0.20%
UWM 03/28/16 04/4/16 5.10%
ANGL 03/28/16 06/27/16 5.00%
VNQ 03/28/16 04/4/16 2.10%
RSP 03/28/16 04/4/16 0.90%
VOE 03/28/16 04/4/16 0.60%
SDS 04/4/16 06/27/16 4.30%
BNDX 04/4/16 06/27/16 1.70%
CSJ 04/4/16 06/27/16 0.30%
SHY 04/4/16 06/27/16 0.10%
QLD 06/27/16 07/5/16 9.80%
UWM 06/27/16 07/5/16 9.20%
SSO 06/27/16 07/5/16 8.70%
DDM 06/27/16 07/5/16 8.10%
PXLG 06/27/16 07/5/16 5.20%
CSJ 07/5/16 07/25/16 -0.40%
SHY 07/5/16 07/25/16 -0.50%
VMBS 07/5/16 07/25/16 -0.70%
IEI 07/5/16 07/25/16 -1.10%
SDS 07/5/16 07/25/16 -7.80%
SPY 07/25/16 09/6/16 0.90%
VIG 07/25/16 09/6/16 0.10%
NOBL 07/25/16 09/6/16 -0.50%
USMV 07/25/16 09/6/16 -1.50%
PXLG 07/25/16 09/19/16 -2.40%
SDS 09/6/16 09/12/16 2.00%
CIU 09/6/16 09/12/16 -0.70%
BNDX 09/6/16 09/12/16 -0.80%
VWOB 09/6/16 09/12/16 -1.10%
QLD 09/12/16 09/19/16 1.10%
UWM 09/12/16 09/19/16 -0.70%
SSO 09/12/16 09/19/16 -2.00%
DDM 09/12/16 09/19/16 -2.40%
VNQ 09/19/16 09/26/16 3.30%
ANGL 09/19/16 10/31/16 1.00%
SDS 09/19/16 10/31/16 0.50%
VWOB 09/19/16 10/31/16 -0.80%
EMB 09/19/16 11/7/16 -0.90%
CSJ 09/26/16 10/31/16 -0.40%
UWM 10/31/16 03/6/17 34.00%
QLD 10/31/16 03/6/17 24.20%
VNQ 10/31/16 03/20/17 0.10%
LQD 10/31/16 11/7/16 -0.40%
DDM 11/7/16 03/6/17 32.70%
SSO 11/7/16 03/6/17 24.70%
SDS 03/6/17 03/13/17 -0.30%
IEI 03/6/17 03/13/17 -0.60%
VMBS 03/6/17 03/13/17 -0.90%
IEF 03/6/17 03/13/17 -1.00%
UWM 03/13/17 03/20/17 1.80%
LQD 03/13/17 03/20/17 1.10%
VWOB 03/13/17 03/20/17 0.90%
ANGL 03/13/17 03/20/17 0.70%
SDS 03/20/17 03/27/17 2.40%
BNDX 03/20/17 03/27/17 0.30%
SHY 03/20/17 03/27/17 -0.10%
CSJ 03/20/17 03/27/17 -0.10%
Georg, Wondering how fixed income only portfolio would perform?
Thanks for all info.
This model invests in fixed income only during down-market periods. Removing the possibility to invest in equity and gold ETFs would result that the model is in cash over long periods.
Here is the performance for such a scenario:
Quick Stats as of 6/16/2017
Total Return 57.21%
Benchmark Return 129.10%
Active Return -71.89%
Annualized Return 2.63%
Annual Turnover 935.96%
Max Drawdown -6.92%
Benchmark Max Drawdown -55.19%
Overall Winners (422/845) 49.94%
Sharpe Ratio 0.28
Georg Vrba said at the bottom of this article – “On iMarketSignals we will report the performance of this model, with weekly trading signals normally provided on Sundays to Gold level members.”
Can you please point me to the section where the performance of this model is being reported?
Thanks
Can you please respond to my question above and let us know where to find these results now that we are trading The iM-5 ETF Trader live.
What would the results be if no leveraged ETFs were used? Thanks
iM-5ETF Trader – no leveraged ETFs
Period 01/02/00 – 06/21/17
Benchmark SPDR S&P 500 ETF Trust
Quick Stats as of 6/21/2017
Total Return 4,128.69%
Benchmark Return 129.50%
Active Return 3,999.19%
Annualized Return 23.91%
Annual Turnover 1,091.04%
Max Drawdown -12.08%
Benchmark Max Drawdown -55.19%
Overall Winners (601/965) 62.28%
Sharpe Ratio 2.11
Correlation with SPDR S&P 500 ETF Trust 0.07
Georg,
Can you tell us what this would look like using only long leverage, no short leveraged ETF’s?
Thnx
The performance for this is shown in the first table of the model description:
iM 5ETF Trader – Basic + Gold + Lev Long
Here it is updated to 6/29/2017:
Total Return 10,163.04%
Benchmark Return 127.93%
Active Return 10,035.11%
Annualized Return 30.31%
Annual Turnover 1,111.47%
Max Drawdown -14.52%
Benchmark Max Drawdown -55.19%
Overall Winners (580/965) 60.10%
Sharpe Ratio 2.12
Backtesting above is reported through 3/27/17 and the model was posted on May 15. But in the report of results states the inception date was 6/30/16 and gives a YTD out of sample result. This seems inconsistent? If not, could you explain how you are defining inception date and out of sample? Thanks.
BTW, like nmtdoc above, I’d be interested in results with only long or only short ETFs leveraged.
We have only recently prepared the documentation for this model which we posted in May, but were monitoring performance from the earlier date, 10/31/2016 as shown in the performance update.
Georg –
Where is the updated ytd performance for this strategy being posted?
RV
It is posted in the Model Performance Tables.
The performance for this is shown in the first table of the model description:
iM 5ETF Trader – Basic + Gold + Lev Short
Here it is updated to 6/29/2017:
Total Return 5,374.75%
Benchmark Return 127.93%
Active Return 5,246.82%
Annualized Return 25.71%
Annual Turnover 1,089.45%
Max Drawdown -12.09%
Benchmark Max Drawdown -55.19%
Overall Winners (605/966) 62.63%
Sharpe Ratio 2.06
Georg,
Is it possible to have performance expressed as CAGR rather than Annualized Return?
Thnx,
Portfolio 123 Annualized Return is the same as CAGR.
What kind of return / risk will I get if I combine this model with “The iM-Minimum Drawdown Combo”?
Combining the 5ETF Trader 50:50 with the Min Drawdown Combo:
Simulated Performance:
Period 12/31/99 – 08/29/17
Benchmark SPDR S&P 500 ETF Trust
Quick Stats as of 8/29/2017
Total Return 8,072.28%
Benchmark Return 131.24%
Annualized Return 28.31%
Max Drawdown -10.01%
Benchmark Max Drawdown -55.19%
Sharpe Ratio 2.59
Wondering how this performed in 2008…..? Thanks Vman
Would you mind running this so that when the model shows down market conditions exist, the model simply goes to cash (or SHY). Essentially a Long, Lvg Long, Gold scenario.
We don’t advise to run this model without the fixed income ETFs.
Curious about a model to protect from black swan events. Would you consider a fixed income only model primarily based on your ranking system that is continuously in a fixed income vehicle not cash? Then maybe fixed income gold?
Hi George,
Could you give me the relevant stats for the following Book;
25% iM-Composite-(SH-RSP)
25% iM-Composite-(SPY-IEF)
25% iM-Composite-(Gold-Stock-Bond)
25% iM-5ETF Trader (leveraged)
Much appreciated,
Jon
Here is the 4 model combo:
Number of Assets 4
Last Trades (4) 05/01/17
Period 12/31/00 – 11/08/17
Benchmark S&P 500 (SPY)
Quick Stats as of 11/8/2017
Total Return 5,064.03%
Benchmark Return 177.48%
Active Return 4,886.55%
Annualized Return 26.37%
Max Drawdown -11.64%
Benchmark Max Drawdown -55.19%
Sharpe Ratio 2.34
Correlation with S&P 500 (SPY) 0.27
Thanks, Georg
Could you run this without Gold-Stock Bond, allocating 1/3 to each of the remaining 3 strategies?
Thank you for your help,
Jon
Also,
Where is the correlation table? I know thwere is one, but can’t for the life of me find it:).
Thnx
Correlation Table:
https://imarketsignals.com/2017/correlation-im-etf-models/
Wondering if this model could be improved with a 5% loss sell stop?
I am slightly confused. You show the trades for this study from 2000 thru 2017 and there seem to be fairly frequent trades. But now there has not been one trade since March 2017?
Also, it does not seem to be a mean reverting system, but rather a momentum based system that has stayed with the momentum of equities.
Georg,
I am very interested in implementing this system even though it will mean frequent trading. I notice that in the backtest there were about 50 trades per year, but there have been no trades since 3/27/17. Has there been a change in the system that would now require fewer trades?
Jeff Mills
There were no changes made to the model’s algorithm. This model did not trade because market conditions did not change according to the built-in market timer.
How does the following combo perform?
5-ETF incl. Leveraged…25%
VIX Timer with ZIV…25%
SPY-SH.R1 rules using instead SSO-SDS…25%
Composite Timer (SPY-IEF) rule using instead SSO-UST…25%
Thanks!
This is a highly leveraged portfolio which can only lead to major losses.
You advocated the SSO-SDS in a 2013 article called iM Best (SSO-SDS): Beating the Market with leveraged ETF’s and you recently back-tested the SSO-UST and said it only drew down 21%. I am not investing 100% of my portfolio to this strategy, so I was hoping you could back test it for me with the 4 models listed 25% each?
https://imarketsignals.com/2013/im-bestsso-sds/
Disregard, I’ll just do a 50-50 mix of 5-ETF incl. Leveraged and
VIX Timer with ZIV
“As portfolio size increases the slippage also increases. Since this model trades in many liquid ETFs slippage should not exceed the assumed value until the total portfolio size becomes very large.”
Could one not, in the case of a very large portfolio, buy an appropriate number of out-of-the-money put option contracts and simultaneously sell, or write, an equal number of out-of-the-money call option contracts, with the same expiration date, essentially locking in profits? One could then close the very large equity position and make up the slippage losses with the options collar’s gains.
Georg and Anton,
I notice that there are no international equities available in this model. Do you think that there is a risk that international equities may significantly outperform U S equities at some point in the future?
I also have the same question. Many analysts speak of risks of high inflation or stagflation in the future, it would make a lot of sense to have access to international equities in some tactical strategies.
Dear George,
you write “The model holding two ETFs produced an annualized return of 25.4%, which diminishes consistently as holdings were increased, all as shown in the table below.”
Why did you choose to hold 5 ETFs then? Is this a risk management measure?
Yes, it was felt that holding 5 ETFs would be less risky than holding only two highly leveraged ETFs.
Hi George,
Could you give me the stats for the following Book;
25% Combo 5
25% ZIV Model
50% iM-5ETF Trader (leveraged)
Much appreciated,
For the above combo:
Period 12/29/06 – 09/14/18
Benchmark S&P 500 (SPY)
Quick Stats as of 9/14/2018
Total Return 5,547.46%
Benchmark Return 160.03%
Active Return 5,387.43%
Annualized Return 41.13%
Max Drawdown -16.98%
Benchmark Max Drawdown -55.19%
Sharpe Ratio 2.72
for last 3 years:
Period 09/15/15 – 09/14/18
Quick Stats as of 9/14/2018
Total Return 123.52%
Benchmark Return 55.65%
Active Return 67.87%
Annualized Return 30.77%
Max Drawdown -16.96%
Benchmark Max Drawdown -12.82%
Sharpe Ratio 2.28
for last year:
Period 09/15/17 – 09/14/18
Quick Stats as of 9/14/2018
Total Return 40.60%
Benchmark Return 18.33%
Active Return 22.28%
Annualized Return 40.77%
Max Drawdown -16.98%
Benchmark Max Drawdown -10.10%
Sharpe Ratio 2.13
Georg;
In light of the current drawdown in this model, could you run the backtest again, updated to the end of 2018? I’d like to see this drawdown in the context of the entire history.
I understand why the model remains in an up-market stance. We want to avoid curve-fitting, but is there any modification you would make to this model? I’d appreciate any comments.
Thanks very much.
EMAIL STATES BUY IGSP
Correct.
I guess you meant IGSB because there is no such IGSP ticker
Yes, thank you for pointing this out. Should be IGSB, not IGSP.
now the website shows IGSP….
I know I’m posting this on 3 different models, but can you please give me an updated Sortino ratio from present through the entire back-test period? Thanks!
any help on this one I’d be much obliged
Since Inception 10/30/16
Total Return (%) …. 47.54
Annualized Return (%) …. 16.47
Max Drawdown (%) …. -34.86
Monthly Samples …. 30
Standard Deviation (%) …. 20.58
Sharpe Ratio …. 0.91
Sortino Ratio …. 1.07
Curious if this model performs poorly during periods of protracted rangebound consolidation, while performing better during extended uptrending periods?