
This Universe holds well capitalized companies with strong market positions, which pay good dividends, have price appreciation potential, and provide a degree of downside protection during bear markets.
- The Universe is reconstituted weekly, and consists of 20 large-cap stocks with Capital Strength type characteristics from the Russell 1000 Index.
- A backtest, without any buy- and sell-rules, from Jan-2000 to end of Jun-2017 showed a 10.0% annualized return with a maximum drawdown of -41.5%.
- A comparison with Vanguard’s large-cap ETFs older than 10 years shows that for periods 1-year and longer the Universe would have produced higher returns than any of the five ETFs.
The iM-Capital Strength 20-Stock Universe
The Capital Strength IndexSM stock qualification criteria were modified to select stocks for the iM-Capital Strength Universe. The stocks come from the Russell 1000 Index and must:
- have a minimum three-month average daily dollar Trading Volume of $10-million;
- have a Cost of Capital less than the Return on Capital;
- after meeting criteria 1 and 2, be in the top 500 securities by Market Capitalization;
- have at least $1-billion in Cash or $1.1-billion of Short Term Investments;
- have a Long Term Debt to Market-Cap ratio less than 30%;
- have a Return on Equity greater than 15%;
- have a compound annual growth rate of Earnings per Share over the last 3 years greater than 2.5%;
- and have a Short Interest Ratio of 9 days or less.
The universe is then reduced to 20 stocks by sorting eligible companies according to the Sales percent change (recent Quarter vs Quarter 1 year ago), and Average Dividend Yield over the last 60 months.
The Universe is reconstituted weekly when new stocks are added to replace those which no longer meet the stock qualification criteria.
Performance 2000-2017
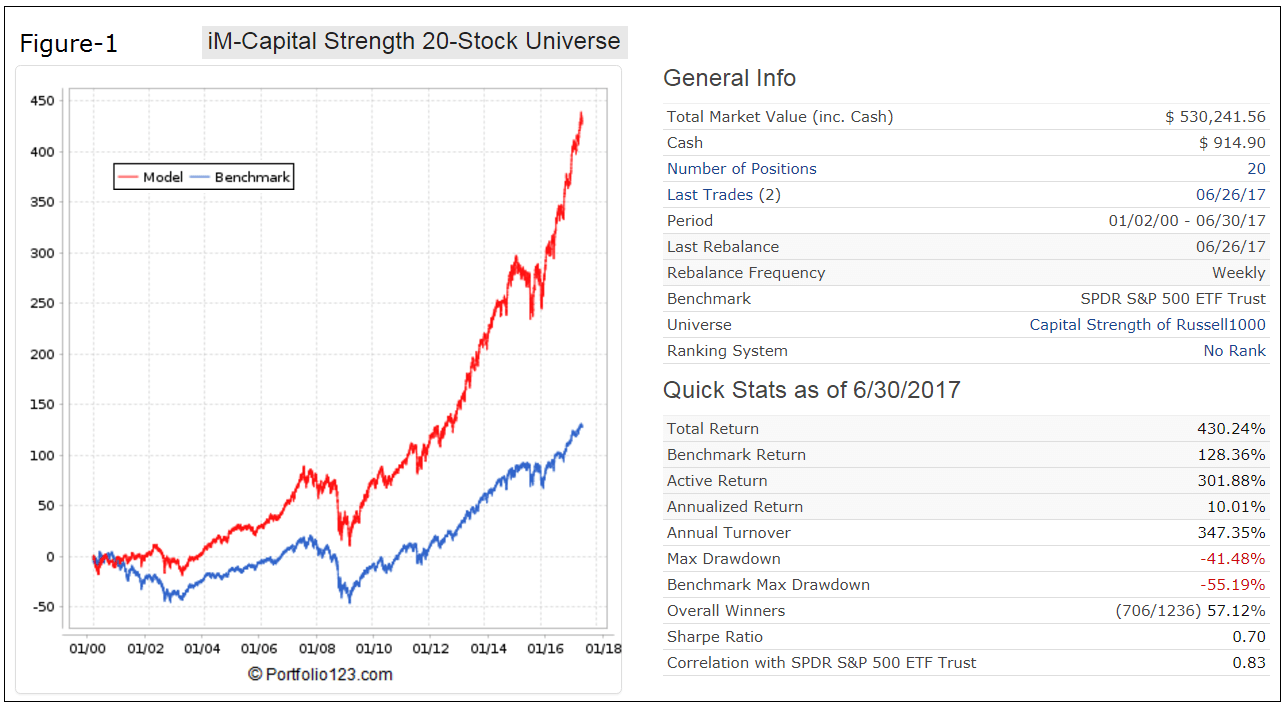
For the performance backtest the 20 stocks of the Universe were equally weighted initially, but never rebalanced to equal weight thereafter. Thus, stocks with long holding periods can have greater weights than others in the model. The only trading activity comes from selling stocks which have fallen out of the Universe and buying stocks to replace them. Trading cost, including slippage, was taken as 0.05% of trade amounts, and share price was taken as the closing price for the day.
Performance from Jan-2000 to Jun-2017 is shown in Figure-1. The Universe produced an annualized return of 10.0% with a -41.5% maximum drawdown. An initial investment of $100 would have grown to $530. The maximum drawdown was less than for benchmark SPDR S&P 500 ETF (SPY), the ETF tracking the S&P500, which can be attributed to the relatively better performance of Capital Strength type stocks during down market periods.
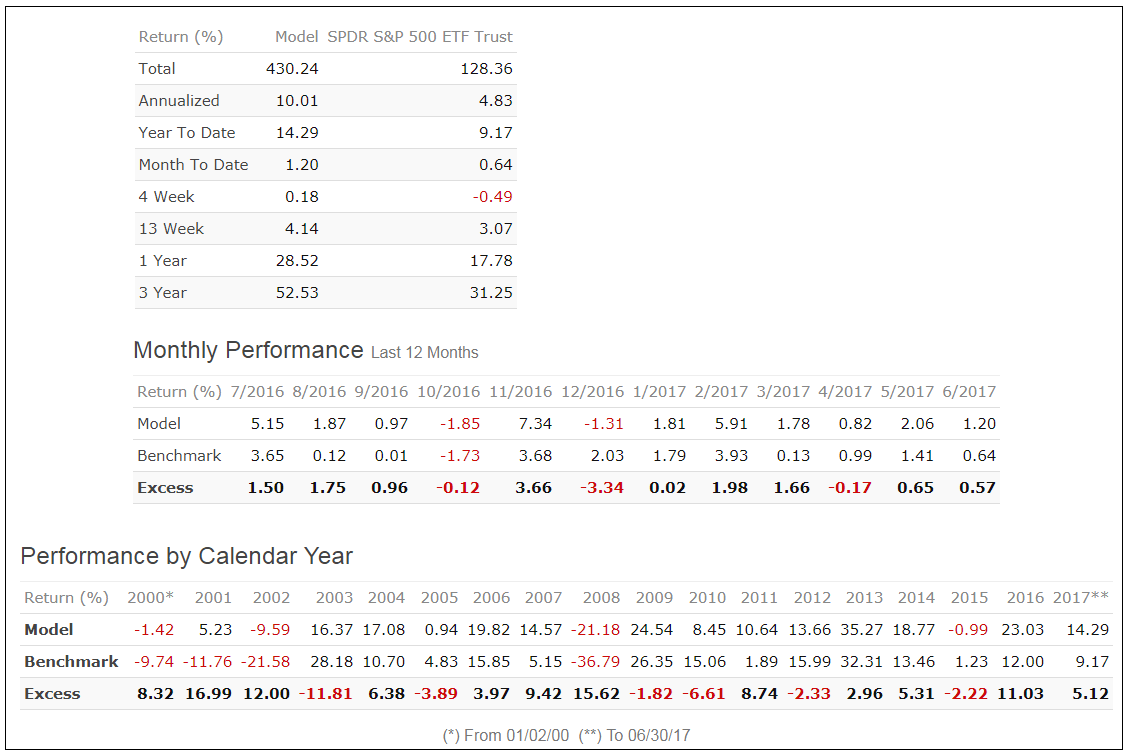
Performance Report
The performance report for the period 1/2/00 to 6/30/17 is from Portfolio 123. It compares performance of the iM-Capital Strength 20-Stock Universe with the benchmark (SPY).
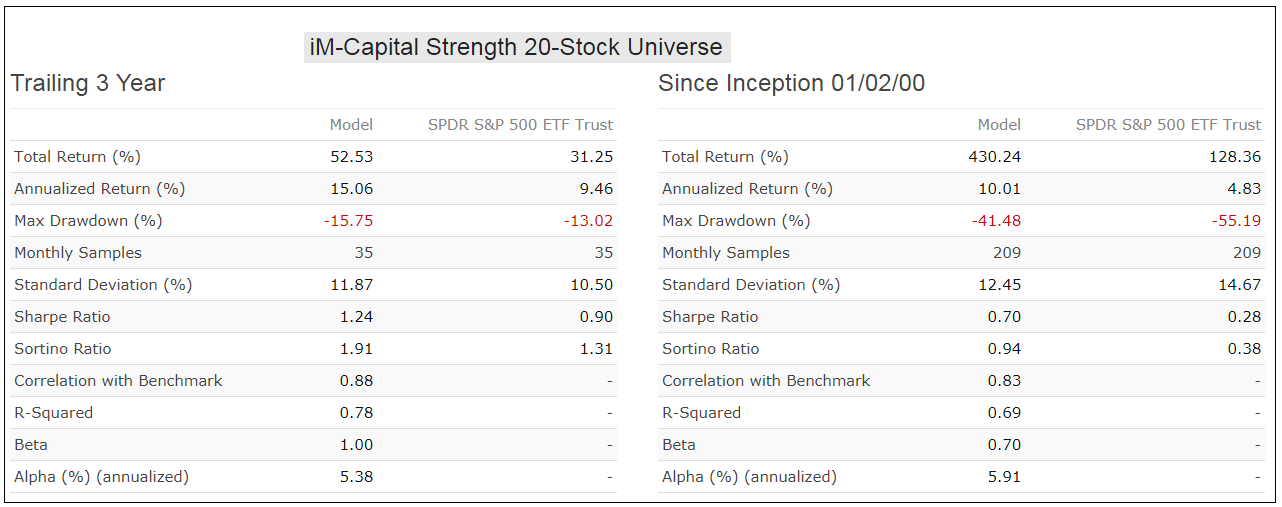
Risk Measurements
Risk measurements are from Portfolio 123. The Universe appears to be less risky than buy-and-hold of ETF (SPY), as confirmed by the lower Standard Deviation and Beta, and higher Sharpe- and Sortino Ratios. Alpha indicated excess returns relative to return of the benchmark (SPY) is about 5% annualized.
Performance Comparison with Vanguard Large-Cap ETFs and SPY
The performance comparison is shown in the table below with the simulated returns of iM-Capital Strength 20-Stock Universe and those from the two related trading models shown at the top.
|
as of 6/30/2017 |
Return |
Annualized Returns |
||||
|
YTD |
1 year |
3 year |
5 year |
10 year |
||
|
iM-Capital Strength 20-Stock Universe |
14.29% |
28.52% |
15.21% |
18.64% |
11.50% |
|
|
19.71% |
37.81% |
24.35% |
24.47% |
20.95% |
||
|
18.57% |
37.71% |
26.82% |
27.79% |
23.34% |
||
|
Vanguard Dividend Appreciation ETF |
VIG |
9.94% |
13.75% |
8.29% |
12.75% |
7.41% |
|
Vanguard High Dividend Yield ETF |
VYM |
4.77% |
12.73% |
8.95% |
13.64% |
7.08% |
|
Vanguard Growth ETF |
VUG |
14.71% |
20.19% |
10.14% |
14.87% |
8.81% |
|
Vanguard Large-Cap ETF |
VV |
9.49% |
18.24% |
9.39% |
14.58% |
7.33% |
|
Vanguard Value ETF |
VTV |
5.13% |
16.54% |
8.76% |
14.39% |
5.84% |
|
Average return of Vanguard funds |
8.81% |
16.29% |
9.11% |
14.05% |
7.29% |
|
|
SPDR S&P 500 ETF |
SPY |
9.17% |
19.38% |
9.47% |
14.49% |
7.07% |
Portfolio holdings
|
Holdings as of 7/18/2017 |
||||
|
Ticker |
Name |
MktCap $-Billion |
Sector Code |
Yield (%) |
|
AMGN |
Amgen Inc |
130.6 |
HEALTHCARE |
2.59 |
|
BA |
Boeing Co |
126.6 |
INDUSTRIAL |
2.72 |
|
BAX |
Baxter International Inc |
33.8 |
HEALTHCARE |
1.03 |
|
BBY |
Best Buy Co Inc |
17.1 |
DISCRETIONARY |
2.43 |
|
CLX |
Clorox Co (The) |
16.9 |
STAPLE |
2.56 |
|
CSCO |
Cisco Systems Inc |
157.4 |
TECH |
3.68 |
|
DD |
E. I. du Pont de Nemours and Co |
73.4 |
MATERIALS |
1.80 |
|
DPS |
Dr Pepper Snapple Group Inc |
16.6 |
STAPLE |
2.57 |
|
EMR |
Emerson Electric Co. |
38.9 |
INDUSTRIAL |
3.18 |
|
GD |
General Dynamics Corp |
60.4 |
INDUSTRIAL |
1.68 |
|
HAS |
Hasbro Inc. |
14.1 |
DISCRETIONARY |
2.02 |
|
HON |
Honeywell International Inc |
103.1 |
INDUSTRIAL |
1.97 |
|
IPG |
Interpublic Group of Companies Inc. (The) |
9.8 |
DISCRETIONARY |
2.89 |
|
JNJ |
Johnson & Johnson |
356.1 |
HEALTHCARE |
2.54 |
|
KMB |
Kimberly-Clark Corp |
44.3 |
STAPLE |
3.11 |
|
MMM |
3M Co |
126.4 |
INDUSTRIAL |
2.22 |
|
MO |
Altria Group Inc |
142.0 |
STAPLE |
3.33 |
|
RPM |
RPM International Inc |
7.4 |
MATERIALS |
2.17 |
|
RTN |
Raytheon Co. |
48.6 |
INDUSTRIAL |
1.91 |
|
WSO |
Watsco Inc. |
5.3 |
INDUSTRIAL |
3.35 |
Following the model
At iMarketSignals we provide a weekly listing of the iM Capital Strength 20 Stock Universe and the stock ranking therein. Also we report the performance and trading signals for the two related trading models.
Disclaimer
The backtest indicates good returns with drawdowns better than for the broader market, as one would expect from a system investing in Capital Strength type stocks. However, note that all performance results are hypothetical and the result of backtesting over the period 2000 to 2017. No claim is made about future performance.
Leave a Reply
You must be logged in to post a comment.