
- This 5-stock trading strategy with the Materials Sector stocks of the S&P 500 produces much higher returns than the Materials Select Sector SPDR Fund (XLB).
- The universe from which stocks are selected holds point-in-time, the S&P 500 non-energy materials stocks of FactSet’s Reverse Business Industry Classification System.
- The model ranks the stocks of this custom universe and selects periodically the highest ranked stocks which also satisfy stipulated yield requirements.
- From 1/2/2009 to 10/21/2020 this strategy would have produced an annualized return (CAGR) of 19.2%, significantly more than the 11.5% CAGR of XLB over this period.
Previous articles described profitable trading strategies with the stocks of the Technology Select Sector SPDR Fund (XLK) (article-1), the Consumer Staples Select Sector SPDR Fund (XLP) (article-2), the Healthcare Select Sector SPDR Fund (XLV) (article-3), the Industrial Select Sector SPDR Fund (XLI) (article-4), and the Utility Select Sector SPDR Fund (XLU) (article-5) . Similarly, the non-energy materials stocks of the S&P 500 can be profitably employed to provide better returns than the Materials Select Sector SPDR Fund (XLB).
Emulating the Materials Select Sector SPDR Fund (XLB).
The analysis was performed on the on-line portfolio simulation platform Portfolio 123.
Since historic holdings of XLB are not published a custom universe was constructed from the S&P 500 non-energy materials stocks of FactSet’s Revere Business Industry Classifications System.
The rule to set up the custom universe “S&P 500 (MATERIALS)” in Portfolio 123 is: RBICS(MATERIALS) & !RBICS(MATOTHER) & !RBICS(ARCHITECTCOMPONENT).
The current holdings (31 stocks) of S&P 500 (MATERIALS) include all the current holdings of XLU (28 stocks).
Backtesting of S&P 500 (MATERIALS) universe
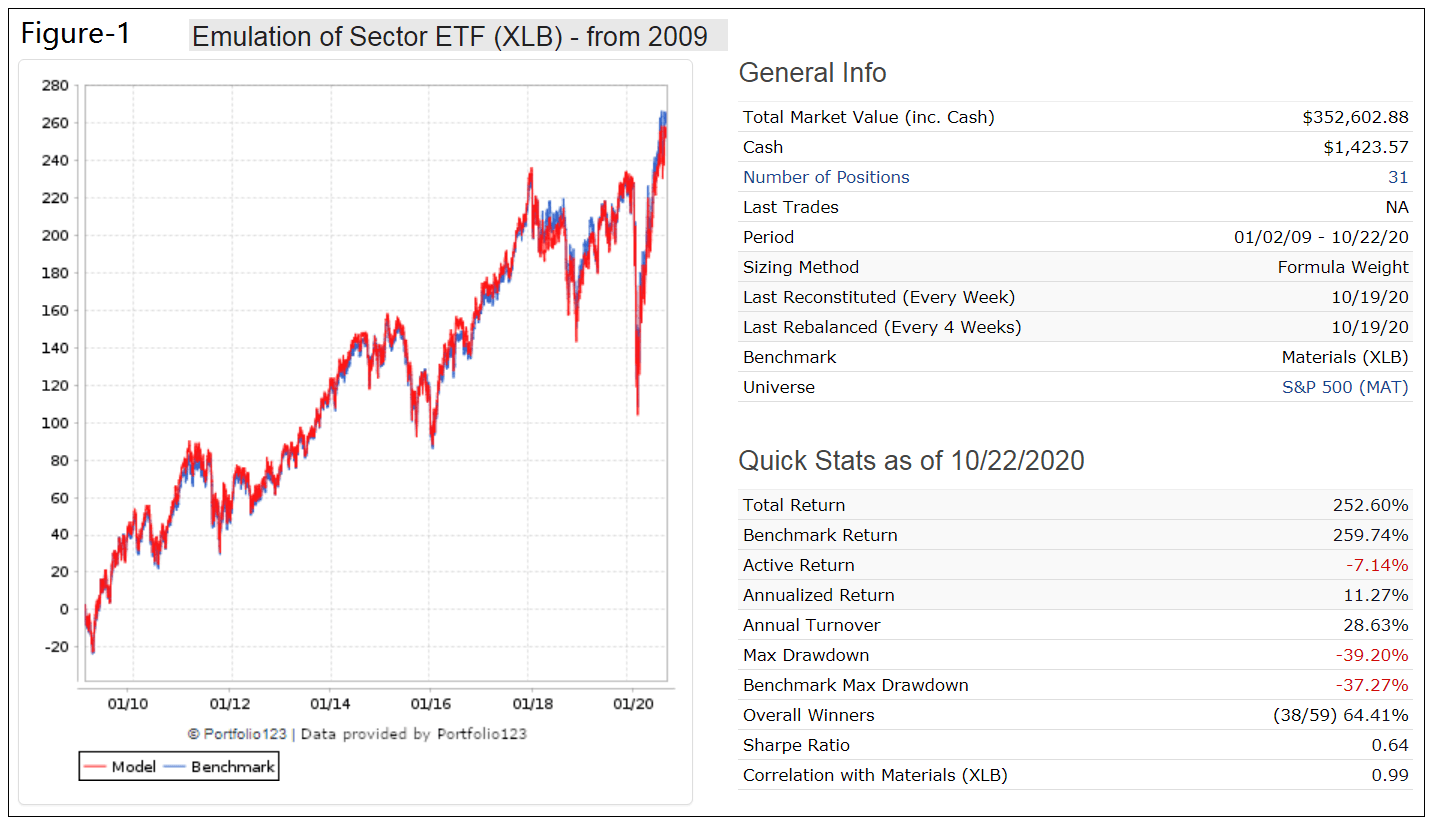
A backtest from 1/2/2009 to 10/21/2020 with all the cap-weighted stocks in the custom universe shows a 99% correlation with the performance of benchmark XLB and almost identical total returns of about 250% over this period, with similar holding weights and expense ratio as shown on the ETF provider’s website.
In the Figure-1 below, the red graph depicts the performance of the custom universe and the blue graph (partly hidden) the performance of XLB.
One can therefore expect that the custom universe S&P 500 (MATERIALS) will reasonably accurately reflect the holdings of XLB, and stocks selected by the model should not differ much from what would have been selected from a universe of XLB’s actual historic holdings.
Trading 5 stocks from the custom universe S&P 500 (MATERIALS)
The iM-Top5(XLB)Select trading strategy invests periodically in only five equal weighted stocks from the custom universe S&P 500 (MATERIALS) ranked with the standard Portfolio 123 “Greenblatt” ranking system
The buy rules require stocks to have a dividend yield greater than 0.85 times the yield of the S&P 500 index. Additionally, stocks must have an Altman Z-Score greater than 1.80, a Beneish M-Score less than -1.70 to eliminate companies that are associated with increased probability of manipulations, and a Piotroski F-Score greater than 4. Also, the Price to Earnings Ratio (excluding extraordinary items, for trailing 12 months) must be less than 1.25 times that of the average for the stocks of the S&P 500 index.
There is a ranked based sell rule and a minimum holding period of 4 weeks specified.
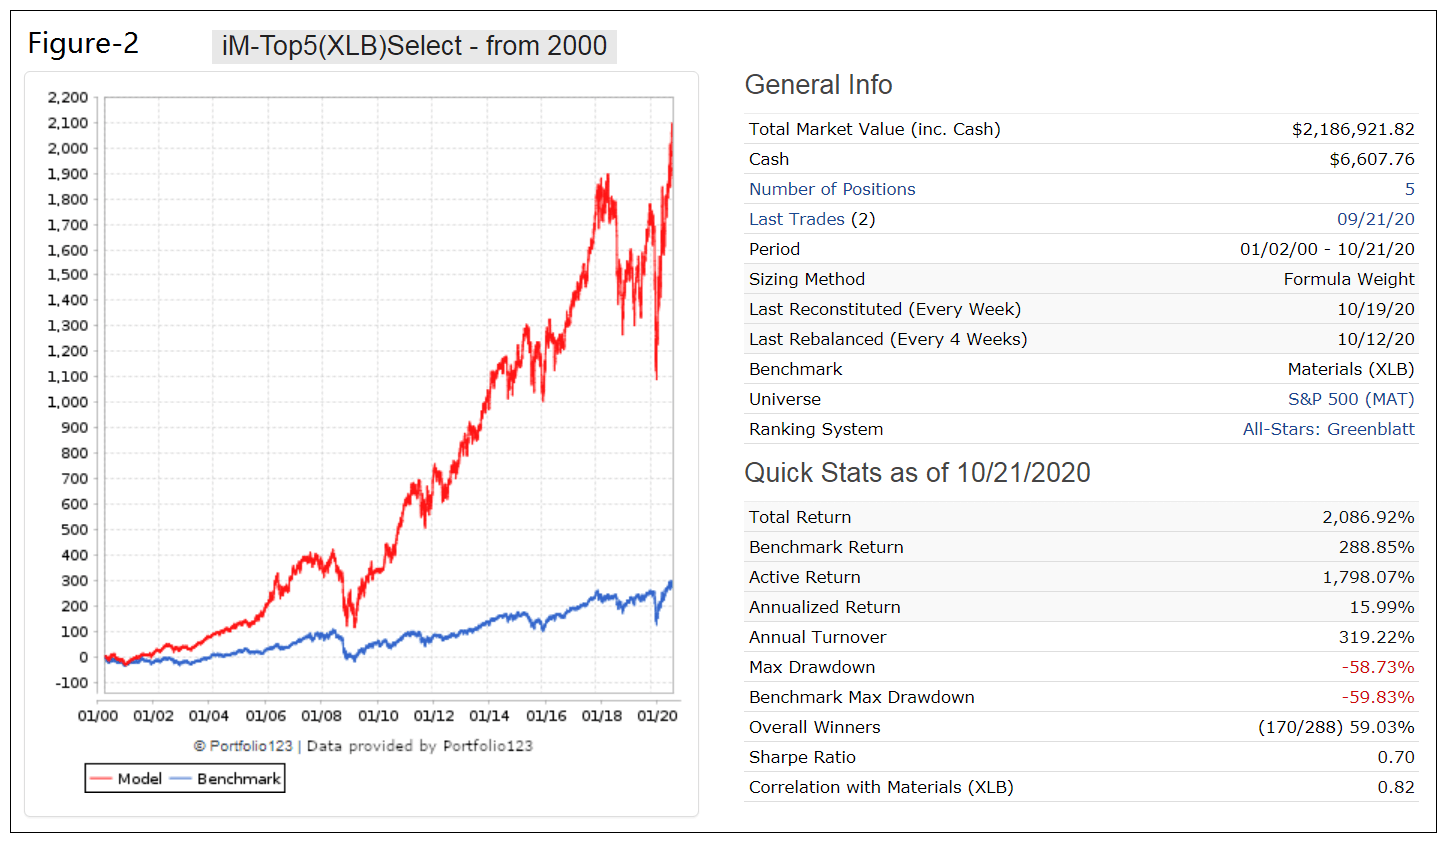
Figure-2 shows the simulated performance of this strategy from 1/2/2000 to 10/21/2020 and also that of the benchmark XLB. The model shows an annualized return of 16.0% (XLB produced 6.8%) and maximum drawdown of -59% (-60% for XLB). Annual turnover is reasonably low, about 320%. Trading costs of 0.12% of each trade amount were assumed in the simulation.
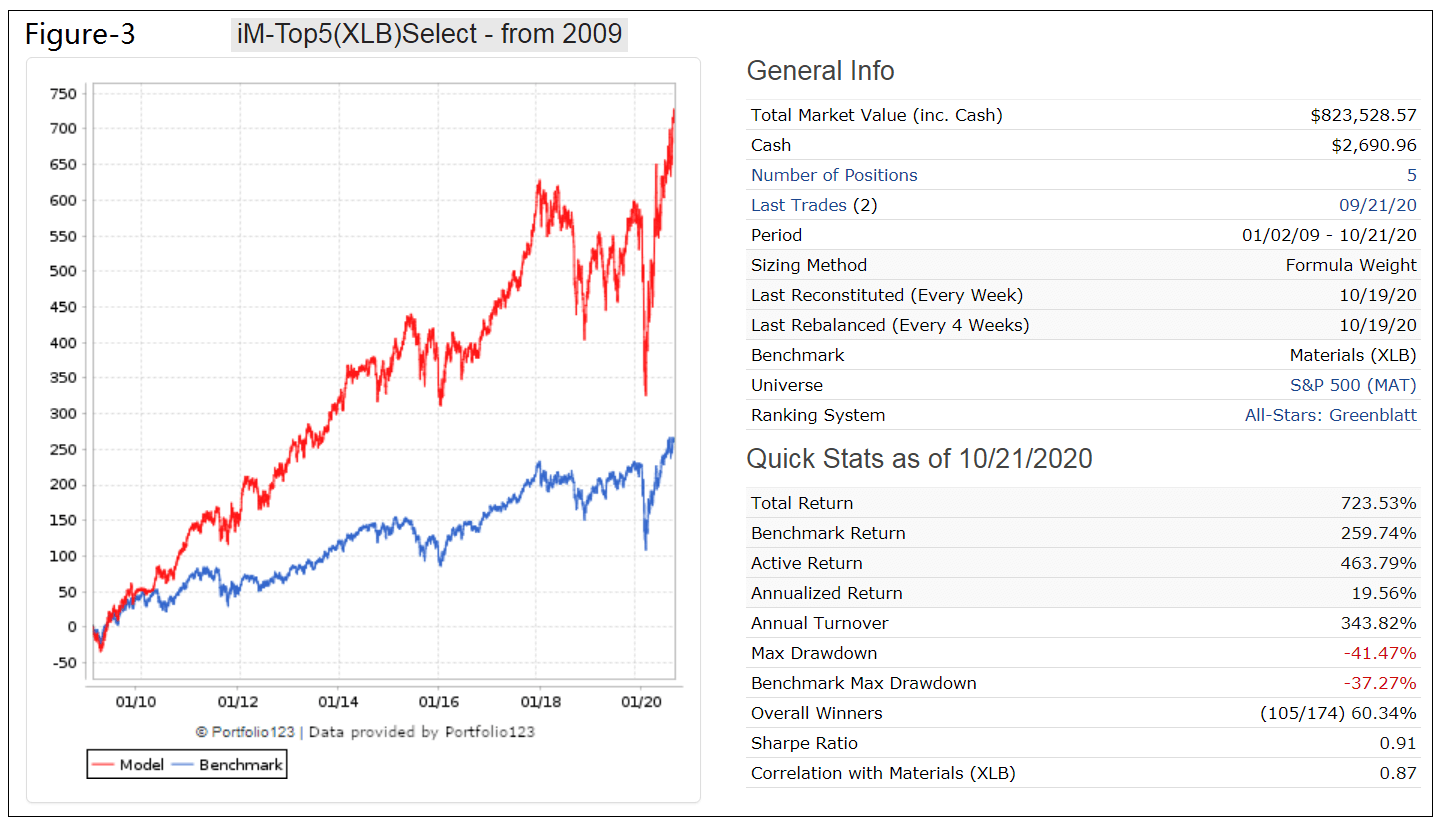
Materials stocks have performed reasonably well since 2009, with XLB showing an 11.5% annualized return for the period 1/2/2009 to 10/21/2020. The simulated performance of the trading strategy for the same period is shown in Figure-3. The model outperformed XLB; the backtest shows an annualized return of 19.6% and similar maximum drawdowns. Annual turnover is reasonably low, about 340%.
Investment Risk
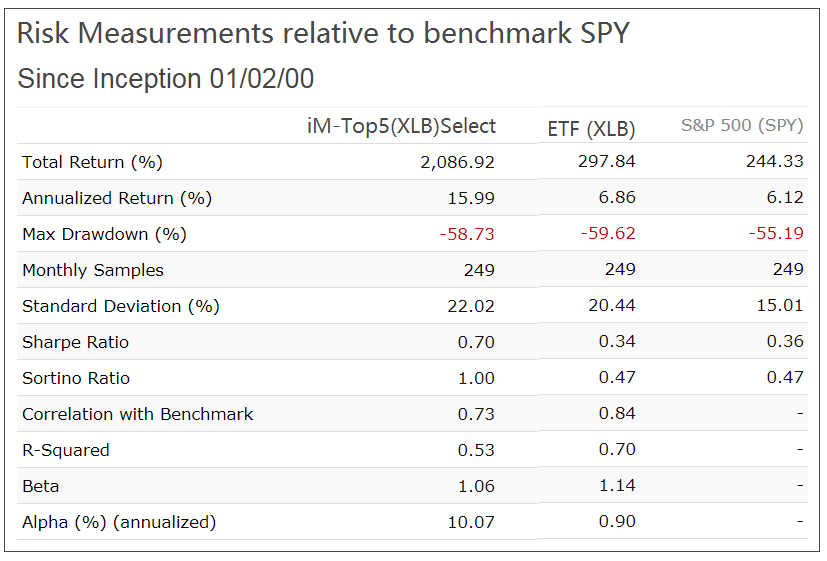
In the table below are the risk statistics from 2000 to 2020 for the model and XLB relative to the benchmark S&P 500 (SPY). It is evident from the risk measures that the trading strategy carries less risk than investing in XLB or SPY over the longer term.
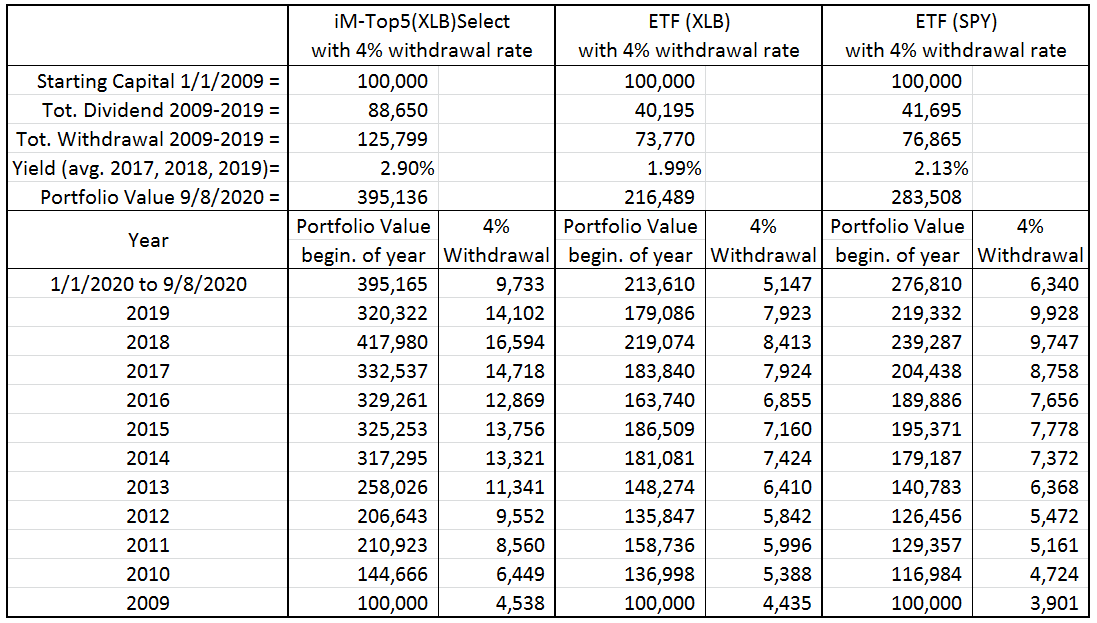
Performance comparison with 4% withdrawal rate
The table below compares the annual withdrawal amounts and portfolio values for the trading strategy, XLB and SPY assuming an initial investment of $100,000 at the beginning of 2009 and annual withdrawals of 4.0% of portfolio value.
Total withdrawals and end portfolio value for the trading strategy are 71% and 83% higher, respectively, than what would have been produced by a 4% withdrawal rate from a buy-and-hold investment in XLB. Also for the model the average dividend yield over the preceding three calendar years is significantly higher than that of XLB.
Conclusion
The analysis shows that the iM-Top5(XLB)Select investment strategy would have produced good returns, preferable to a buy-and-hold investment in stock index funds such as XLB or SPY. Reasonably high withdrawal rates should be possible without depleting the investment.
Moderate trading is required. The model shows a an average annual turnover of about 320% with a position held on average for 14 weeks and not shorter than 4 weeks. The current holdings are listed in the appendix.
Also, at iMarketSignals one can follow this strategy where the performance will be updated weekly.
Appendix
Current Holdings (as of 10/26/2020)
Ticker |
Name |
MktCap |
Days Held |
Yield % |
Sector |
| AVY | Avery Dennison Corp | 12 B | 158 | 1.76 | Non-Energy Materials |
| EMN | Eastman Chemical Co | 12 B | 32 | 3.07 | Non-Energy Materials |
| IFF | International Flavors & Fragrances Inc | 12 B | 0 | 2.79 | Non-Energy Materials |
| PKG | Packaging Corp Of America | 11 B | 830 | 2.67 | Non-Energy Materials |
| SEE | Sealed Air Corp | 6 B | 270 | 1.55 | Non-Energy Materials |
Disclaimer:
All results shown are hypothetical and the result of backtesting over the period 2000 to 2020. No claim is made about future performance.
2/13/23 B PKG
2/13/23 S SEE
1/8/23 B PKG
1/8/23 S SEE
I think there’s something wrong
Thanks, A cut and paste typo error on the website now corrected:
holdings
AVY is already in position
shall we double?
NEM was sold 10/11/21 and we already had AVY. Can you check this?
are we supposed to sell STLD and buy NEM? or have a double position on AVY? Very confused please advise?
Portfoli123 trades are:
3/3/2025 holds AVY CF NEM NUE PPG
3/3/2025 AVY buy STLD sell
2/24/2025 AVY sell NEM buy
Confused – shows sell BALL Jan 5th, still shows as a holding, and did not buy anything?
please advise
HI can you help? Confused – shows sell BALL Jan 5th, but still shows BALL as a holding, and did not buy anything to replace it?
Jason, the typo was fixed shortly after you reported it. If you still observe this, please clear your browser’s cache.