
In our continued effort to satisfy request for low drawdowns models with reasonable turnover and good returns we provide this model, which combines:
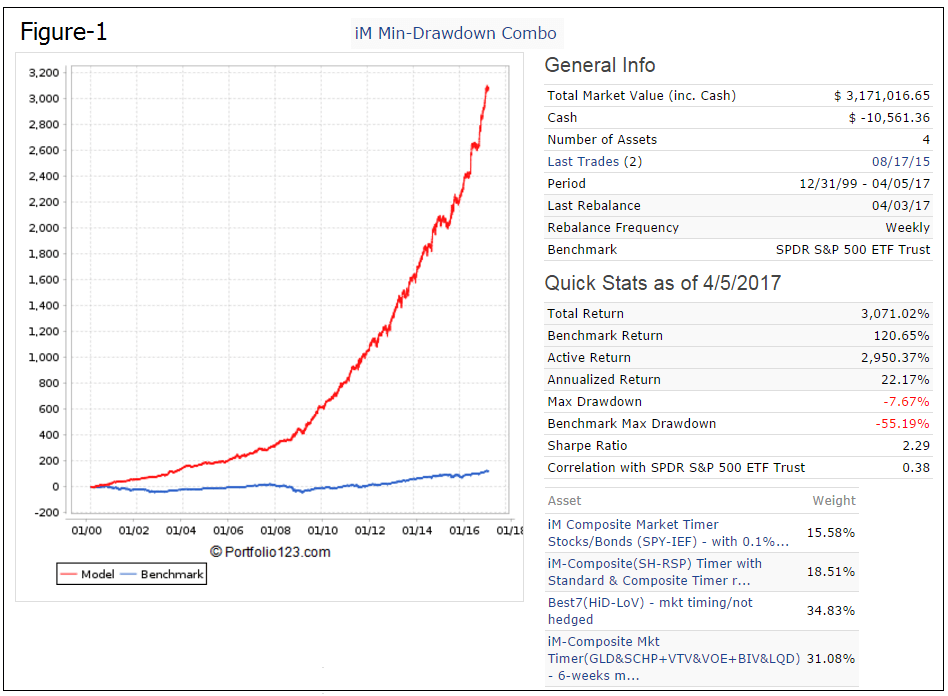
- the iM-Composite Timer (SPY-IEF) which holds only one ETF at any time (16% weight in the combo),
- the iM-Composite Timer(GLD&SCHP+VTV&VOE+BIV&LQD) based on the iM-Composite (Gold-Stocks-Bond) Timer which holds two ETFs concurrently (32% weight in the combo),
- the iM-Composite-(SH-RSP) Timer which holds only one ETF at any time (16% weight in the combo),
- the iM-Best7(HiD-LoV) which typically holds seven stocks concurrently (together all seven stock positions have a 35% weight in the combo, 5% weight for each stock).
- This combination model therefore always holds at any time four ETFs approximately equal weight, seven S&P 500 stocks, and 1% cash.
The combo showed a 22.2% annualized return with a maximum drawdown of -7.7% when backtested from Jan-2000 to Apr-2017 on the simulation platform Portfolio 123. Trading costs of 0.1% of all trade amounts were applied to provide for slippage and broker commission. Also when the asset tolerance exceeds 5%, rebalancing is required to maintain the specific asset allocation .
ETFs and Stocks
Gold:
· SPDR Gold Shares (GLD)
TIPS Fund:
· Schwab US TIPS ETF (SCHP)
Bond Funds:
· Vanguard Interm-Term Bond ETF (BIV)
· iShares iBoxx Invst-Grade Crp Bond (LQD)
· iShares 7-10 Year Treasury Bond (IEF)
Stock Funds:
· Vanguard Value ETF (VTV)
· Vanguard Mid-Cap Value ETF (VOE)
· Guggenheim S&P 500 Equal Weight ETF (RSP)
· ProShares Short S&P500 (SH)
Stocks:
· High dividend, low volatility S&P 500 stocks yielding significantly more than the average yield of the index and which also have a low 3-yr beta.
(Note: P123 provides extended price data for ETFs prior to their inception dates calculated from their proxies.)
Historic performance
|
Investment |
No. of trades |
No. of trades |
% average |
Avg. No. of Days |
|
Gold ETF |
7 |
0 |
0.64% |
463 |
|
Stocks & Stock ETFs |
318 |
125 |
0.53% |
112 |
|
Bond ETFs |
53 |
36 |
0.08% |
118 |
In the model the average weekly return for bond ETFs is much lower than for gold and stock trades. Thus shorter-term bond funds could be used without affecting performance too much. For example, when replacing BIV with BSV, LQD with SHY, IEF with SHV, and SCHP with VTIP, the annualized return becomes 19.79% with a -7.57% minimum drawdown.
Performance
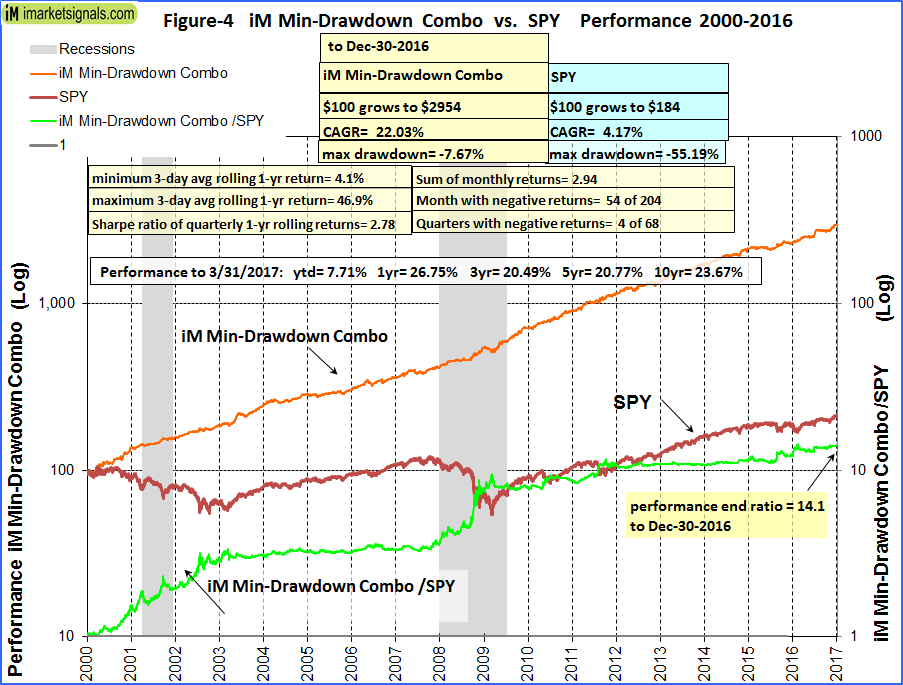
The simulated performance from Jan-2000 to Apr-2017 is shown in Figure-1. The red graph represents the performance of the model and the blue graph shows the corresponding performance of benchmark SPDR S&P 500 ETF (SPY). For the backtest period the simulated annualized return was 22.2% with a -7.7% maximum drawdown.
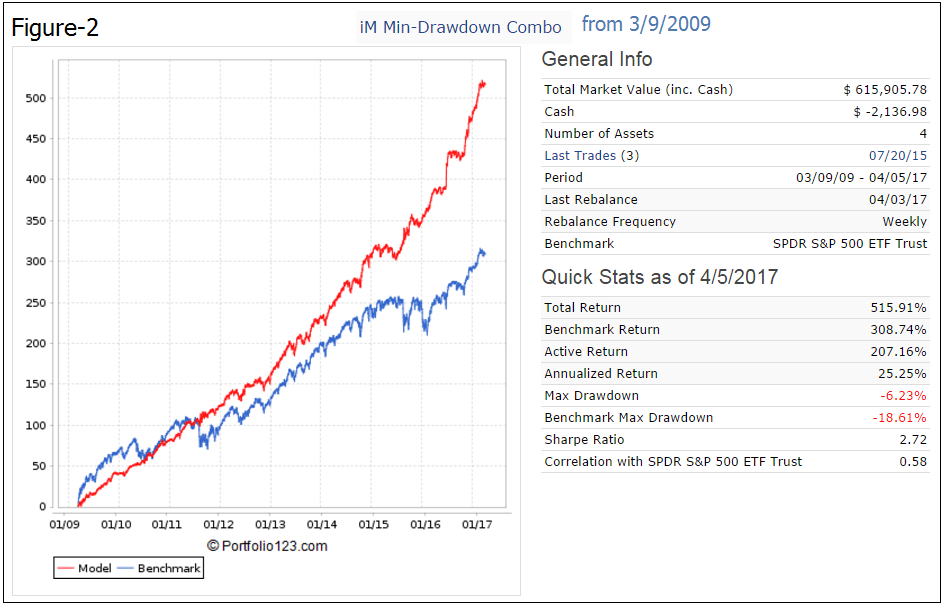
The simulated performance from Mar-2009 to Apr-2017 is shown in Figure-2. The start date for this period is the date when the S&P 500 was at its lowest level during the financial crisis recession. For the 8-year backtest period the simulated annualized return was 25.3% with a maximum drawdown of -6.2%. The model out-performed with much lower drawdown the SPDR S&P 500 ETF (SPY).
The simulated 2-year performance from Apr-2015 to Apr-2017 is shown in Figure-2. The model avoided the two market correction periods and showed a maximum drawdown of -4.3% versus -13.0% for SPY.
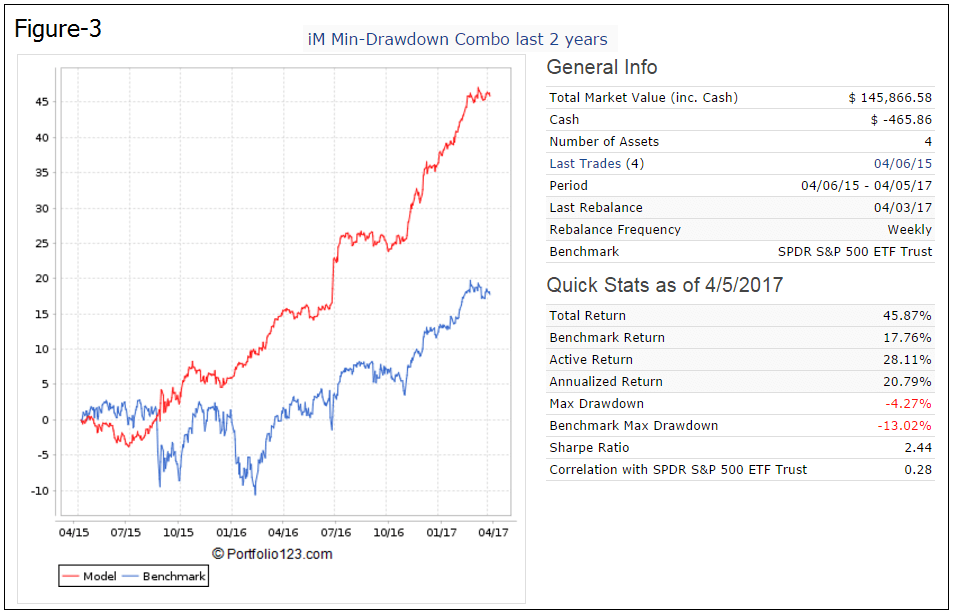
Table 1 shows the realized trades analysis for the combination model. There were 539 realized trades.
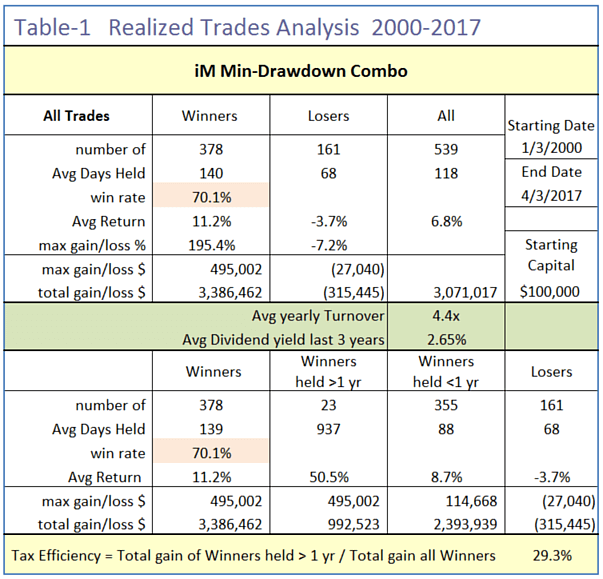
Holding periods and number of trades are listed below. Positions were held for an average of 118 days, winners for 140 days, and losers for 68 days.
|
Holding period |
Number of trades Jan-2000 to Apr-2017 |
|
13-21 days |
27 |
|
22-42 days |
160 |
|
43-92 days |
177 |
|
93-183 days |
116 |
|
184-240 days |
21 |
|
241-365 days |
15 |
|
More than a year |
23 |
Number of trades per year ranged from a minimum of 15 trades in 2002, to a maximum of 48 trades in 2000. On average there were 31 trades per year.
Table 2 shows the performance statistics for the combination model. It never made a loss over a calendar year. The worst performance was for 2005, similar as for benchmark SPY.
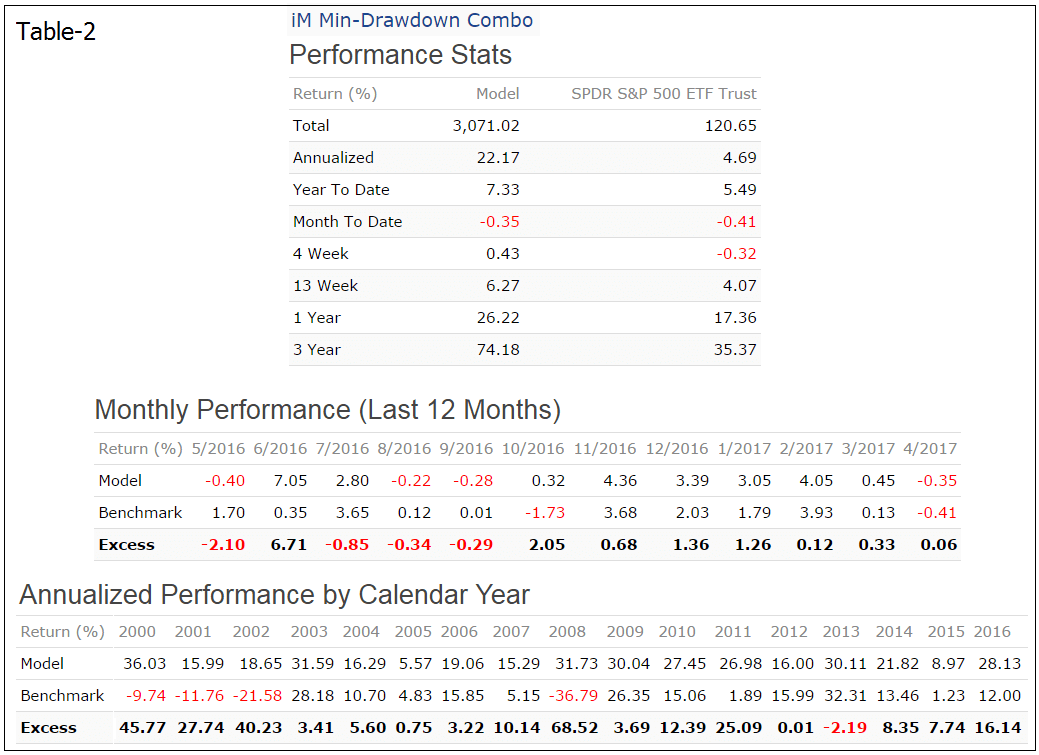
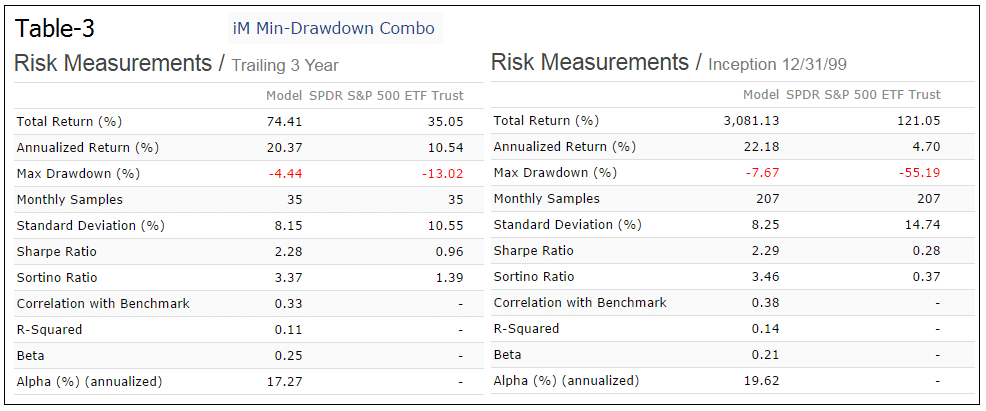
Table-3 gives risk measurements for the preceding 3-years and for the entire backtest period.
Following the model
This model could be of interest to investors who can accept a moderate amount of trading activity, but may not be suitable for mutual fund investors. During up-market periods the model did perform better than the benchmark SPY, and the various market timers built into the algorithms of component-models should prevent major drawdowns during down-market periods.
Also, in anticipation of rising interest rates it may be prudent to replace the bond ETFs with shorter-term bond ETFs which would have resulted in lowering the annualized return by only about 2.4% over the full backtest period.
On iMarketSignals we will report the performance of this combination model, with weekly trading signals normally provided on Sundays to Gold level members.
Appendix
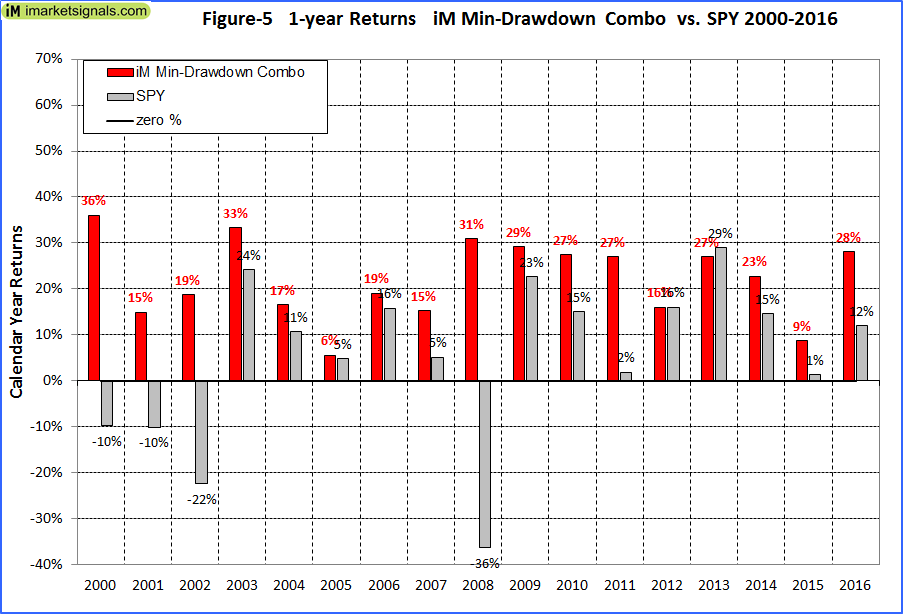
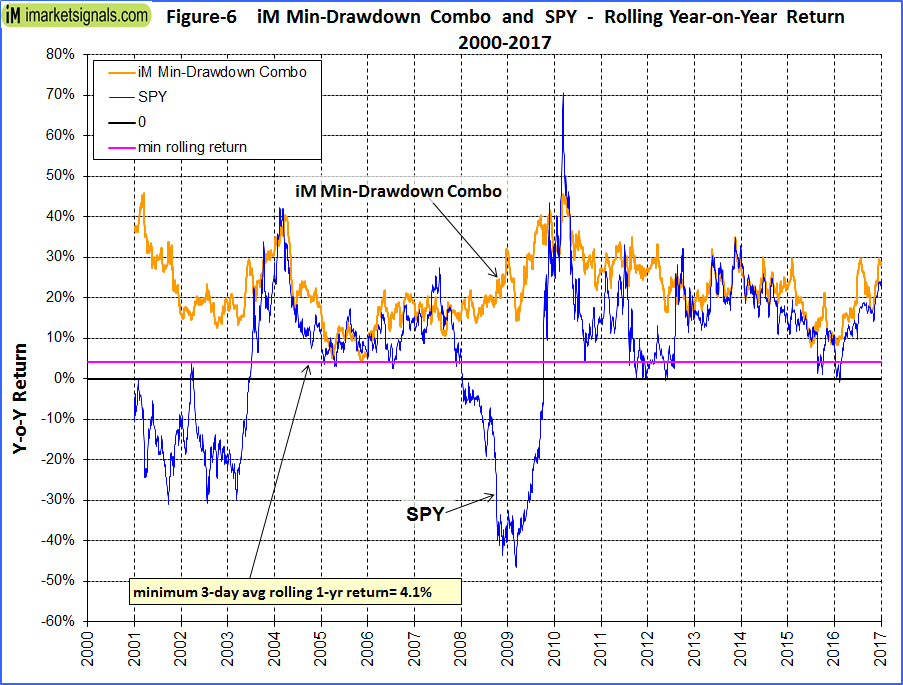
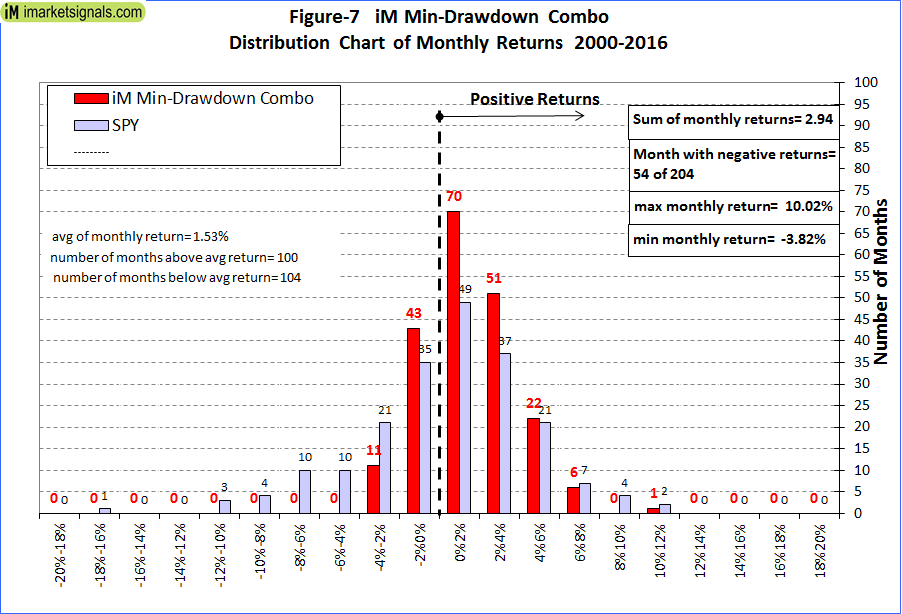
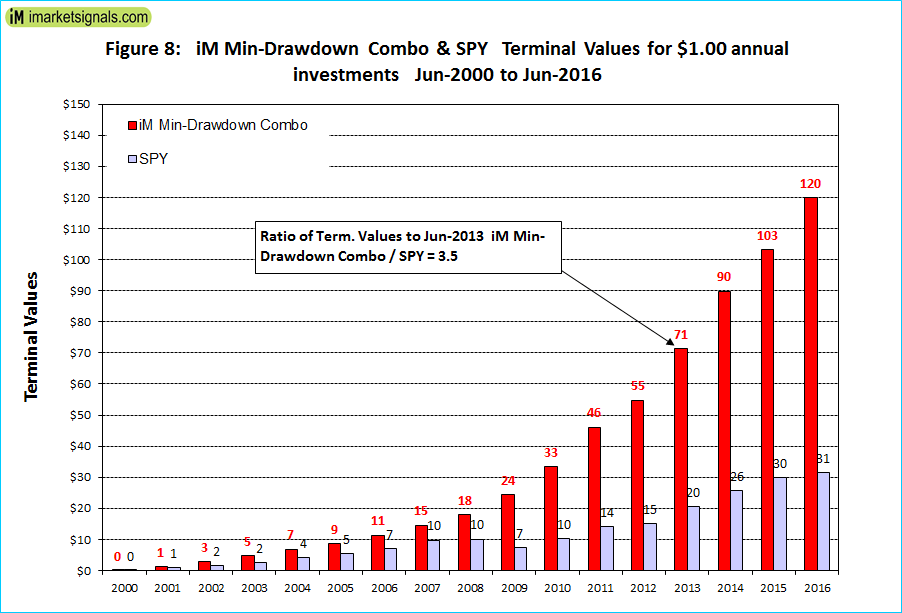
Further detailed analysis is presented in Figure-4 to Figure-8.
Disclaimer
Note: All performance results are hypothetical and the result of backtesting over the period 2000 to 2017. Out-of-sample performance may be different. No claim is made about future performance.
Anton & Georg,
Thanks for this fantastic new Combo. Truly amazing results in the backtest.
Once again the value of a Gold subscription validated.
You have provided the correlation of this model to SPY for various time frames. Would it be possible to report correlation with TLT or VUSTX in various time frames?
RV
Annual returns: Combo versus TLT
…. … Combo … TLT
2000 … 36.03% … 21.23%
2001 … 14.94% … 2.53%
2002 … 18.73% … 18.62%
2003 … 33.29% … 4.33%
2004 … 16.55% … 10.08%
2005 … 5.57% … 8.58%
2006 … 19.06% … 0.80%
2007 … 15.29% … 10.26%
2008 … 30.92% … 32.06%
2009 … 29.20% … -20.02%
2010 … 27.45% … 9.08%
2011 … 26.98% … 33.97%
2012 … 16.00% … 2.74%
2013 … 27.04% … -12.46%
2014 … 22.75% … 26.91%
2015 … 8.77% … -2.83%
2016 … 28.13% … 1.18%
One other request. Could you please present results for a Basket comprising of 50% Combo6 and 50% New Min. Drawdown Combo?
Thanks
RV
Return and Risk does not improve for
iM Min-Drawdown Combo + Combo6
General Info
Total Market Value (inc. Cash) $ 3,339,538.72
Number of Assets 10
Period 12/31/99 – 04/07/17
Benchmark SPDR S&P 500 ETF Trust
Quick Stats as of 4/7/2017
Total Return 3,239.54%
Benchmark Return 121.05%
Active Return 3,118.49%
Annualized Return 22.53%
Max Drawdown -7.00%
Benchmark Max Drawdown -55.19%
Sharpe Ratio 2.32
Correlation with SPDR S&P 500 ETF Trust 0.45
Thanks Georg. In what year does the Max Drawdown occur in Combo6? Does the max drawdown in the new min. Drawdown combo also occur in the same year?
In other words, I was surprised that the iM Min-Drawdown Combo + Combo6 still gets a max. Drawdown of 7%, which tells me that the drawdown occurs in the same year for both.
If for example, max. Drawdown of 9% occurs in Combo6 in 2008 and max. Drawdown of 7.7% occurs in the new Combo in 2001, then I would hope that the max. Drawdown would go down to say 5% for the 50-50 portfolio, while CAGR still stays in the 22-24%.
RV
Max Drawdown Combo6 -9.05% in July 2010.
Max Drawdown min D/D Combo -7.67% in March 2009.
Georg, does the gold-stock-bond portion require 6 week hold in this model?
Yes, look at Figure-1, bottom right corner, where the component models are listed.
what would be the implication for return & drawdown if one were to use your iM-Composite (Gold-Stocks-Bond) Timer (the one without the 6-week hold)?
-thanks
For a combo with Composite (Gold-Stocks-Bond) Timer (the one without the 6-week hold) the drawdown gets a bit higher -10.4%, versus -7.7%.
Quick Stats as of 4/21/2017
Total Return 4,019.07%
Benchmark Return 120.47%
Active Return 3,898.60%
Annualized Return 23.97%
Max Drawdown -10.44%
Sharpe Ratio 2.22
Georg, what is the advantage of this combo over simply combining the iM-Composite Timer (SPY-IEF), the iM-Composite (Gold-Stocks-Bond) Timer, and the iM-Composite-(SH-RSP) Timer systems? Perhaps equal weight the three systems. Can you give us perfomance numbers for that?
Georg,
I would be interested in this data as well.
Thnx
iM Composite Market Timer Stocks/Bonds (SPY-IEF) 33%
iM-Composite(SH-RSP) Timer with Standard & Composite Timer rules 33%
iM-Composite Mkt Timer(GLD&SCHP+VTV&VOE+BIV&LQD) – 6-weeks hold 33%
Number of Assets 3
Period 12/31/99 – 04/21/17
Benchmark SPDR S&P 500 ETF Trust
Quick Stats as of 4/21/2017
Total Return 2,512.15%
Benchmark Return 120.47%
Active Return 2,391.68%
Annualized Return 20.75%
Max Drawdown -13.17%
Sharpe Ratio 2.04
Hi Anton and Georg
What do you think about a 50% hedge for the HiD-LoV portion of this strategy when either the Composite or Standard Market Timer is on??
As mentioned in the model description there are some market timing rules built into the Best7(HiD-LoV)which stops buying stocks during weak markets and the model holds cash.
Simulated performance improves a bit using Standard Market Timer signals. Shortening SPY with 50% of Total Equity (Includes cash) pushes the annualized return up from 25.9% with min.D/D of -14.4% to 29.7% with min.D/D of -13.5%. There were 10 periods involved over the 2000-2017 backtest period.
The iM-Composite Timer(SPY-IEF) based on 6 component models signaled 36 periods when it went to IEF. Shortening SPY with 50% of Total Equity (Includes cash) pushes the annualized return up to 28.8% with min.D/D of -14.4%.
Hi Georg
Thanks but didn’t quite understand your response. What do you mean by ‘shortening SPY with 50% of Total Equity (includes cash)’ – for the iM-Composite Timer(SPY-IEF).
Do you mean selling 1/2 of the SPY position (holding the other half) and buying SH – instead of going to IEF when there is a signal change??
Good strategy………Many thanks,
Vman
Taking a short position does not imply selling any shares. In this case one would short SPY with a value of half of the market value of the long positions.
can you tell me when each of these four individual models were availible to members? In other words, how long have they actually been IM models and not simply back testing works-in -progress?
the iM-Composite Timer (SPY-IEF) 9/30/2016
the iM-Composite Timer(GLD&SCHP+VTV&VOE+BIV&LQD) based on the iM-Composite (Gold-Stocks-Bond) 1/27/2017
the iM-Composite-(SH-RSP) Timer 10/18/2016
the iM-Best7(HiD-LoV) 6/30/2016
With the six week minimum hold on LQD, what do we do with the GLD pending purchase?
Please ignore the 6-weeks hold for this trade.
We determine trades on Sundays by checking what the model will do after rebalancing it. The models are rebalanced automatically by P123 late Sunday evening when all the data is available. Sometimes the signal from the automatic rebalancing does not match the signal we got earlier. Last week we got the signal to buy LQD, but the automatic rebalancing did not buy LQD but GLD instead. So we are making the adjustment today.
Any YTD data on this model?
thanks
Period 01/02/17 – 05/22/17
Last Rebalance 05/22/17
Rebalance Frequency Weekly
Benchmark SPDR S&P 500 ETF Trust
Quick Stats as of 5/22/2017
Total Return 7.15%
Benchmark Return 6.80%
Active Return 0.34%
Annualized Return 19.73%
Max Drawdown -1.61%
Benchmark Max Drawdown -2.61%
Very interesting approach combining these strategies. Couple of questions. Are the drawdown rates based on monthly or daily values? I couldn’t find a good discussion about the robustness of the parameters or to what extent their optimized to better understand how much overfitting exists within the backtest simulated results; is there a sensitivity analysis of the parameters used or a blog entry that better describes these? MAR > 2, MaxDD 20% is…well…exceptional.
Performance and draw-down is based on daily values.
There are 4 models in the combination. Please follow the links to the component models (in the bullet points of the model description) to assess robustness.
What are the returns and drawdown if just the ETF portion of the model is used and iM-Best7(HiD-LoV) is not included? So 25% equal weight of the ETFs? Thanks!
Without Best7:
Period 12/31/99 – 08/17/17
Quick Stats as of 8/17/2017
Total Return 2,318.40%
Annualized Return 19.81%
Max Drawdown -11.26%
Sharpe Ratio 2.03
Is the last 3 years average annual dividend of 2.65% included in the performance returns??
Thanks!
VMan
Is the 2.65% average annual dividend included in the performance results??
Thank you
Vman
Dividends are included in performance results.
Hi,
shouldn’t be the model be in SPY?
Is written IEF but I don’t see any change in the weeks before besides sell IEF buy SPY.
Yes, it should be in SPY.
Thanks for reporting.