
Using our three ETF models, Best(SPY-SH), Best1(Sector SPDR) and Best(SSO-TLT) equal weighted in a combination model, we demonstrate that the combo would have produced high annualized returns with low drawdowns and low volatility. Additionally, due to the very high liquidity of its component ETFs, the combo could support a huge portfolio size.
Performance
The simulated trading performance of the system is shown in Figure 1 below. The annualized return from January 2000 to end of December 2013 was 34.3%; $100 grew to $6,230 over this period. The maximum drawdown was -12.9% in October 2002. All values are with dividends reinvested.
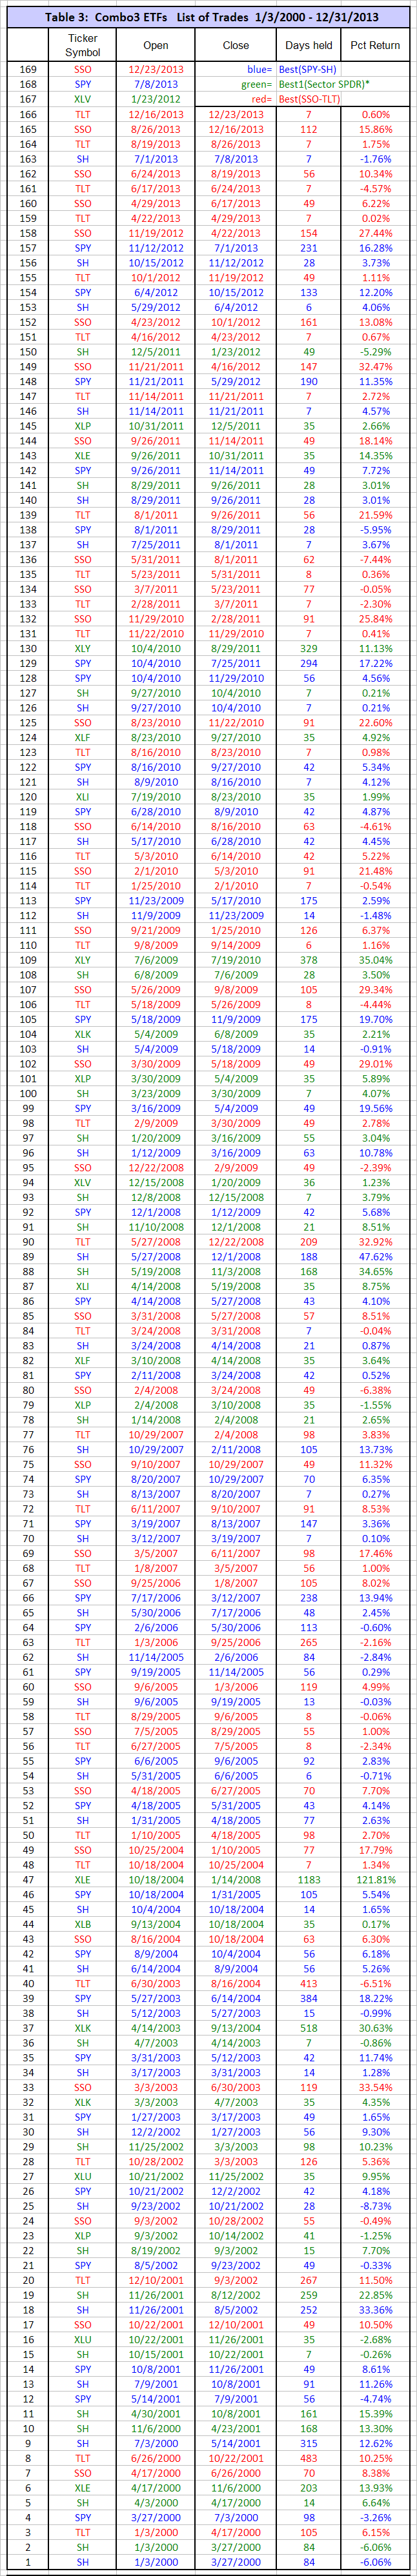
The model assumes an initial investment on Jan-3,2000. It holds three ETFs, one from each component model. To December 31, 2013 there were 166 trades completed, 130 of these were winners and 16 losers, as listed in Table 3 in the Appendix. The percentage gains/losses shown in Table 3 include transaction costs of 0.1% of the trade amount arising from brokerage fees and slippage. The number of trades ranged from 4 to 19 per year, with the average being 12 trades per year.
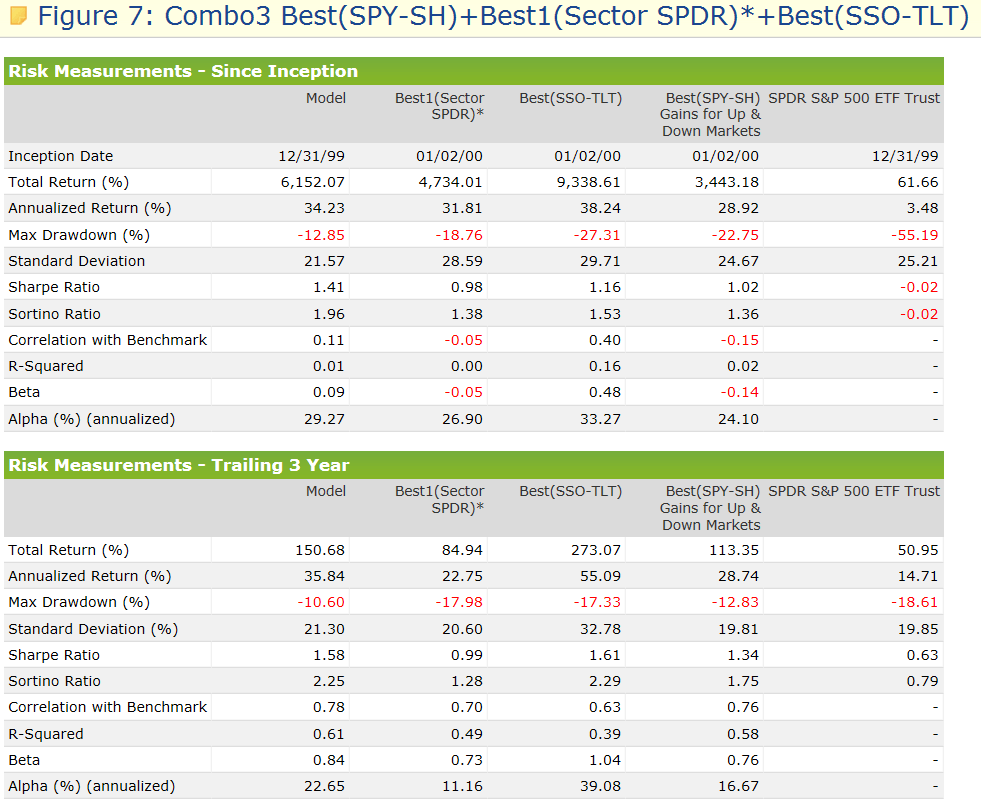
Risk measures for Combo3 and for the component models are shown in Figure 7 in the Appendix. All risk measures for Combo3 are better than for the individual component models.
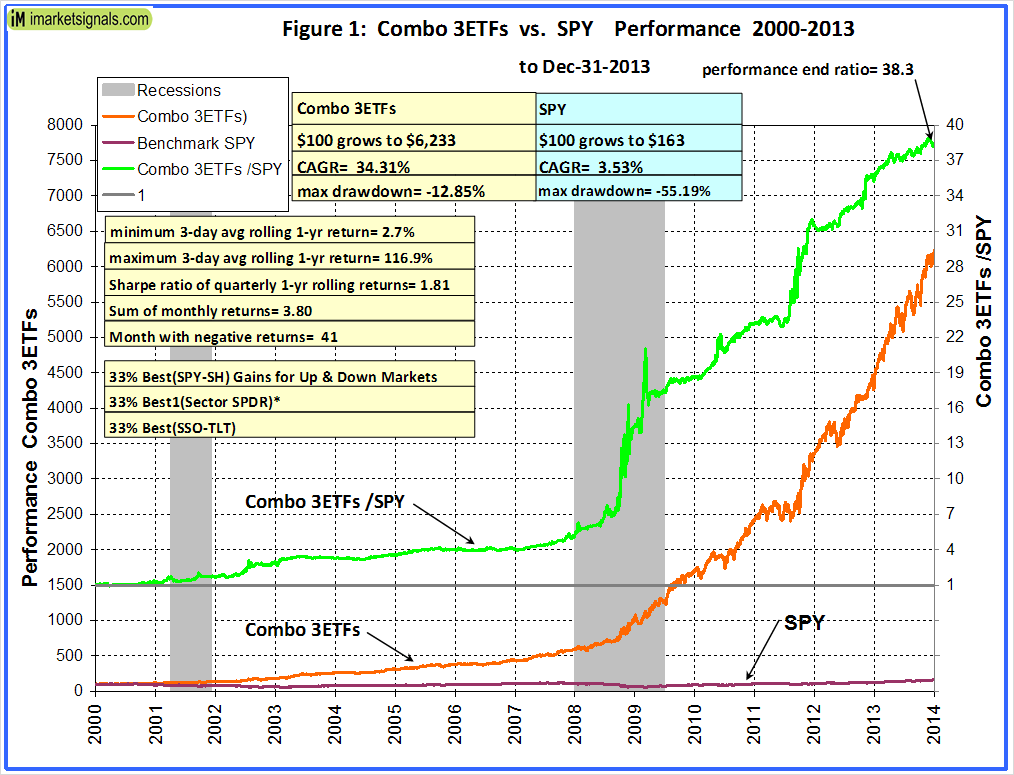
In above chart, the upper green graph is the performance ratio of the Combo3 to SPY. A rising trend of that graph indicates when Combo outperformed SPY; it produced about 38 times the value which one would have had from a buy-and-hold investment in SPY over the same period. One can see from the ratio graph that Combo3 out-performed SPY every year.
Annual Returns
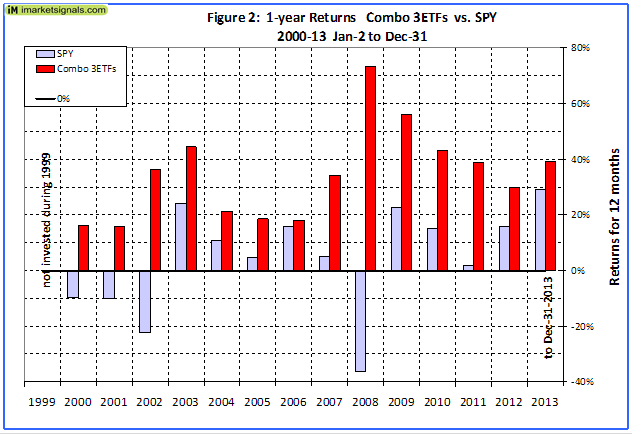 Annual performance from January to December ranged from a maximum of 73% for 2008 to a minimum of 16% for 2000 and 2001, as can be seen in Figure 2. There was never a loss over those periods.
Rolling 1-year returns
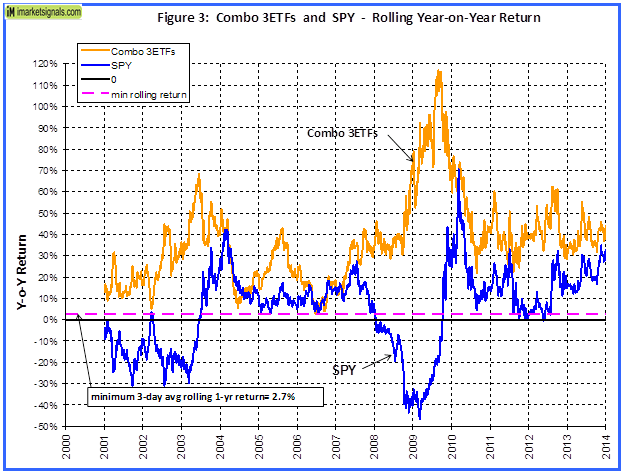 Figure 3 shows the rolling 1-year returns starting each trading day from 2000 to 2012. The minimum return over 12 months was 2.7% and the maximum was about 115%.
2-year Returns
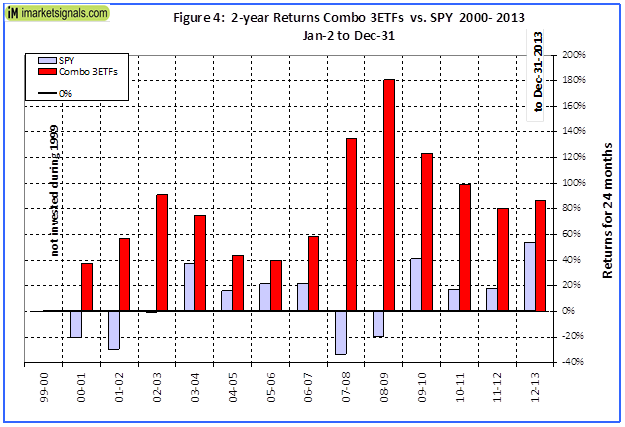 2-year performance from January to December ranged from a maximum of 180% for 2008-09 to a minimum of 38% for 2000-01, as can be seen in Figure 4.
Distribution of Monthly Returns
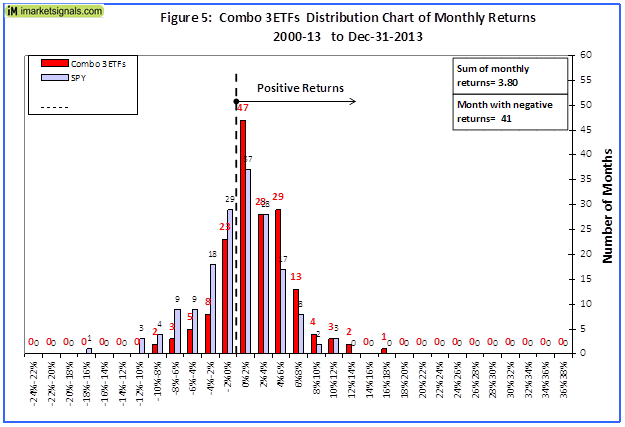 Figure 5 shows the distribution of monthly returns. There were a total of 168 months in the period under consideration. Combo3 produced positive returns during 127 months and only 41 months had negative returns, as is evident from the chart above. SPY had 73 months of negative returns.
Investment Periods
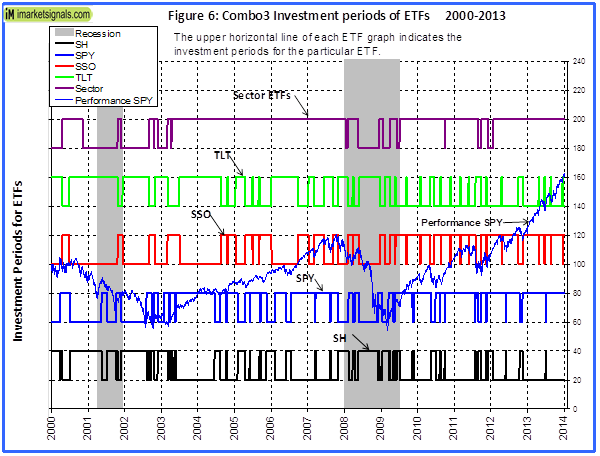 Figure 6 shows graphically the investment periods for the various ETFs in Combo3, which are listed in Table 3.
Terminal Values
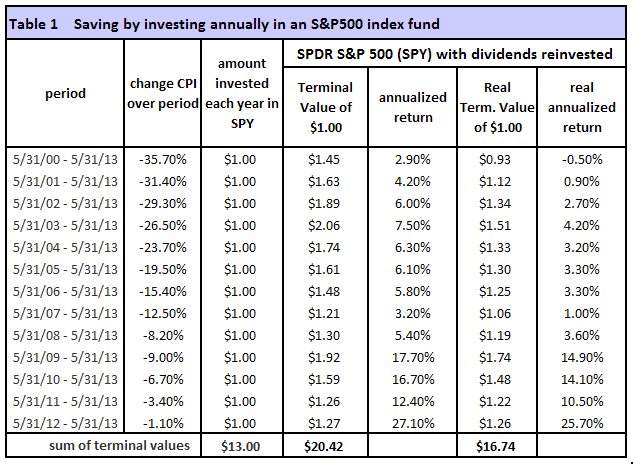
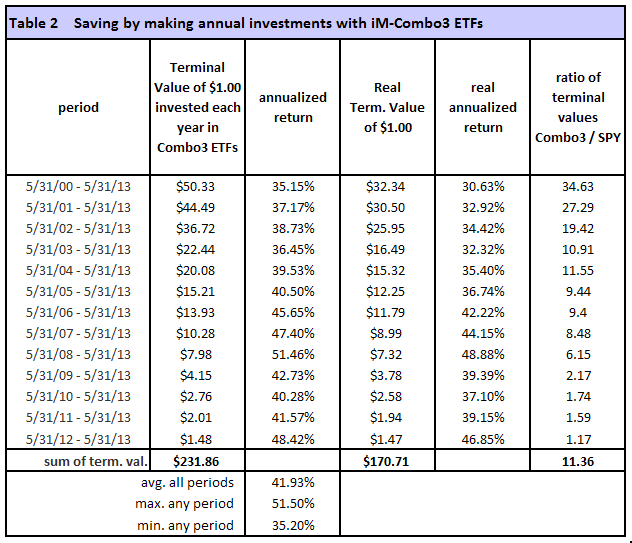
To simulate savings over time, terminal values were calculated to the end of May 2013 for annual hypothetical investments of $1. Starting with a dollar during each of the 13 years from 2000 to 2012, one would have invested a total of $13 cumulatively by the end. Summing the 13 terminal values, this strategy would have netted this dollar-per-year investor $232 at the end of 13 years.
Following a buy-and-hold strategy in SPY, one would have only $22, about 9% of what Combo3 provided. Furthermore, the lowest annualized return, for any of the 14 time periods was 35% and the average for all the periods was 42%.
This is shown in Table 1 and 2 in the Appendix.
Correlation between component models
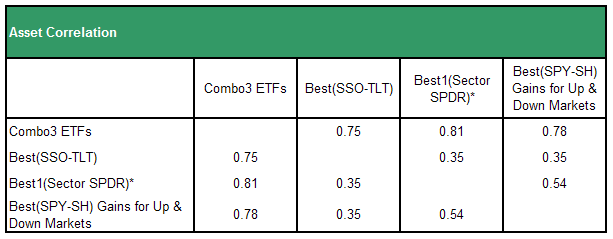
The correlation between the component models is fairly low, with 1.0 signifying 100% correlation.
Note: Based on the simulated past performance one could expect this combination model to continue to perform well. However, be aware that all performance results are hypothetical and the result of backtesting only. Out-of-sample performance may be much different. We can make no claims about future performance of this signal, which may include significant potential for losses.
Appendix
Risk Measurements
iM-Best Systems
Quick Comparison
Quick Links to Model Descriptions
R2G & iM(Silver) iM-Best10(S&P 1500): A Portfolio Management System for High Returns from the S&P 1500
R2G iM-Best9(Russell 1000) – Large-Cap Portfolio Management System
R2G iM-Best8+ Portfolio Management System
iM(Gold) iM’s Best12(USMV)-Trader Minimum Volatility Stocks
iM(Gold) iM’s Best12(USMV)Q1..4-Investor Minimum Volatility Stocks (The Q3 model available to Silver)
iM(Silver) iM-Best10(VDIGX) Trading the Dividend Growth Stocks VDIGX
R2G & iM(Silver) iM-Best(SPY-SH) Market Timing System: Gains for Up and Down Markets
R2G & iM(Gold) iM-Best1(Sector SPDR) Rotation System
R2G & iM(Gold) iM-Best(SSO-TLT) Switching System
iM(Gold) iM-Best Combo3: Best(SPY-SH) + Best1(Sector SPDR) + Best(SSO-TLT)
iM-Best(SPY-Cash) Market Timing System
iM-Best(SSO-SDS): Beating the Market with Leveraged ETFs
Survivorship Bias: neither Myth nor Fact
Quick Links to Ready-2-Go Models
Best(SPY-SH) Gains for Up & Down Markets
When subscribing to P123 please use this link or enter token IMARKETSIGNALS when registering to obtain 30 days free membership.
Disclaimer: The opinions in this document are for informational and educational purposes only and are obtained from a mathematical algorithm and should not be construed as a recommendation to buy or sell the stocks mentioned. Past performance of the companies may not continue and the companies’ stock values may decline. The information in this document is believed to be accurate and represents the output of a mathematical algorithm, and under no circumstances should a person act upon the information contained within. We do not recommend that anyone act upon any investment information without first consulting an investment advisor as to the suitability of such investments for his specific situation. Also see our Terms of Use/Disclaimer.
I would like to subscribe to these three etf strategies on this web site! I’m will to pay! I really don’t want to deal with portfolio123… thanks greg
Combo3 holdings are emailed to the people on the current Best(SPY-SH) list at iM. This Sunday 1-26-14 was the first transmittal. There will be a charge for this service in the future. We will announce our fee structure soon.
This combination of 3 models looks great, but it does create a few ‘strange bed fellows’ where both Spy and SH are held at the same time (eg Table 3 #148&150, #99&100).
Since ETFs have overhead expenses and fees, it would seem better to go to cash than to hold such opposing positions. (Although tax considerations might dictate otherwise).
A similar (but more complex relationship) also happens with SSO and SH, eg 149&150, 152&153.
I would guess that Portfolio123 combo emulations do not provide a way to go to cash instead of taking opposing positions. Is that right? (Nor does it consider tax consequences of long term vs short term cap gains?)
-Rob
The fact that a hedged situation sometimes occurs is due to the low correlation between the models. This is a positive for combo3. If all models were always signaling the same, you would really not have a combo model, but a single model.
P123 simulations for a combo do not provide for going to cash instead of taking opposite positions, nor do they take tax consequences into account.
It is up to the user to make those decisions themselves.
I agree with greg111…I would like to also avoid Portfolio123 and subscribe directly to this web site.
Bud
Bud, please see my reply to Greg.
Georg, what do your findings show as to the best time to get into a combo? Is the best time when there is a “new” signal or just get on any given day even though prices could be at their peak or possibly about to make a change in which we wouldn’t have any advance knowledge of.
Thank You!
Ramona
Ramona, you are asking for investment advice. You should know that we are not investment advisers – so we can’t answer your question.
Georg–I just subscribed to this, and have questions:
1) Do you have a monthly history of holdings for the backtest period? I could construct one but it would take some time.
2) I guess the proof of the strategy will be how it acts during various types of market conditions in the future. Did you do any out of sample testing?
3) What is the relevance of stressing “web based trading application” ?
Thanks
Lynn Boyd
Lynn,
1)Combo3 holdings are listed in Table-3 and shown in Figure-6 of the model description. They have not been sorted by month.
2)Out of sample testing has not been done.
3)Web based trading application means P123 – we do not want to advertise them in the article, but links to their website are just above this comment section.
Georg,
Model question. You mention that the model is equally waited between the three ETF’s (one from each sub model). Does the model rebalance between each of the three ETF’s every week to keep them equally weighted or is the model equally weighted only at the start of the simulation?
Thanks
Rand
Rand,
The model is re-balanced every week so that the three component models have equal weight, with the minimum re-balance transaction being $1,000.
Georg,
In the track record for the Best Combo 3, there are two purchases of SPY on the same day (10/4/2010) and each purchase has a different closing date.
On 1/3/2000 and 9/27/2010, an SH purchase was repeated twice, this time with the same closing day.
On 7/3/2000, 11/6/2000 and 4/30/2001, there are 3 consecutive purchases of SH without intervening switch to SPY
Errors?
Thanks,
Michel
Michel,
re: there are two purchases of SPY on the same day (10/4/2010) and each purchase has a different closing date.
This is not a mistake and can happen when the stock satisfies both the buy and sell rules simultaneously. The portfolio is selling a stock position and then immediately buying it back with a different quantity. Only the difference between the buy and sell quantity is reported, which for the transaction 10/4/10 – 11/29/10 was for one unit only and had no meaningful influence on the performance of the model.
re: On 1/3/2000 and 9/27/2010, an SH purchase was repeated twice.
You can see that those transactions were color coded green and blue, meaning that they came from different models, namely the Sector and SPY-SH models, respectively.
re:On 7/3/2000, 11/6/2000 and 4/30/2001, there are 3 consecutive purchases of SH without intervening switch to SPY.
These are purchases of the combination, only one component model switches between SPY-SH. The same answer as above applies.
Is there a stop loss on any of the securites in the three portfolios? If so, what is it and what is the criteria for getting invested again.
Thanks
There are 8% from-recent-high stop-loss provisions for SPY and SH in the Best(SPY-SH)model. When they cause a sale of one security the model buys the other security.
There is a 10% from-recent-high stop-loss provisions for SH in the Best1(Sector SPDR)model.
There are no stop-loss provisions in Best(SSO-TLT).
IF your model says to hold a security but you switch out becasue of the stop/loss, and the model still says to hold the original security over the next weekend, what will happen and how will the portfolio get corrected back to the model’s signals?
Also, will you give intraweek updates when the stop loss is triggered?
The models are rebalanced on weekends using the Friday closing prices. If there is a stop-loss happening say on a Tuesday, this will be reflected as a trade signal after the model is rebalanced, and the model would sell the ETF concerned on Monday and switch to the other ETF in the model.
We cannot give intraweek updates because we would only know about the stop-loss sale on the weekend.
Georg– do you plan to respond to subscriber questions–if so, what is your policy regarding timing etc?
Lynn Boyd
Lynn – we endeavor to reply to all questions within two days.
Georg–please see my questions of Feb 1 above.
Thanks
Lynn Boyd
The question has been answered.
Thanks.
Hi Georg, I have considerable respect for your models and have just signed up to gold membership. Nonetheless I am concerned about the reliability of market timing models generally, particularly to anticipate market corrections. Your model algorithms are tested over just 32 switches, far less than for your stock selection models. Also, a week is a long time in the markets. Question 1: Have you have looked at daily signal and if that improves performance/reliability over weekly signals? Question 2: In your weekly report could you perhaps give the status for each component of your timing models, eg VIX, Risk Premia, EPS, MACD with a red or green marker (or better still 0 to 5 scale) against each? Last week my emotions got the better of me and I cashed out, with a bit more information (hand holding….) I may have been able to hold on :) Keep up the good work, bests, mike
The three models of Combo3 were designed to indicate major market movements. They will not signal market tops or bottoms or minor market corrections. Daily rebalancing does not improve the reliability of the signals.
I agree that it would be useful to chart the market-timing components in a way which could indicate market risk. However, this will need some time to implement.
Georg,
I see on the Portfolio123 site you have the Return/MaxDD for the SSO-TLT portfolio when SPY is used rather than SSO. I wonder if you could post the performance for the iM-BestCombo3 if SPY is used rather than SSO.
Thanks
Performance 2000 to 2014 for the iM-BestCombo3 if SPY is used rather than SSO in the component model Best(SSO-TLT):
Annualized Return= 29.01%
max drawdown= -11.11%
Sharpe = 1.65
Sortino= 2.28
Trailing 3 years:
Annualized Return= 28.69%
max drawdown= -7.58%
Sharpe = 2.00
Sortino= 2.90
Thanks Georg,
Can I impose on your kindness once again and ask what the combo3 performance would be with SPY instead of SSO as well as going to cash rather than SH. My wife is very conservative:).
Thanks
Performance Jan 2000 to end of Feb 2014 for the iM-BestCombo3 if SPY is used rather than SSO in the component model Best(SSO-TLT)and cash is used for SH in the component model Best(SPY-SH):
Annualized Return= 24.85%
max drawdown= -10.79%
Sharpe = 1.60
Sortino= 2.30
Trailing 3 years:
Annualized Return= 26.73%
max drawdown= -7.13%
Sharpe = 1.88
Sortino= 2.68
Min 1-year rolling return= 3.6%
For the combo model Monday 4/21 you recommended selling TLT and buying SSO. You have a SSO price of 104.44. How was that price determined?
The open price was 104.48 the close was 105.16 the high was 105.19 the low was 104.21 and the average high/low was 104.70. I was under the impression that for trading all the combo model components you had decided to use the closing prices. For each of the models of the combo iM-Best, how are the prices determined?
I have referred this to P123 for an explanation.
https://www.portfolio123.com/mvnforum/viewthread_thread,7520_lastpage,yes#37964
Thanks for bringing this to our attention.
I remember reading that the SPY-SH model was upgraded to have an automatic signal reversal once losses hit 7.5%..Is currently shows a loss of 7.97! Please advise.
Thanks, Fred
Please see comments for Best(SPY-SH).
https://imarketsignals.com/2013/im-bestspy-sh-market-timing-system-gains-for-up-and-down-markets/#comments
plz publish the 2014 return for the combo 3 thanx
Please see Table iM System Performance – Jan 3, 2015 at bottom of Home page.
I can’t find iM System Performance – Jan 3, 2015 on the Home Page — can you post a link?
Thanks.
That is because it has been replaced with the performance report of February 6, 2015.
Here is the link to the Jan 3, 2015 performance report
Hi Anton or Georg,
Can you give me the CAGR and max drawdowns for the Combo 3 but only using a “Combo 2” of the Best1(Sector SPDR) and the Best(SSO-TLT)?
Thanks.
Combo2(Best1(Sector SPDR) + Best(SSO-TLT)) CAGR estimate for 4/30/2015:
Since Inception 1/3/2000: 35.1%
10yr: 39.9%
5yr: 35.2%
3yr: 30.9%
1yr: 32.47%
ytd: 8.4%
Max Drawdown: 17.5%
Above is calculated from the returns of the individual models and not by simmulation, assumes regular rebalancing for a 50:50 value distribution of Best1(Sector SPDR) and Best(SSO-TLT), and does not include trading costs for this rebalancing.
Georg,
Is it possible to have the combo3 and the SSO-TLT model back test data updated using the different bond funds that would have been recommended by your BVR work rather than just TLT?
Thanks,
Jon
Jon,
One could do this by taking every period when the model was in TLT and checking the corresponding BVR signal. If BVR signals investment in short-bonds then one could use SHY instead of TLT. This would be valuable information and time permitting we should do this study.
Thank you for the suggestion.
Georg,
If you do the study some day where will we find it? This website is getting more dense and it is harder to track/find all the new info sometimes.
Thanks,
Jon
We are planning a monthly newsletter to announce newsworthy additions to iM, such as studies, new models, etc.
I am interested in your strategy Best1(Sector- SPDR)
I have two questions:
Can you provide ranking say at least 3 strongest sector ETFs instead to give only one best single ETF?
Have you considered to use instead sector ETF corresponding leveraged Sector ETF e.g., instead XLV to buy CURE.
If yes, what will be max DD?
Currently there are no plans to provide a listing of the highest ranked sector ETFs.
CURE is Direxion Daily Healthcare Bull 3X Shares which has only been in existence for about 4 years. Our backtesting is typically done over the last 15 years and CURE cannot be used for it.
Is there a reason why you are so late in updating the results of the Combo 3 strategy? Tables 1 through 3 go up to 2013. I think it would be of benefit to all subscribers if you could publish results updated every week. An equity curve of the strategy published weekly would allow people to time better their entry point into the strategy…for instance after there has been a substantial drawdown.
Thank you!
Michel
We update the component models of Combo3 every week. The second table on the home-page lists the holdings of the component models. Weekly performance is also on the home-page. Select Model Performance Tables: and view the second report.
I apologize if this has been asked before. For Best Combo3, does the published backtested performance reflect an entry/exit price of the Friday close or the Monday open? I ask because signal changes are provided on Sundays after the Friday close. If there is a lag, do you see this having a significant effect on returns?
Thanks!
Combo3 uses the Friday closing prices for the Monday trades. There is an adjustment for slippage of about 0.1% of the price. Since there are not many trades the historic returns should not be significantly affected.
Your Summary Page for Combo 3 for 8/31 email shows 2.02% for 1 week versus the website showing .89%. Is there an error?
The summary on the website is correct, there was an error in the updating of the table that was emailed and the 2.2% was actually the returns to Friday 8/28.
is it possible to avoid a 87 crash like situation with combo 3
We can only backtest the models to beginning of 1999. So we don’t know how the models would have performed prior to the crash of 1987.
hello, could you kindly tell me the risk reward if one replaces SH with cash, TLT with cash and SSO with QLD in the Best combo 3 model from june 2006 when QLD was introduced ?
The figures look good:
From 7/1/2006 to 9/22/2015:
CAGR= 29.1%
Max D/D= -15.83
Total return= 955.2%
Total return SPY= 84.5%
Hi Georg
The maximum drawdown for the Combo3 was -12.9% for the period 1/3/2000 – 12/31/2013. Has it worsened since 12/31/2013??
Thanks
Jim
The max drawdown has not changed, it is still at -12.85%. The annualized return for the model from 1/3/2000 to 9/22/2015 is 31.53%.
hello, could you kindly tell me the risk replaced TLT with cash and SSO with QLD in the Best combo 3 model from june 2006 when QLD was introduced ? thankyou for being so helpful.
From 7/1/2006 to 9/22/2015 (to make it comparable to previous comment):
Models: SPY-SH, Sector, QLD-Cash
CAGR= 35.96%
Max D/D= -13.68
Total return= 1603%
so when rebalancing once a month, you just sell the excess of one model and put it in the other models in the combo to make it even 33.3%?
and in the r2g book simulation transactions, if there were no transactions in a particular month it just means the 3 models were 33.3% so no rebalancing needed?correct?
sorry to ask so many questions, what date of the month is the rebalancing done?
sorry again. when rebalancing, you might end up buying a recommendation in a model at a totally different price than when it was recommended–are all these considerations taken into account when calculating the cagr of the combo3?
i got answers to my questions when i re-reviewed (; thanks for your good work.
Please confirm 66% cash, the model does not reflect this allocation
Combo3 holds SPY, SH, and SSO. Since SH is the inverse ETF of SPY it does not make sense to hold both SPY and SH, any gain in SPY will be offset by a loss in SH, and vice versa.
I understand that SH is the inverse of SPY and that any gain in SPY will be offset by a loss in SH. But your statement that it does not make sense to hold both SPY and SH seems contradictory to the iM-Combo3 recommendation to hold SPY and buy SH. Understand that the three underlying models are loosely correlated and hence this situation can result, but in the end, the recommendation is to hold two inverse ETFs for the time being.
We use 3 models in combination for Combo3. The models hold SPY, SH, and SSO. There is no recommendation to hold two inverse ETFs. Combo3 holds SPY, SH and SSO equal weight.
Users following the model must decide for themselves whether they want to hold SPY and SH simultaneously or not. In our opinion it does not make sense to hold both of them at the same time.
But it would be possible to hold SH x 2 if the SPY-SH model went to SH while the Sector model was in SH, right?
Yes, it is possible that Combo3 holds 2xSH.
Hi, do the published CAGR and returns reflect trades executed exactly as the models indicate, or are the computed going to cash when one model is in SPY and the other in SH? Thanks! Also, could you possibly tell me what the returns/drawdown would be like for combo 3 if instead of going to SH for the best sector model under adverse conditions, it went to cash? So SPY/SH, Best Sect/cash, SSO/TLT. thanks very much.
The Combo3 CAGR shown in the Model Performance Tables comes from the holdings as indicated. i.e. holding SPY and SH simultaneously.
A simulation for combo with SPY/SH, Best Sect/cash, SSO/TLT, from Jan-2000 to 12/2/2015:
CAGR= 28.39%
max D/D= -12.76%
Sharpe= 1.80
Simulation over the last 5 years:
CAGR= 29.90%
max D/D= -11.76%
Sharpe= 1.89
Hi Georg,
I have two new member questions, here. Is the weekly re-balancing critical? Would there be a huge difference in CAGR if this was done every other week, or perhaps just once monthly? Also, you have alluded to a minimum re-balance amount. What percentage of the account should I set as my minimum re-balance amount? Thanks! Your research and the service you are providing are very much appreciated!
Numejak
Combo3 does not produce signals every week. In fact there are very few signals generated by the three component models. So, if one wants to follow the models then one should follow the signals.
As to the proportion of cash allocated to each of the 3 ETFs it is not critical to rebalance this to equal weight weekly. A good rule of thumb would be only to adjust this when a positions is perhaps 10% over or under-weight.
Is this model available to silver members, or only gold? Thanks,
Andrew
Combo3 is available to silver and gold members. You can see all models available to silver members by clicking on the tab H2U, which will bring up a table of all the models, sorted for the various membership tiers.
Thanks; and are the signals emailed the day they occur, or is it only reported on Sunday? It’s kind of hard to tell from the table.
Models are rebalanced weekly on Saturday, with signals becoming available on Sundays, which are then emailed to subscribers and posted on the website under iM-Best Holdings
The SPY-SH model is currently signaling SH yet the SPY-IEF model is 100% SPY which is opposite that of SPY-SH. What is the best/proper way to interpret or reconcile these different models that seemingly show opposite signals? Also, currently the SSO-TLT model is signaling SSO (2x leveraged SPY), doesn’t this sort of cancel out the models that signal SH or IEF?
The SPY-IEF Timer is not the same as the SPY-SH model or the SSO-TLT model, nor is it the same as Combo3. If all the models were to produce the same signals simultaneously than one would only have one model.
If one follows Combo3 then currently the model is 2x long SPY, 1x long XLB, and 1x long SH, resulting in a net 1x long SPY and 1x long XLB, Thus Combo3 signals long 67%, and the Timer signals long 100%. That is not really all that much different.
It is up to investors to decide for themselves what percentage of their funds should be long the market, or they should consult a financial adviser. Our models are all mathematically driven and may at times generate opposing signals.
I am also anxiously awaiting a response to Peter’s question. I realize they are all separate models using different signals but I have also wondered the same thing.
Georg, in your honest opinion are you still comfortable with each of your models in the combo 3 (and also IEF/SPY) that rely on P123 data? Especially, but not limited to, the earnings estimate data?
I’m uncomfortable with the changes P123 has made and hope and pray that if you see something that appears to concerning to your models that you would notify your subscribers immediately.
We have had Combo3 on iM out-of-sample since 2-3-2014. As per update of 12-14-15 Combo3 generated a total return of 31.57% with a max D/D of -7.23%. SPY had a total return of 20.51% with a max D/D of -11.91% over the same period.
A simulation of Combo3 using the component models with all recent P123 data for the same time period as above shows a total return of 40.44% with a max D/D of -6.4%.
So it would appear that any recent changes to P123 data would have been beneficial for Combo3, if that data change had already happened prior to February 2014.
Does the backtest take in to account the constant weekly rebalancing to maintain the equal weighting even if the three ETF holdings don’t change? It seems to me you would have to make transactions every week just to maintain the equal weighting so there would be many more trades than the 169 you have listed, or is this all included in the total 169 trades?
Thanks
I’ve been exploring your website and I noticed your note about rebalancing to equal weight only if the transaction amount to rebalance a position is at least $1,000. So I’m still wondering if this was factored into the backtest performance.
Thanks
The Combo3 model is rebalanced weekly and the minimum re-balance transaction is specified to be $1,000. This is factored into the backtest and out-of-sample performance. The re-balance transactions are not counted in the number of trades figure.
People following the model must decide on their own when and how often they want to re-balance to equal weight.
Thanks Geovrba, for answering my question even though I finally noticed that you answered basically the same question in a previous post over a year ago (I overlooked it). Sorry about that. I will start doing the strategy with real money this Sunday/Monday when you send out your next update.
Thanks
any adverse effects on combo3 with the recent changes in the fed model and earnigs estimate calculation methods in p123?
The SPY-SH model has been revised as a result of P123 revising the data.
https://imarketsignals.com/2015/the-bestspy-sh-model-has-been-revised/
Thank you, but what about sso/tlt and sector select models ?
Georg,
Can you show the 2014 results for combo3 when the SSO-TLT model, avoiding long bonds per the BVR, goes to cash instead of TLT?
Thanks,
Jon
Jon, you want to compare performance of the live Combo3 with inception date 2/3/2014 with a Combo3(alt) which uses SSO-Cash.
From 2/3/2014 to 1/12/2016 for Combo3(alt):
Total Return = 36.52%
Active Return = 19.18% over bench SPY.
Max D/D = -9.60%
Georg,
Thanks, I had a typo, and was only interested in data for 2015. Can you separate that out?
Many apologies for the error.
Hello Georg,
I too would like to see the 2015 results for SSO-TLT & Combo3. Also, I would like to know your opinion on how SSO-TLT might perform in the next few years considering todays ultra-low interest rates. Thank you!
Hello Georg,
I’m interested to hear if possible your insight as to why the Combo 3 model has remained essentially uninvested since May. Is it due to a valuation metric, trend or something else? Many thanks,
John
Hi John,
Combo3 has been flat as its component models cannot adjust rapidly enough to the ups and downs of SPY. Since July 2015 these were -12%, +12%, -13%, +19%. For Combo3 the corresponding changes were -5%, +14%, +4%, -4%.
The component models, once they switch, cannot immediately switch back into the previous position, because there is a programmed delay of a certain number of trading days which worked best on average during the past.
Combo3 did better than SPY over the first three legs, but underperformed over the last leg. However, over the period 7/20/15 to 9/15/16 Combo3 gained 7.9%, whereas SPY returned only 3.5%.
When the signals are updated on Sunday, at what time the following day (Monday) do you recommend us placing a trade if we are trying to follow your back testing results? The open on Monday? The close on Monday?
Thanks for the help!
We can’t make any recommendation, but Vanguard recommends to avoid trading in the first half- and last half hour of the day.
‘Best practices’ for ETF trading: Seven rules of the road – Vanguard
http://www.vanguard.com/pdf/ISGETF.pdf
I guess a better question would be, on the back testing results show above, what price for the trades placed on Monday is used, the open, the close, or the average of the high/low? I am just curious what prices were used in the back test in order to generate the equity curve seen in Figure 1 at the top of the page? Thanks!
We use closing prices of the first trading day of the week.
Newbie question: I want to start the Combo-3 portfolio on Monday. I am wondering if it is wise to start with a 1/3 XLU allocation so late in the XLU rally or if it might be better to do VAW (like the iM-Best4 MC-Score) or VTI instead and wait for next sector change?
timse, we are not registered investment advisers so we can’t provide any advice, otherwise we would be breaking the law.
XLU was bought 38 days ago and has returned 3.88% to date. We have no idea about future performance of XLU.
Georg, Anton,
Was the SSO-TLT(BOND) part of this strategy in cash instead of a bond or equity allocation from 01/07/2019 – 01/22/2019?
drftr
Found the answer on yet another web page: Yes, it was in cash for 2 weeks, between 2 IEF allocations. In the same table Combo3.R1 trades I think the record that says “5/7/2018 SPY XLK SSO” should be deleted.
drftr
For new readers it’s almost impossible to comprehend as there’s no single place where all timers / graders / strategies / etcetera are listed. But from my interpretation:
1. Combo3 has been replaced by Combo3.R1
2. One of the underlying strategies Best(SSO-TLT) has been replaced by Best(SSO-Bond)
But I don’t find any information about Best(SSO-Bond). Is this related to the BVR timer that I’ve read about (but can’t find a link for either)?
drftr
1. https://imarketsignals.com/2016/model-revision-combo3-r1-replaces-combo3/
2. Currently Bond is IEF, partly based on BVR.