
Since publishing our iM-Best10 portfolio management system, readers pointed out that the high returns obtained may be distorted by what is known as survivorship bias. Using an online portfolio simulation platform, we investigated the effect of survivorship bias by running simulations on various stock universes. First, the model was run using the present composition of an index series (survivorship biased simulation), then the same model was rerun using the point-in-time composition of the index series (survivorship free simulation). The results were unexpected; the iM-Best10, a quantitative stock trading model, using the S&P 1500 stock universe simulated the very high survivorship bias free CAGR of 48.10% against the survivorship biased CAGR of 42.93%.
The exact same model with no parameters changed other than using the S&P 500 instead of the S&P 1500 simulated a survivorship bias free CAGR of 28.33% against the survivorship biased CAGR of 32.54%. A paradoxical result, what is going on? (CAGR is the compound average annual growth rate from 1999 to 2013.)
The iM-Best10 portfolio management system’s strategy is to select undervalued stocks from a stock universe such as the S&P 500. Each stock is ranked, a measure of its undervaluation, according to fixed criteria. A sell signal is generated if a held stock is below a certain rank and it is replaced by the highest ranked stock from the universe.
What is survivorship bias? Survivorship bias is the distortion of an index that results from not including certain members in the average. Many articles have been written regarding the distortion of mutual fund performance; if funds with poor results dissolve, the remaining positive funds cause the average to overstate the industry average. Similarly, when backtesting investment models and using today’s composition of an index for the model’s stock universe as the S&P 500, survivorship bias theory states that such a simulation is distorted on the high side as the model profits from the gains of a stock when that stock was not included in the S&P 500. Indeed, when the iM-Best10 simulation was rerun and selecting stocks from the point-in-time S&P 500, i.e. survivorship bias free, the simulation produced a lower return.
Now, the S&P 500 at any time is already a survivorship biased list, the selected elite and the established. Thus the theory of survivorship bias, logically thought through, also predicts that investing in S&P500 stocks, by definition, excludes the potential stars and thus limits the opportunity to invest in good mid- or small-cap companies and profit from their rising performance. If the stock universe is expanded to include these potential stars, and using point-in-time for the selection process, then higher returns should be possible.
To test said idea the iM-Best10 simulation was extended to the S&P 1500 Index (which includes all stocks in the S&P 500, S&P 400, and S&P 600), and run twice; once with the point-in-time data of the index and again with the current composition. The results confirmed our thinking; the S&P 1500 returned higher simulated yields than the S&P 500. What was not expected is that the point-in-time data yielded higher returns than the current data, which is in opposition to survivorship bias theory.
We repeated the test on the Russell 3000 Index (the largest 3000 U.S. companies representing approximately 98% of the investable U.S. equity market), and the result was similar, although not as pronounced.
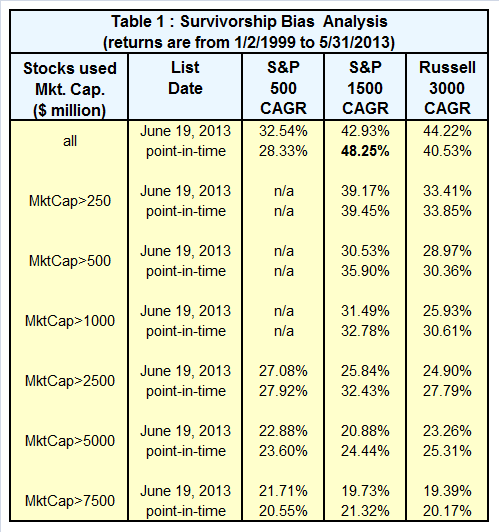
Table 1 below list the results of all the tests we performed.
We now have an example of a model that paradoxically confirms and disproves the survivorship bias theory. The conclusion is that survivorship bias, in quantitative modelling depends on the selected population base and the model’s algorithms and that the direction of the bias is not predetermined universally.
As the S&P 500 is a subset of the S&P 1500 and the Russell 3000 overlaps 96% of the S&P 1500, all three series converge in composition when the additional selection parameter of market capitalization is introduced into the model; this is confirmed by the similar results. Furthermore, the difference between current and point-in-time data gets less and less, which indicates that the proportion of high MktCap companies in the indices remained much the same over the simulation period 1999 to 2013.
The complexity of the stock markets, once again, has presented us with a surprising result that is of interest not only to academic researchers and to statisticians, but also it is of fundamental importance to investors. The clear message is that the small- and mid-cap companies must not be excluded from an investor’s stock universe and the S&P 1500 does an excellent job in representing a stock universe from which very high returns can be extracted. Furthermore, well-constructed models like the iM-Best10 can be used to benchmark stock index series like we have done.
It can be argued that if the point-in-time data yields lower returns (as predicted by survivorship bias) then the model’s selection process for that data series is poor, and/or that one should select a different stock universe. If point-in-time data provides better returns, then we have a good model and a series that gives the investor a better opportunity of success.
“The clear message is that the small- and mid-cap companies must not be excluded from an investor’s stock universe…”.
Table 1 shows CAGR clearly declining as MktCap increases. Seems like CAGR would benefit if the LARGE cap stocks were excluded. E.g. only consider S&P 1500 stocks with MktCap < 2500 (which I would guess is the same as the S&P 400 and S&P 600 stocks).
Rob, you are correct. The highest returns for the Best10 models are obtained if one excludes stocks from the S&P 1500 having a MktCap > $1000-million, and for the S&P 500 those having a MktCap > $2000-million.