
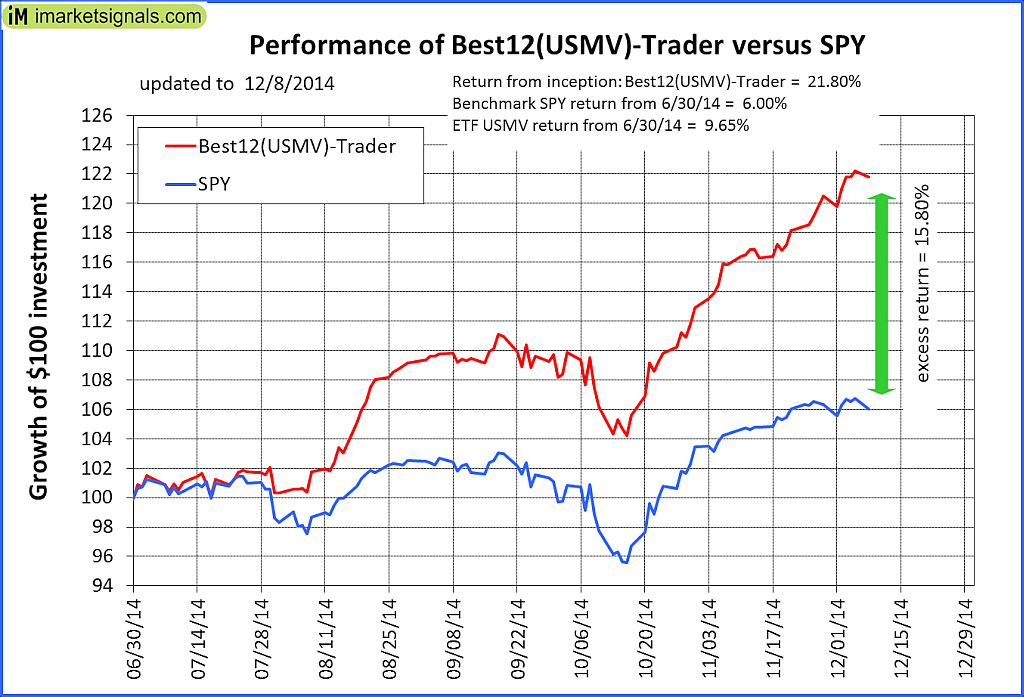
In this previous article a backtest showed that ranking the approximately 150 holdings of the iShares MSCI USA Minimum Volatility ETF, and selecting a portfolio of the 12 highest ranked stocks from them, provided much higher returns for the portfolio than for the underlying ETF and also SPY. To test these findings out-of-sample we launched the Best12(USMV)-Tradermodel on Jun-30-2014 and have since then published periodic trade signals, holdings and performance on our website. So far to December 8, 2014 the trading portfolio’s out-of-sample performance is 21.8%, while SPY gained 6%.
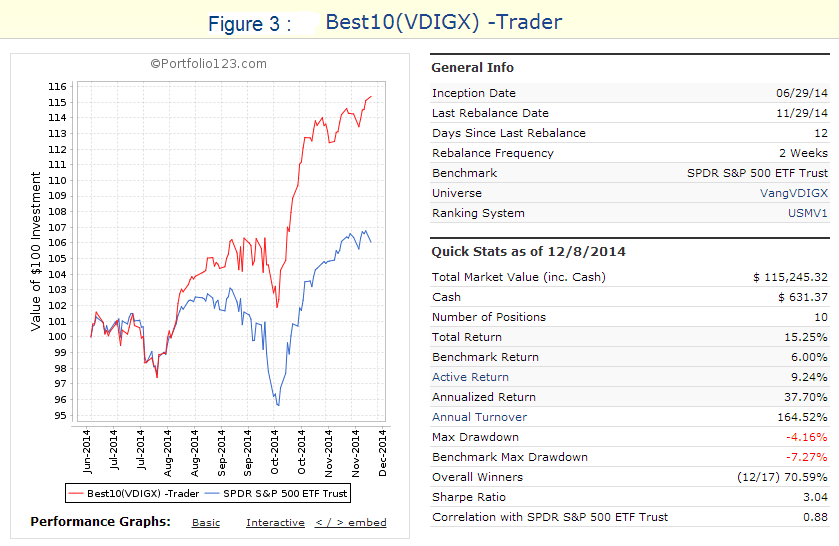
The above process has now been repeated using the holdings of the Vanguard Dividend Growth Fund. A simulation over the same time period (6/30/14 to 12/8/14) which selects periodically the 10 highest ranked stocks shows a 15.3% return while VDIGX gained 7.0%. This is shown in Figure-3 below.
According to Vanguard the Dividend Growth Fund “ focuses on high-quality companies that have both the ability and the commitment to grow their dividends over time and seeks above-average current income and long-term growth of capital and income. The advisor, Wellington Management Company, LLP, invests in a diversified array of stable, well-managed companies that have a history of or a potential for growing dividends over time. Valuation is key to security selection, with the advisor preferring stocks that trade at a discount to the market or that possess an attractive risk/reward profile.”
Backtesting Performance
VDIGX currently holds 49 large-cap stocks (market cap ranging from $10- to $393-billion) all of which were listed for at least five years. Using these stocks as the universe, backtests were performed on Portfolio 123, an online portfolio simulation platform, assuming an initial investment of $100,000.
Backtest period – 3 years.
(A) All 49 stocks held continuously, approximately equal weighted over time.
(B) Only 10 stocks periodically selected by a ranking system, with buy/sell rules.
The backtest results could be affected by survivorship bias, but due to the low 19% annual turnover of VDIGX it is believed that using the current holdings of the fund as the universe for the entire backtest period will not affect the simulated results significantly.
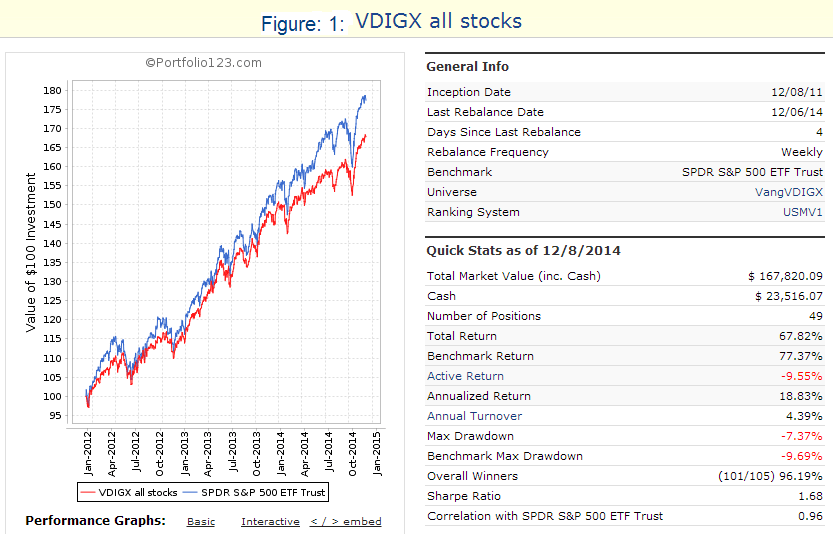
Results of backtest (A) with all the stocks of current holdings of VDIGX:
Had one on Dec-8-2011 invested equal weight in all the 49 stocks of the current holdings of VDIGX and applied the same 0.31% expense ratio as Vanguard does for this fund, then to Dec-8-2014 the total return over 3 years would have been 67.8%. Over the same period VDIGX gained 66.8%, effectively the same. The results confirm that using the current holdings for the entire backtest period is a legitimate technique when backtesting over shorter periods.
In the figures below the red graph represents the model and the blue graph shows the performance of benchmark SPY.
 (
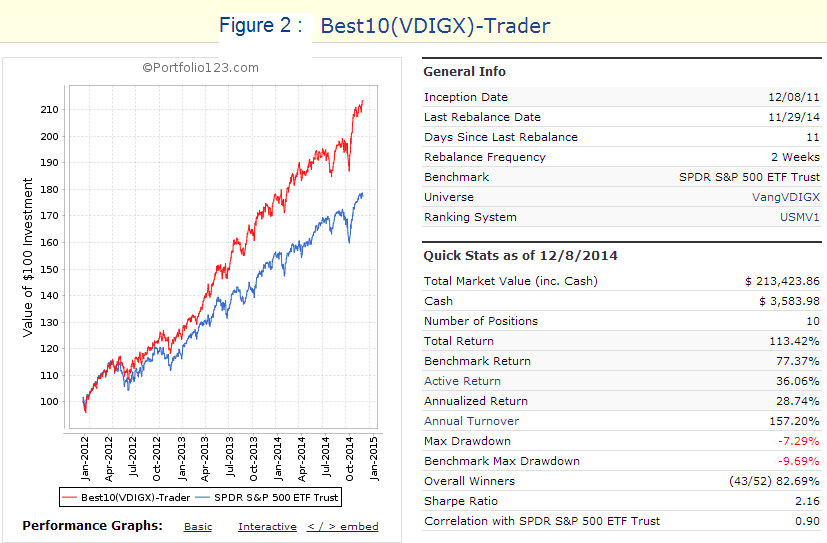
(Results for backtest (B) with 10 selected stocks from VDIGX’s current holdings:
Had one on Dec-8-2011 invested equal weight in the 10 highest ranked stocks, rebalanced every 2 weeks and applied buy and sell rules, then over 3 years to Dec-8-2014 the total return would have been 113.4% and the annualized return (CAGR) would have been 28.7 %. Allowance was made for an expense ratio of 0.31% as for the fund.
This strategy would have provided much higher returns than Vanguard’s Dividend Growth Fund or SPY. Going forward, it will be a simple matter to update the Trader model periodically with the point-in-time holdings of VDIGX to keep the model’s universe from which stocks are selected current with the holdings of VDIGX.
 (
(Backtest Parameters
It is relatively simple to “overfit” an investment strategy so that it performs well in-sample, but the more complex a model is, the higher the likelihood of the out-of-sample performance to underperform the backtest’s results. Therefore a simple algorithm with only a few parameters was chosen for this model.
Ranking System:
- As for the Best12(USMV) model.
Buy Rules:
- As for the Best12(USMV) model – 3 rules, and
- percentage change of stock price over the last four weeks > -2.5%.
Sell Rules:
- Only 1 rule: Rank
Backtest Return from Jun-30-2014 to Dec-8-2014 for Best10(VDIGX)-Trader
This portfolio shows a 15.25% average return to 12/8/2014, while benchmark SPY gained only 6% over the same 161 day period. A starting capital of $100,000 at inception on 6/30/2014 would have grown to $115,245 which includes $631 cash with slippage of 0.1% of transaction costs accounted for.
The performance is not as good as that of the Best12(USMV)-Trader, but still considerably better than the performance of SPY or that of the Vanguard’s Dividend Growth Fund which gained 7.0% over this period.
 (
(Conclusion
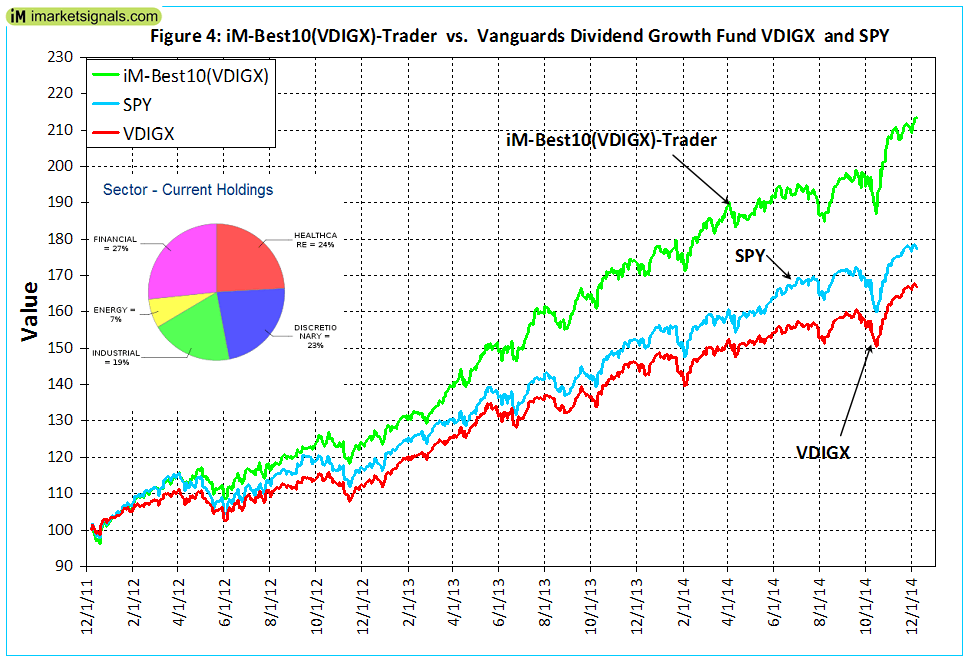
Using a ranking system to rank the stock holdings of VDIGX and only investing periodically in the 10 highest ranked stocks according to the buy/sell rules would have produced the best returns, as demonstrated by the results for backtests (B). The performance from Dec-2011 to Dec-2014 is shown in Figure-4 together with the sector allocation of current holdings. One can see that the model’s holdings are well diversified.
 (
(
Following the Models
At our website iM imarketsignals.com one can follow the weekly performance update of Best10(VDIGX)-Trader.
Is there a back test of 10 years or more with this portfolio, is it possible? I would also like to know the # of traders per year. Looks good though.
One can run a backtest over 10 years, but the performance results would be heavily distorted by survivorship bias, because we have to run the backtest with current holdings of VDIGX.
If one looks at Figure-2 one can see on the right various performance results. The simulation shows that here were 52 trades in the last 3 years and the annual turnover was a low 157%.
Thanks for the reply, didn’t think a 10 year back-test would work but thought I’d ask.
One last thing, is there a trailing stop with the positions?
No, there is no trailing stop. Only sell rule is “Rank”.
This goes “live” the first week of January, right?
So if we buy the top 10 at that point, the idea is to hold those for 1 year, then look at the top 10 at that point and make any adjustments as necessary.
Joel, this is a Trader model which has been live since 12/8/2014. At the end of December the universe from which stocks are selected will be replaced with the end of December holdings of the Vanguard VDIGX to keep it current with VDIGX. That is the only change.
The model is rebalanced every 2 weeks, meaning there may be small adjustment transactions to keep the weight of each position at 10% and stocks may be sold and replaced as well every 2 weeks.
This model does not hold stocks for 1-year or longer. Only the USMV sister models hold stocks for 1-year or longer. Currently we have the July and October models running and we will add the January USMV on Jan-5. Also there is the USMV-Trader which is similar to the VDIGX-Trader.
Thanks, Georg. I, for one, would be curious how this strategy would look with a one year holding period.
Returns for a static model with a min holding period of 1 year, for periods ending 12/8/14 to make it comparable to what is shown in the article, are in the following order:
Period, CAGR, Model Tot Return, SPY Tot Return
4-years, 23.09%, 129.56%, 81.88%
3-years, 26.54%, 102.67%, 77.37%
2-years, 27.94%, 63.63%, 51.13%
1-year, 23.15%, 23.15%, 16.41%
from 6/29/2014, na, 15.49%, 6.00%
One can see that the Trader model performs somewhat better than the static model. The static model out-performs SPY for all periods.
Thanks, Georg. Looks solid, and consistent. Short time period, but using the MAC and/or the COMP and/or BCI to get you out should provide better long term returns yet somewhat minimize tax implications on most years.
Very interesting. I saw that your ranking system has five parameters. All weighted equally, yes? And where do you get your data for those parameters?
Do you have more details about how that data is configured? Trend, for example – what moving average are you using? And does a stock get more points for being further below that moving average or above it?
Data for the ranking systems comes from Portfolio123. The formulas and the relative weight of the components in the ranking system are proprietary. We cannot be more specific than that.
Understood. But do you plan to continue publishing your VDIGX portfolio for members?
We update and post holdings of the VDIGX-Trader every week on Tuesday.
Thanks for all your hard work on all this material. Am relatively new to the site but learning a lot. Wondering if one wanted to start a portfolio based on this model, would they buy all the current holdings or buy stocks only when they are added to the portfolio? What is the recommended approach? Thanks in advance!
If one wants to follow the model it is best to hold all positions. Remember this is just a model and one one should review stocks before buying them. This model has been rebalanced today (5/31/2015) and there were 2 sell and 2 buy trades generated.
I noticed that neither the rotation system Best 12 USMV or Best 10 VDIGX have some type of hedging mechanism if the market goes into a bear market. Would this mean in a market correction that one would expect larger drawdowns compared to your other models that do have hedging mechanisms in place, such as iM-Best10? If so why did you not place some type of hedge in there models? Should one be more conservative compared to the hedged models when trading them because of this fact? Thanks.
Thank you for your comment. The USMV and VDIGX models have no market timing rules or hedging in the algorithm. The idea is to show that these models, by selecting stocks from the underlying funds with a ranking system, can perform better than the underlying funds. So far the OOS performance seems to verify this.
The iM-Best10 is no longer available at iM because the signals were delayed and performance was unsatisfactory.
We will consider introducing market timing and also hedging in the USMV and VDIGX Trader models.
Thanks. I’d love to see an amended USMV & VDIGX with some sort of market timing because your market timing rules are what I think makes your stuff so unique & special. Keep up the good work.
Both, the USMV and VDIGX Traders have no market timing or hedging. It is not possible to backtest those models, as the current universes from which stocks are selected are the current holdings of the underlying funds.
The idea of those models is to investigate whether the models out-perform the underlying funds over time. So far this has been the case.
These do, however, have a slight hedging component so they not? What I mean is that the VDIGX Trader Model only selects stocks that have a return greater than -2.5% over the previous 4 weeks. So if the stocks in the universe are dropping this will only be able to invest in cash. I assume that is why in the update this weekend we sold Blackrock but did not replace it with anything, so we are invested in 9 stocks at 10% each and 10% cash. Is this correct?
In March 2018 we made changes to the algorithm which we believe will improve performance.
https://imarketsignals.com/2018/improvement-update-im-best10-vdigx-trader-trading-stocks-vanguard-dividend-growth-fund-vdigx/
The buy rule selecting stocks that have a return greater than -2.5% over the previous 4 weeks was eliminated.
The reason that Blackrock (BLK) was not replaced with another stock is that the ranking system could currently not find another suitable stock to buy.
Thanks for the quick reply.
So, am I correct in saying with the recent deletion of Blackrock that the portfolio is now invested 10% each in 9 stocks (for a total of 90% in equities) and 10% in cash? Or are you spreading the entire 100% of the portfolio equally over the 9 stocks that are now in the portfolio (11.11% in each stock)?
10% cash and 90% equities is correct
Thanks!
Is it possible to backtest how the performance of VDIGX would have looked if one were to use SPY-SH as a filter to either good long VDIGX stocks when SPY is so to speak on & to go flat when SH is on, or maybe actually to go long SH instead of being flat when SH is the signal?
As per my comment above, we can’t backtest those models due to survivorship bias from using the current universe for prior periods when the universe would have been different.
Georg,
Wondering about a combo 60% best 10 vdigx and 40% Sh/rsp?
We only have performance for the VDIGX Trader from July-2014 onward.
Combo 60% Best 10 vdigx and 40% Sh/rsp:
Period 06/27/14 – 05/23/17
Last Rebalance 05/22/17
Benchmark SPDR S&P 500 ETF Trust
Quick Stats as of 5/23/2017
Total Return 66.56%
Benchmark Return 29.67%
Active Return 36.89%
Annualized Return 19.20%
Max Drawdown -5.25%
Benchmark Max Drawdown -13.02%
For VDIGX Trader only:
Quick Stats as of 5/23/2017
Total Return 60.83%
Benchmark Return 29.67%
Active Return 31.16%
Annualized Return 17.77%
Max Drawdown -11.73%
The Combo has a higher return with a much better drawdown.
Holdings need updating
Georg,
You have models representing the ‘best of’ the ‘dividend growth’ and ‘low vol’ populations – have you looked at models selecting the best out of other factors, such as ‘value’ (using VTV for example) or a population derived from a multi-factor model such as CLRG, which has very favourable results on a 20 year backtest?
No, we have no models which select stocks from the factors you mention.
Georg/Anton,
This is a comment on the USMV model.
Here’s a recent article from SA that provides a chart on performance in 25 segments by size and volatility. https://seekingalpha.com/article/4236220-trade-never-wins-lost-2018?app=1&isDirectRoadblock=true
The population from which you draw your model is a MSCI Min-Vol based ETF which has about 150-200 component min-vol medium to large-cap stocks. The chart in the article shows better performance not from mid to large-caps but from smaller caps and not from those in the lowest variance group, but the second lowest variance group.
The chart in the article is based on 55 years of history and MSCI uses a much more complex algorithm that simple variance, so that complicates things, but it seems there may be an opportunity to enhance your model by incorporating smaller caps from the lower-but-not-lowest volatility population.
You should inform the fund managers of Vanguard VDIGX that their stock selection criteria is poor, something that does not seem to bother investors who have $30.9 billion in this fund as of 12/31/2018.
We use this fund’s holdings as the universe for our model and then periodically select the best 10 stocks with a ranking system. Since Jul-2014 to 1/28/2019 (out of sample) our model has produced a profit of 92.3% versus 47.2% for VDIGX, twice as much.
Ya, I know the comparative results – and that, in effect, your model also shows that the structure of VDIGX may result in sub-optimal performance because of the large number of holdings. My point was that the structure of VDIGX is sub-optimal for a different reasons that may provide you with an opportunity to enhance your model further.
VDIGX only hold 42 positions. I think you posted this on the wrong model. You are referencing the Best12(USMV) models and we will see whether we can improve this model’s performance by taking note of your comments.
Thank you for taking time to suggest this.
I know I’m posting this on 3 different models, but can you please give me an updated Sortino ratio from present through the entire back-test period? Thanks!
Hi Georg and Anton! Any help on this question when you have time is appreciated!
Annualized Return (%) …. 16.15
Max Drawdown (%) …. -14.02
Monthly Samples …. 58
Standard Deviation (%) …. 13.15
Sharpe Ratio …. 1.18
Sortino Ratio …. 1.7
Hi Georg and Anton What’s the updated(end of2019) sharpe ratio and max dd for this model ? Thanks
Hi Georg and Anton! Any help on this question when you have time is appreciated!
following
Period 6/29/2014 to 1/14/2020
Total Return …… 148.06%
Benchmark Return…… 86.42%
Active Return …… 61.64%
Annualized Return…… 17.77%
Annual Turnover …… 160.87%
Max Drawdown …… -14.02%
Benchmark Max Drawdown …… -19.35%
Overall Winners …… (68/99) 68.69%
Sharpe Ratio …… 1.27
Correlation with S&P 500 (SPY) …… 0.8