
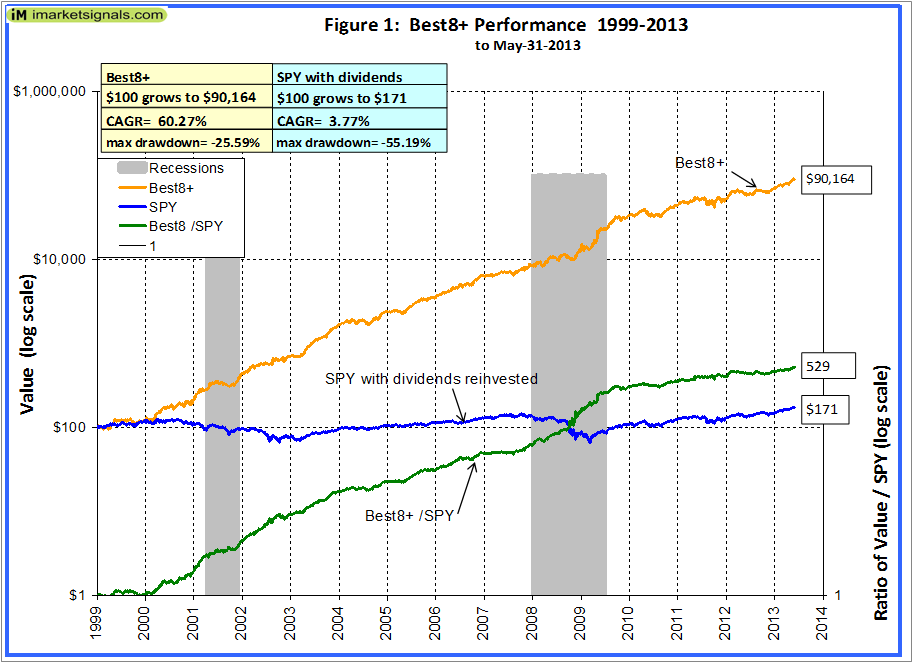
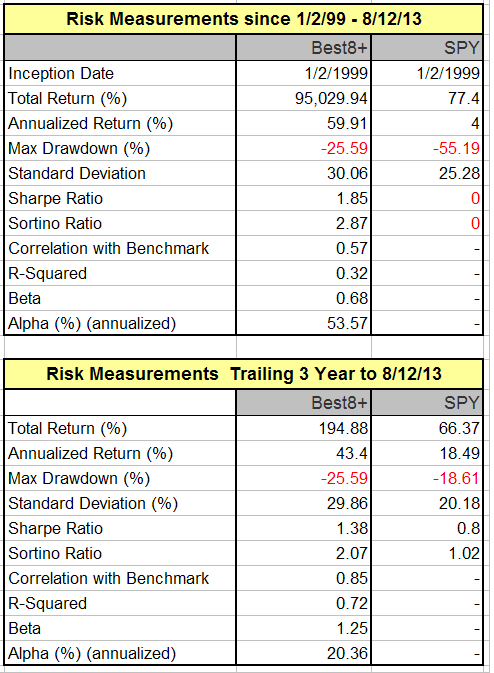
The iM-Best8+ algorithm has been improved to achieve a CAGR of 60.27% to outperforming the the S&P 500 with dividends (SPY) 522 times, that is for an investment over a period from January 2, 1999 to May 31, 2013. In comparison the depricated version that achieved a CAGR of 55.23% which outperformed the SPY by a factor of 333.
This model has been posted in the R2G section of P123 Portfolio Simulations and is opened for subscription, but oversubscribed
Please register your email to the iM-BestX News at the bottom of this page to obtain irregular news on iM-BestX status.
The iM-Best8+ system periodically selects the 8 highest ranked stocks (or less when draw-down protection rules are in effect) from a segment of the market that avoids stocks of companies with very high market capitalization, and also those which operate in certain industries which have historically produced low returns for investors. Under certain adverse stock market conditions the model goes to cash and/or switches to TLT, the iShares 20 Plus Year Treasury Bond ETF. This strategy produced a high annualized growth rate of 60% for an investment made at the beginning of 1999.
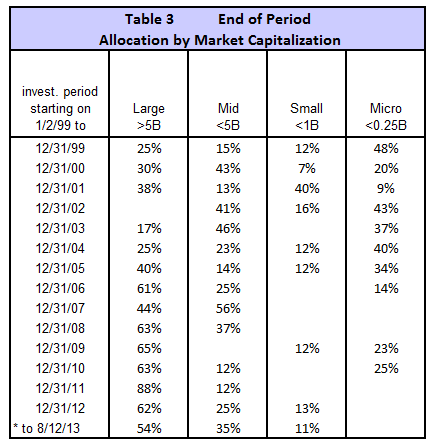
Typically over the last 14.5 years the proportion of stocks in the portfolio was about 45% Large-, 26% Mid-, 9% Small-, and 20% Micro-Caps.
The graph of the system’s performance against the benchmark SPY with dividends has a rising slope from 2000 onwards indicating that performance was always better than the benchmark’s, producing about 529 times more value from January 1999 than what a continuous investment in SPY would have provided.
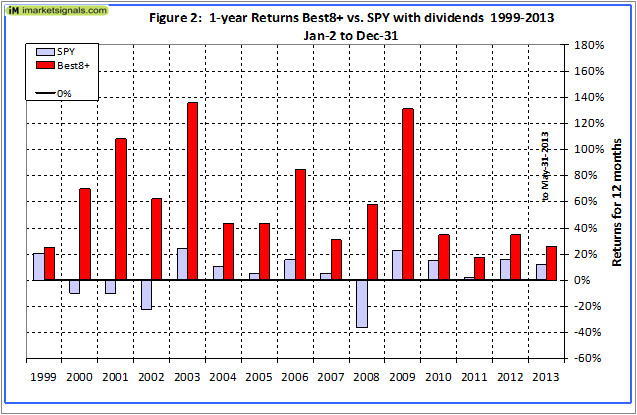
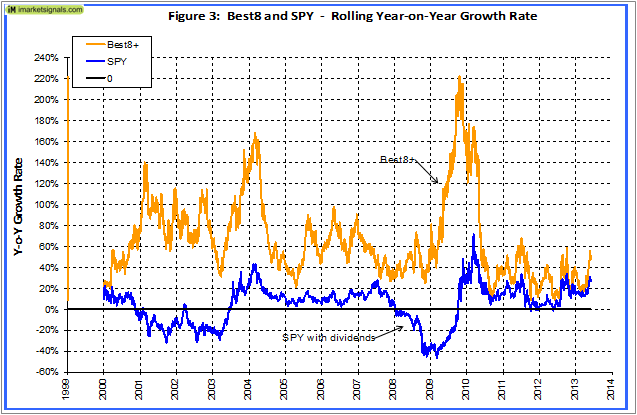
Rolling 1-year returns were calculated starting each day from 1999 to 2012. There was never a loss over any 1-year period. The minimum return over 1 year was 8.1% and the maximum was 222.4%.
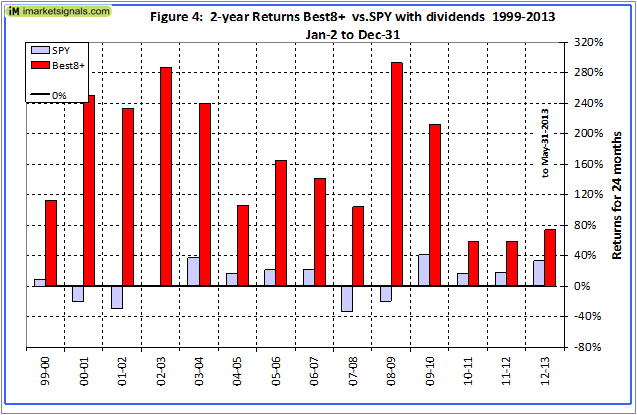
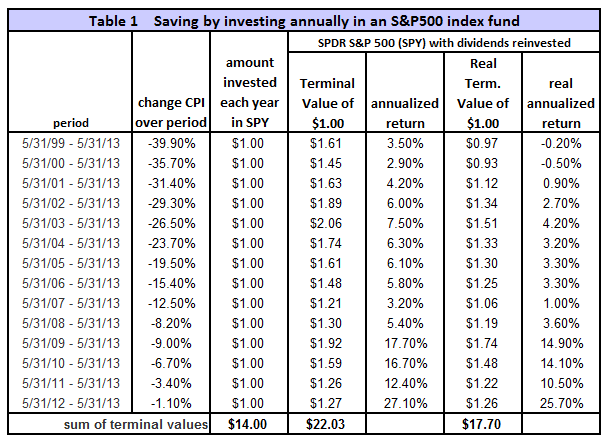
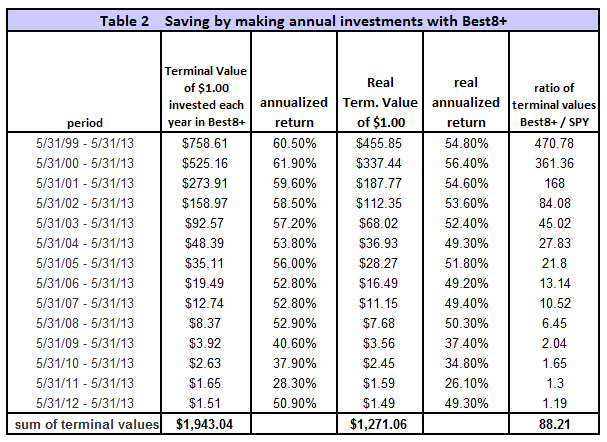
To simulate savings over time, terminal values were calculated to the end of May 2013 for annual hypothetical investments of $1. Starting with a dollar during each of the 14 years from 1999 to 2012, one would have invested a total of $14 cumulatively by the end. Summing the 14 terminal values, this strategy would have netted this dollar-per-year investor $1,943 at the end of 14 years. Following a buy-and-hold strategy in SPY, one would have only $22, about 1.1% of what Best8+ provided. Furthermore, the lowest annualized return, for any of the 14 time periods was 28.3% and the average for all the periods was 51.7%.
The last 74 trades (from Feb to Aug-2013) for a portfolio having a value of about $9-million were reviewed together with the actual total trading volume for these stocks on the days when the model’s trades occurred. For this size portfolio the individual trades require a fairly large number of shares to be bought and sold, but they are still a reasonably small fraction of the total daily volume traded, on average about 2.3% of the total. Defining the less liquid stocks as those whose percentage of the day’s volume to be traded exceeds 3% of the actual daily volume, and assuming one can trade about 5% of these without affecting stock prices detrimentally, then the total value of this portfolio should not be higher than about $8- to $10-million.
This system would be suitable for a good number of individual investors with smaller portfolios trading 2 to 6 stocks each week (resulting in a moderate average annual portfolio turnover of 760%); it is not intended for professional fund managers. On average a stock was held for 42 days, and thus one can easily build a major position over a few days after the Monday recommendation without affecting the stock price.
This portfolio management system requires a few trades each week. A simple ranking system is consistently applied to the stock selection process, which a sensitivity study showed to be very robust. This is this not a complex, high risk system with many parameters which could easily break down. The backtesting returns are not distorted by survivorship bias, and this model should continue to outperform in the future as well.
Note: The benchmark for this model is SPY with dividends, unlike most other R2G models which have an index without dividends as a benchmark, and therefore show performance comparisons distorted to the high side. This model has been backtested over the entire available period for which data exists at P123. It does not avoid the difficult years 1999 and 2000 like many other models which conveniently have a later inception date.
iM-Best Systems
Quick Comparison
Quick Links to Model Descriptions
R2G & iM(Silver) iM-Best10(S&P 1500): A Portfolio Management System for High Returns from the S&P 1500
R2G iM-Best9(Russell 1000) – Large-Cap Portfolio Management System
R2G iM-Best8+ Portfolio Management System
iM(Gold) iM’s Best12(USMV)-Trader Minimum Volatility Stocks
iM(Gold) iM’s Best12(USMV)Q1..4-Investor Minimum Volatility Stocks (The Q3 model available to Silver)
iM(Silver) iM-Best10(VDIGX) Trading the Dividend Growth Stocks VDIGX
R2G & iM(Silver) iM-Best(SPY-SH) Market Timing System: Gains for Up and Down Markets
R2G & iM(Gold) iM-Best1(Sector SPDR) Rotation System
R2G & iM(Gold) iM-Best(SSO-TLT) Switching System
iM(Gold) iM-Best Combo3: Best(SPY-SH) + Best1(Sector SPDR) + Best(SSO-TLT)
iM-Best(SPY-Cash) Market Timing System
iM-Best(SSO-SDS): Beating the Market with Leveraged ETFs
Survivorship Bias: neither Myth nor Fact
Quick Links to Ready-2-Go Models
Best(SPY-SH) Gains for Up & Down Markets
When subscribing to P123 please use this link or enter token IMARKETSIGNALS when registering to obtain 30 days free membership.
Disclaimer: The opinions in this document are for informational and educational purposes only and are obtained from a mathematical algorithm and should not be construed as a recommendation to buy or sell the stocks mentioned. Past performance of the companies may not continue and the companies’ stock values may decline. The information in this document is believed to be accurate and represents the output of a mathematical algorithm, and under no circumstances should a person act upon the information contained within. We do not recommend that anyone act upon any investment information without first consulting an investment advisor as to the suitability of such investments for his specific situation. Also see our Terms of Use/Disclaimer.
Please send me an email when thé subscription is opened
Thanks
jackfruit, I noted that you have registered to the iM-BestX News, and you will receive an email with the time and date when subscriptions are opened.
please send me an email when iM-Best8+ opens
thanks
Please send me an e-mail when iM-Best8+ is open for subscriptions
George,
Please include me in your email list for the opening of subscriptions…I thought it was Aug 28??
Thanks
adg030, samaha & mestotko
You all have registered to receive iM-BestX News and thus will get a timely email, a day or two in advance, informing you the time and date when subscriptions are opened, which provisionally is August 28.
Thanks…will you be limiting the number of subscribers?
Thank you for your interest. Yes, there will only be 25 subs available. The model is already at P123 but not open for subscription yet.
Ha thanks for the email of the date. Unfortunately there was no time of subs opening. Ah we’ll…
As the transactions are to be posted on this blog one week later, I was wondering what the difference in performance is for a portfolio lagged by one week? Is it possible that yo could post those stats for the Best 8 and Best 10 portfolios so we may ascertain whether i is worth following the portfolios on a lagged basis? That would help enormously. My own suspicion is that there is not a huge different in performance in the long run but only running the analysis through Portfolio23 will be able to tell us. Many thanks!
Currently we do not intend to post the transactions for Best8+ retroactively. I don’t know how the return is affected by trading one week later. I suggest that you follow the performance of Best10 with delayed trading for a few months or more to see the difference in performance. It is impossible to run the model at the portfolio simulation site, trading one week after the signals are generated.
missed out on IM-BEST 8+, can you let me know when open again?
thanks
m
I also did not expect that all the slots would be gone so fast. I can’t open up more slots, because it would not be fair on the people who subscribed under the assumption that there would be 25 slots only. However, there may be vacancies coming up in the future at Best8+ and/or Best10. You could register as a watcher at the model and you will then be informed by email if
any slots come free.
Also at the bottom of the iM-BestX Portfolio Management System page one can subscribe to the dedicated BestX News mailing list, and you will be updated of any new developments regarding the BestX portfolio management system models, including when any slots may become available.
why does there need to only be 25 slots? how would this affect the people who subscribed? you only mentioned that it would open on Aug28th, not there was a specific process to get on the list or that only 25 slots were available? are these pay or free slots? not sure why we all cannot choose to subscribe or pay. the volume on the stocks in question would not be affected by 50 individuals buying at the same time…
Aaron, at the end of the model description is “Quick Links to Ready-2-Go Models” with our 3 models listed, including Best8+, and instructions how to subscribe. I assumed that you would have checked this out to get informed.
My analysis as to liquidity of some of the smaller capitalization stocks which the model selected showed that there should not be much more than 25 investors trading simultaneously. I agree with you that for 90% of the stocks there would not be a problem having more subscribers.
Please let me know when iM Best 8+ opens for new subscriptions. Thanks.
Please leave your email address in the dedicated iM-BestX News box and we will let you know of developments, including when any slots come free.
Please let me know of any Best8 news. Thanks!
Jay,
Please leave your email address in the dedicated box for BestX News so that you can be informed of any developments.
and now it’s closed for bad performance…??!! 60% annual in simulation and in reality -20%….any explanations??
I’m only interested in trading amazon I signed up for your gold data package how do I make it work?
You could use the iM-1wk-SuperTimer which reconstitutes weekly and holds position for 5 weeks.
Hold AMZN when SuperTimer is in SPY, otherwise go to IEF (same as model).
The backtest from Jan-2000 to Dec-31-2018 shows for the switching strategy AMZN-IEF an annualized return=36.43%, while buy-and-hold AMZN return was=15.32%.
Max drawdown for the strategy would have been -51% in 2006, while for buy-and-hold AMZN the max D/D was -93% in 2001 (you would almost have lost everything then), -70% in 2006, and -59% in 2008.