
Updated September 1, 2013 with an improved algorithm.
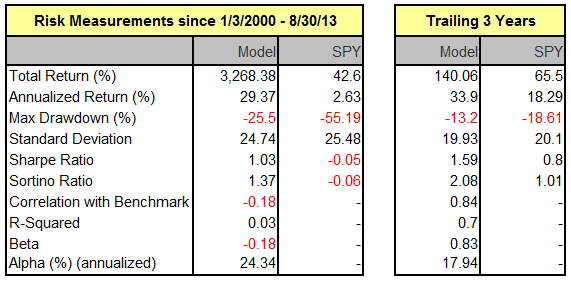
This binary model switches between SPY (SPDR® S&P 500® ETF) and SH (ProShares Short S&P500 ETF) depending on market direction. Using a web-based trading simulation platform, our ranking system, and specific buy and sell rules, this model would have produced an average annual return of about 29.3% from January 2000 to end of August 2013, versus 2.6% for a buy-and-hold investment of SPY over the same period. Had one not invested in SH but remained in cash without interest then one would have been 64% of the time in SPY and the average annualized return would have been about 17%. On September 1, 2013 the model was invested in SPY.
Model Parameters
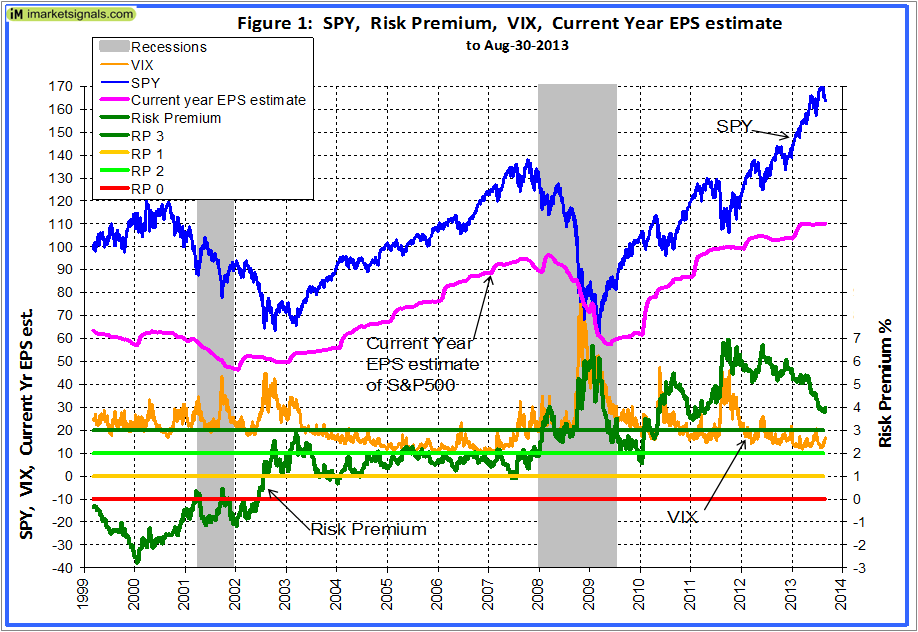
The trading rules use volatility, risk premium, earnings estimates together with moving average cross-overs and includes the following parameters:
- CBOE Volatility Index – VIX,
- S&P500 Risk Premium – which is the difference between the Current Estimated Earnings Yield of the S&P500 and the Treasury 10-yr Note Yield,
- Current Year Earnings Per Share Estimate of the S&P500,
- and the daily price of SPY.
Figure 1 shows graphs of all parameters used. The horizontal risk premium lines indicate whether the market is overvalued (RP<1), fairly valued or undervalued (RP>3) according to the Fed Model.
 (Click to Enlarge)
Performance
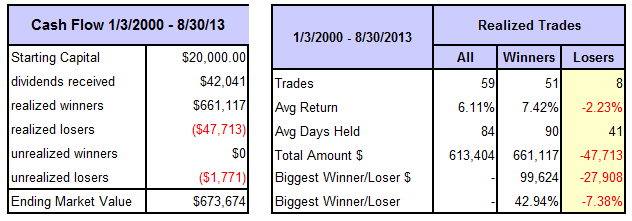
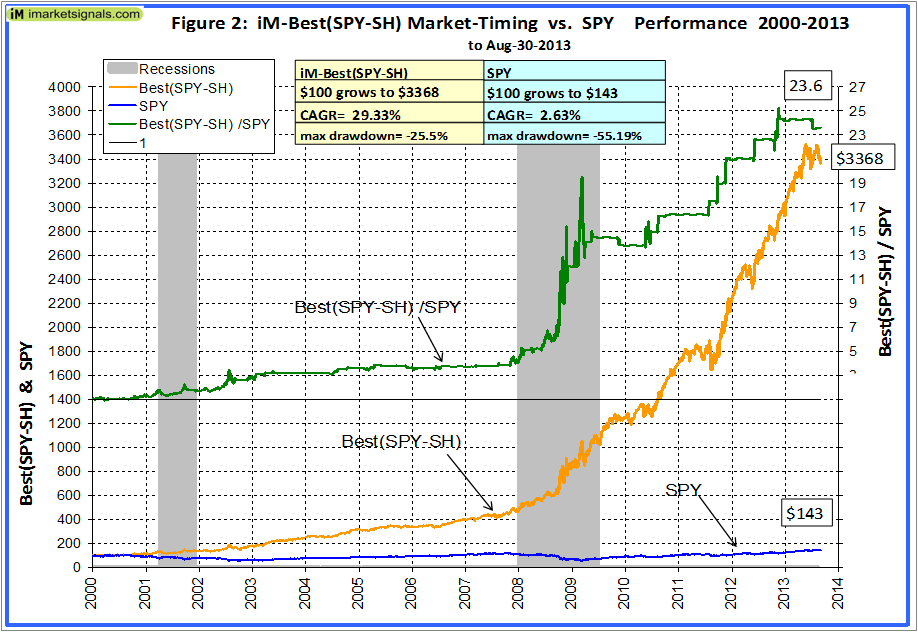
The trading performance of the system is shown in Figure 2 further down. The annualized return from January 2000 to end of August 2013 was a high 29.3%; $100 grew to about $3,370 over this period. The maximum drawdown was 22.75% in October 2002. All values are with dividends reinvested. Slippage and brokerage fees were assumed to be 0.05% of the trade amount, which is realistic for these highly liquid ETFs.
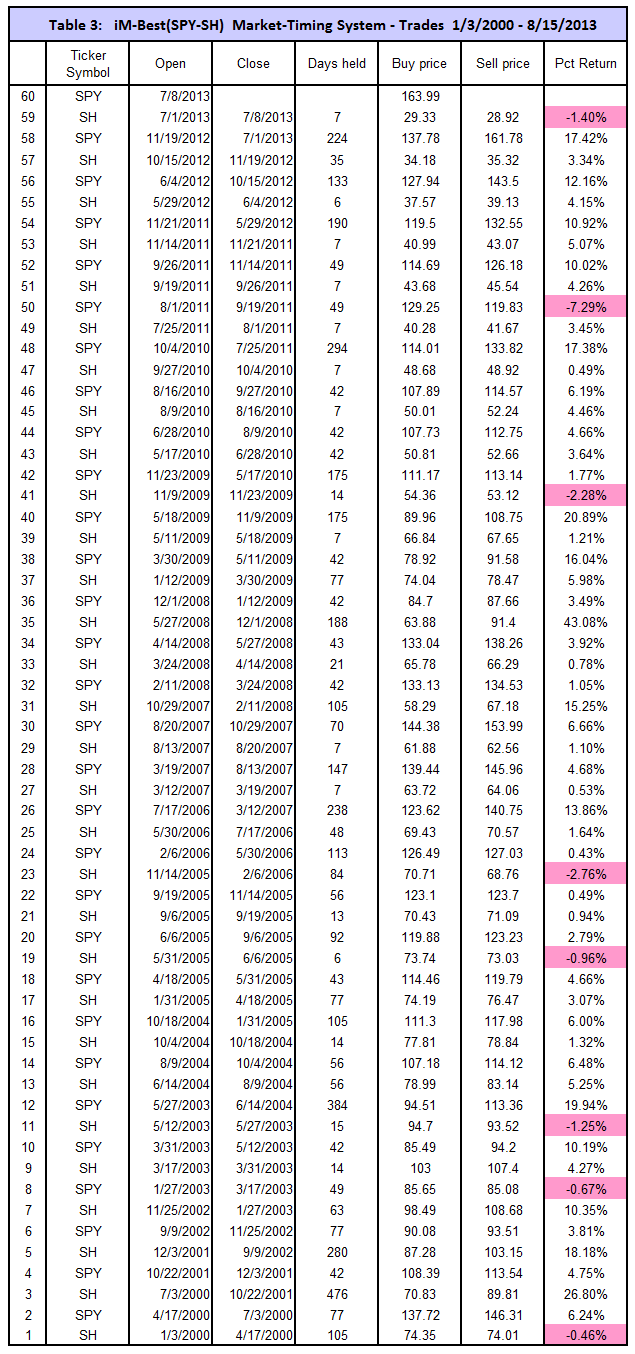
The model assumes an initial investment of $20,000 on Jan-3,2000. It either holds SPY or SH, it is never in cash. To August 30, 2013 there were 59 trades completed, 50 of these were winners and 9 losers, as summarized in the tables below, and listed in Table 3 in the Appendix. The amounts shown include transaction fees of $10,893 arising from brokerage fees and slippage.
Note: The inception date of SH was June 19, 2006. Prior to this date values are “synthetic” derived from the S&P 500.
 (Click to Enlarge)
In above chart, the upper green graph is the ratio of the Best(SPY-SH) to SPY, the general rising trend of that graph indicates that the Best(SPY-SH) continuously outperformed SPY; it produced 23.6 times the value which one would have had from a buy-and-hold investment in SPY over the same period. Even during the bull market period from 2009 onwards did this model out performed SPY.
Annual Returns
Annual performance from January to December ranged from a maximum of 77% for 2008 to a minimum of 8% for 2005, as can be seen in Figure 3. There was never a loss over those periods.
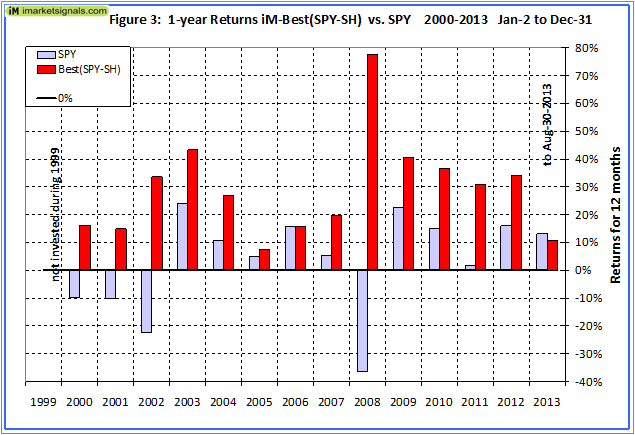
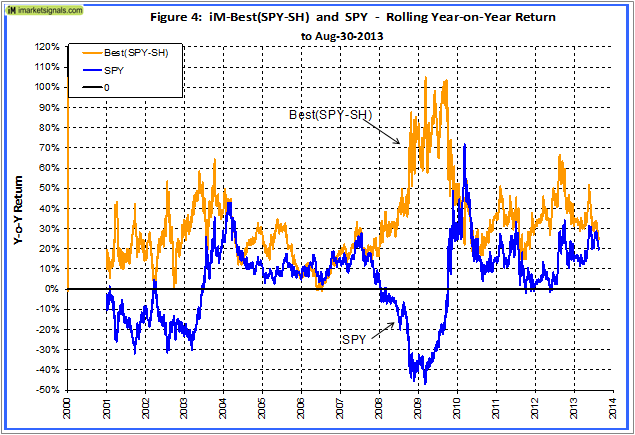
Figure 4 shows the rolling 1-year returns starting each trading day from 2000 to 2012. There was never a significant loss over any 1-year period. The minimum return over 12 months was -1% and the maximum was 105%.
Terminal Values
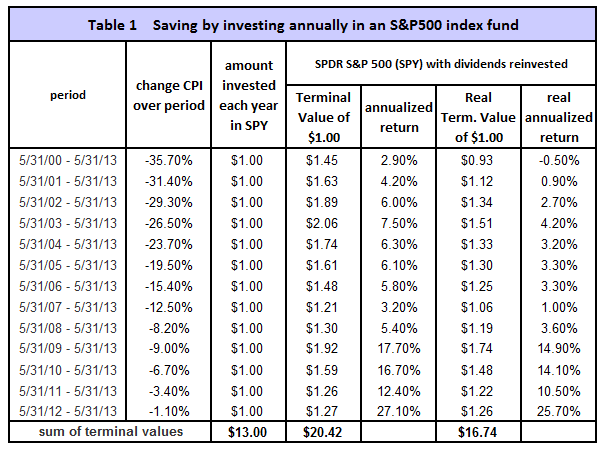
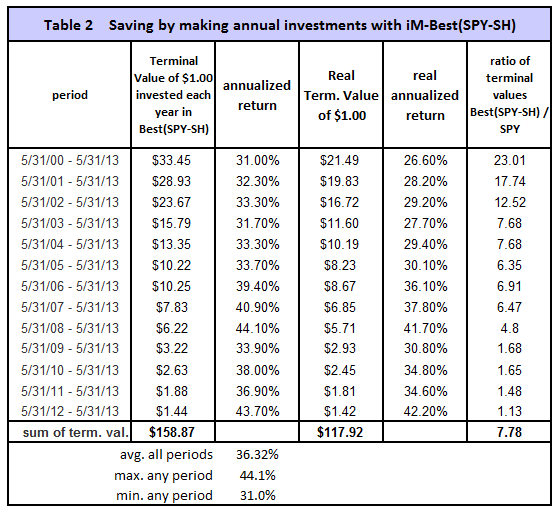
To simulate savings over time, terminal values were calculated to the end of May 2013 for annual hypothetical investments of $1. Starting with a dollar during each of the 13 years from 2000 to 2012, one would have invested a total of $13 cumulatively by the end. Summing the 13 terminal values, this strategy would have netted this dollar-per-year investor $159 at the end of 13 years.
Following a buy-and-hold strategy in SPY, one would have only $22, about 13.8% of what Best(SPY-SH) provided. Furthermore, the lowest annualized return, for any of the 14 time periods was 31.0% and the average for all the periods was 36.3%. This is shown in Table 1 and 2 in the Appendix.
Application to mutual funds
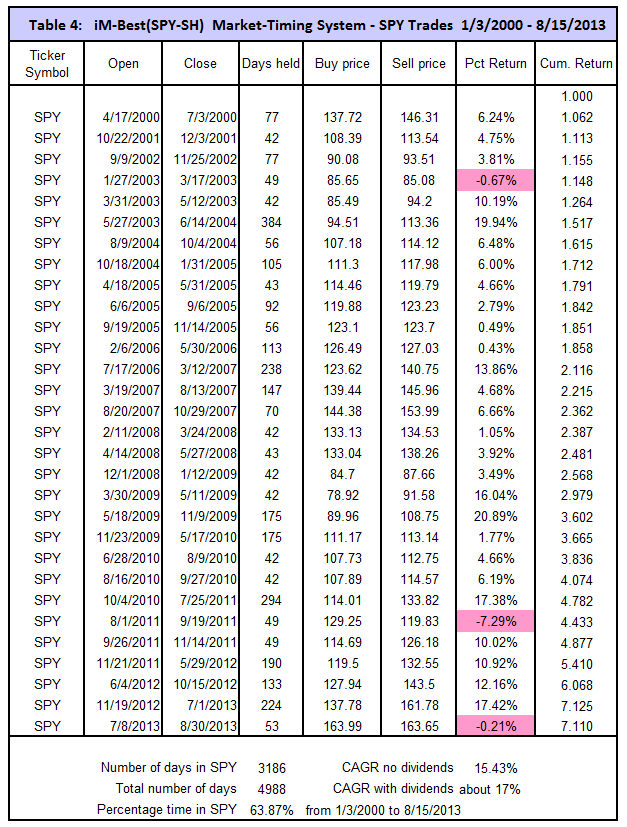
This market timing system can not only be applied to trading the ETFs SPY and SH, but can also be used to time investments in stock index funds tracking the S&P 500. Table 4 in the appendix lists only the investment periods when the model was in SPY, i.e. invested in the S&P 500. This provided an approximate average annualized return of about 17% (with dividends) from the beginning of 2000 to August 2013, with 64% of the total time invested. For the remaining 36% of the time one would have had additional income from a bond fund or from cash in a money market account.
Appendix
iM-Best Systems
Quick Comparison
Quick Links to Model Descriptions
R2G & iM(Silver) iM-Best10(S&P 1500): A Portfolio Management System for High Returns from the S&P 1500
R2G iM-Best9(Russell 1000) – Large-Cap Portfolio Management System
R2G iM-Best8+ Portfolio Management System
iM(Gold) iM’s Best12(USMV)-Trader Minimum Volatility Stocks
iM(Gold) iM’s Best12(USMV)Q1..4-Investor Minimum Volatility Stocks (The Q3 model available to Silver)
iM(Silver) iM-Best10(VDIGX) Trading the Dividend Growth Stocks VDIGX
R2G & iM(Silver) iM-Best(SPY-SH) Market Timing System: Gains for Up and Down Markets
R2G & iM(Gold) iM-Best1(Sector SPDR) Rotation System
R2G & iM(Gold) iM-Best(SSO-TLT) Switching System
iM(Gold) iM-Best Combo3: Best(SPY-SH) + Best1(Sector SPDR) + Best(SSO-TLT)
iM-Best(SPY-Cash) Market Timing System
iM-Best(SSO-SDS): Beating the Market with Leveraged ETFs
Survivorship Bias: neither Myth nor Fact
Quick Links to Ready-2-Go Models
Best(SPY-SH) Gains for Up & Down Markets
When subscribing to P123 please use this link or enter token IMARKETSIGNALS when registering to obtain 30 days free membership.
Disclaimer: The opinions in this document are for informational and educational purposes only and are obtained from a mathematical algorithm and should not be construed as a recommendation to buy or sell the stocks mentioned. Past performance of the companies may not continue and the companies’ stock values may decline. The information in this document is believed to be accurate and represents the output of a mathematical algorithm, and under no circumstances should a person act upon the information contained within. We do not recommend that anyone act upon any investment information without first consulting an investment advisor as to the suitability of such investments for his specific situation. Also see our Terms of Use/Disclaimer.
In your article you state: “Annual performance from January to December ranged from a maximum of 77% for 2008 to a minimum of 8% for 2011, as can be seen in Figure 3.” I think the 8% low year was 2005 not 2011,
Yes, you are correct, it is 2005 not 2011, as is patently obvious. The mistake has been corrected.
Could you discuss the precautions you’ve taken to keep the ogre of curve-fitting at bay? As you know, curve-fitting is the bane of market system development. I’d love to hear your thoughts about ways to prevent it from rearing its dreary head.
We vary the parameters’ derivatives to see whether the model is robust. Obviously in the end we want to show the best return. Also we have stop loss setings for SPY at -12% and for SH at -16%, to prevent major losses.
This is very intriguing but I would love to see how it works during a very long period of time. It’s doubtful that any system can avoid a negative year over the long term.
Yes indeed. It will be interesting to watch this model over the next 5 years. For sure it will do better than buy-and-hold.
I’m new to iM, and I can’t find on the website a clear statement of whether and when to be long or short using the iM-Best(SP-SH) Market Timing System. I can only infer the guidance I crave from some of the charts. Please point out what I’m missing. Thanks.
First, we are not financial advisers; we are engineers and present the results of mathematical models, as a news service, using available financial data series. Secondly, refer to table 3 above and make up your own mind on the success of following the model; SPY makes gains in rising markets and SH makes gains in falling markets. Our advise, consult a registered financial advisor once you are ready to invest in the markets.
Thanks for your reply, back testing fifty years would be interesting. I assume that you derived your minimal hold time of seven weeks by trial and error to derive the best return over the period in question. If that is the case, then there is really no reason to expect that having that as minimal holding period will provide similar results in the future.
Or perhaps I am missing something?
Yes you are missing something: Nobody can predict the future and guarantee returns. In the end there is only one thing that counts, say in five years time: What has performed better – a SPY buy and hold strategy or the Best(SPY-SH) strategy?
Please also refer to this comment. Best(SPY-SH) differs from Best(SPY) and the minimum holding period is six weeks for SPY-SH.
The minimum holding period may be less, because there are stop-loss provisions in the model. Percentage from highest close since position started is currently at -12% for SPY, and -16% for SH.
I am changing the model to sell when the percentage change from recent high becomes -8% for both. This reduces the CAGR by about 1%, but the security of knowing that losses are limited is worth it, in my opinion. This is done by adding the following sell rules in the algorithm:
ticker(“SH”) and PctFromHi <= -8
ticker("SPY") and PctFromHi <= -8
Georg, what is the risk to readers of you constantly tweaking the model and further curve-fitting it?
Of course, we are investors, and looking for a financial model to be working well for the past, some forward-testing, and finally, if it works, then use the ‘do not mess with it’ mode of operation since some of us will be invested in these models with real money.
Glad that you are going to start this as a paid service which will lead you to making it available to investors like me looking for a profitable mathematical model to utilize in real life.
Will you have a price point for these services shortly, so that we can subscribe?
Thanks.
Kenny
Kenny, most of us would prefer a model with a built in stop-loss of 8% instead of -16%, if it does not make a big difference to return.
Although the Best(SPY-SH) model will become available at P123 in the future (requiring membership at P123 and subscription fee to the model), the signals from the SPY-SH model are currently only available from imarketsignals.com. Please register at imarketsignals.com (currently free) and login.
Then go to the “Systems” tag, select “iM-Best Market Timing Systems” and go to the bottom of the page where you will find a box “Subscribe to iM-Best(SPY-SH) News”. Enter your email address and you will receive an email notifying you when the weekly update, showing latest holding, is available. This is usually done on the weekend.
In your Table 3, you show a return of -7.29% for the trade occurring from 8/1/11-9/19/11. Based upon your criteria above, wouldn’t you have hit the stop loss of -8% on 8/8/11? Assuming that you had, would you have kept the proceeds in cash until the next trade indicator date of 9/19/11 regardless of the minimum hold period of six weeks? Thanks.
Table 3 is based on the old stop-loss provisions. The new model with the -8% stop-loss has not yet been released. SPY from 8/1/11-9/19/11 made a loss of -7.29%. Why would a stop-loss of -8% have occurred on 8/1/11?
When a stop-loss occurs the model moves into the other position, never to cash.
Thanks for your reply. The SL would have occurred on 8/8/11. According to Table 3, the entry date on 8/01/11 was 129.25. On 8/8/11 the average between the high and low prices of that date was 116.07. The loss from the entry to 8/8/11 would have been -10.2%, so it would have hit the SL of -8.0%. I’m looking forward to the update as I’m sure it will pick up the SL on that date.
The revised model also uses closing prices, not average of Hi-Lo. The referenced trade is now 8-1/11 – 8/29/11 for a loss of -5.9%. In my opinion closing prices for SH and SPY are more reflective of the S&P500, and anybody can trade a few minutes before close.
Georg, It appears you are using “operating earnings per share” in your EPS estimate and therefore in the risk premium calculation. Why wouldn’t you use “net earnings per share” which then gives a lower current risk premium? Thanks.
I am using the weekly values of Current-Year EPS estimate from the P123 database. I don’t know whether it is operating- or net-earnings. It does not matter for the algorithm, as long as one consistently uses the same.
I like your idea of the new revised model with -8% stop-losses and using closing prices. As I look forward to these improvements do you have a rough time frame for the release date?
Thanks
Yes, by middle of September it will be at P123. we will also change the updates to conform to the revisions.
Does the new -8% stop loss impact the max drawdown (-25.5%)? Is that max drawdown quarterly??
Best(SPY-SH) Market Timing System is now at P123 as a R2G model. Follow the quick-link located just above the comment section. This model applies a 0.2% slippage to each transaction amount and the maximum draw-down is now -23%. This is not quarterly, but it is measured from the highest high to the lowest low over the entire period from 1/2/2000 to 8/30/13. The CAGR= 27.6%.
What is the limiting data that prevents you from back-testing your model further?
The point-in-time database at P123 only goes back to 1999.
Hello Georg,
I’m looking for a simple trend following system for the SPY. (short and long)
What system would you recommend?
Thank you
We have only one model for this. Best(SPY-SH) Gains for Up and Down Markets. It is updated weekly at iM, and you can leave your email address in the dedicate box, located at the bottom of this page, to receive the iM-Best(SPY-SH) News, usually Sundays.
You suggested with the iM-Best (SPY- either IN or OUT) model that better returns could be realized by substituting the ETF equal weight RSP for SPY.
Would it be acceptable to substitute RSP for SPY in either Best (SPY-SH) or (SPY-Cash)
models?
Yes, you would get better returns.
Is your service free?
Currently yes. You can subscribe to it at imarketsignals by entering your email address in the designated Best(SPY-SH) News Box. Normally we endeavor to send an email on Sunday which provides information whether to be in SPY or SH.
You can get it also as a paying subscription ($45 p.m.) from P123. If you want to check the P123 site use the link provided at the bottom this market-timing-systems page, just before the comment section. This will give you a free trial period of 4 weeks instead of the normal 2 weeks.
Georg, thank you for this free site…I use a stop loss to lock in gains… if the 8% stop loss was calculated from each new high instead of the buy price, how would that affect performance? Wouldn’t this reduce the max drawdown?
The 8% stop loss was calculated from each new high instead of the buy price. This reduced performance marginally. Maximum draw-down was also a bit better.
What are the Buy and Sell signals for the Best(SPY-SH) System?
Thanks.
Raj
Please refer to the Best(SPY-SH) Weekly Update, the holding is calculated by the model on Sunday for the coming week. By entering your email address to the Best(SPY-SH) News, just below the weekly update, you will also receive an email with the latest update every Sunday
Also see Table 3 of iM-Best(SPY-SH) Market Timing System.
How are the Buy and Sell signals determined in the Best(SPY-SH) System.
Thank you.
Raj
Raj, please see model description.
Hi Georg and Anton!
I love this system that you’ve created, I was thinking of trying to invent one myself, which made me stumble upon here. I think what you guys have done is awesome!
When the 8% drawdown is surpassed on the daily close, will the system signal to switch position on that day? Since the 8% could be hit anytime during the week, or do you still wait until Monday close to switch positions?
Also, with reference to the (SSO-SDS) system, would you say that the maximum leverage deemed sane would be X3? Since drawdowns on the (SPY-SH) is 23% and on the (SSO-SDS) is 55.6%, on X3 leverage the maximum drawdowns should come in at about 75%?
Just an interesting thought I had, I could be wrong, but I imagine that equities have a general upward bias with a slower ascent and a steeper decline. Would a (SSO-SH) pairing be optimal in the sense that general uptrends which tend to be longer will produce larger returns, and downtrends which are steeper and more likely to have a false positive (I could be wrong again) be able to reduce drawdowns? I noticed 6 of the 8 trades which did not produce positive returns on the (SPY-SH) were from an SH trade.
However, trade 35 did produce the most massive returns being short, and the largest negative trade was actually from SPY and not SH, so I don’t know if it even makes sense now, haha. Just wanted to express that thought.
As always, I look forward to the updates on this site!
Cheers,
Chris
George,
I am interested in your response to this comment, because I have many of the same questions.
When using the (SPY – SH) signals to trade the (SSO – SDS) would you double the stop loss to 16%?
And this maybe a dumb question, but is this a stop loss on your original trade entry price or a trailing stop, where it would exit after the price has dropped 8% from the highest daily closing price since the trade started?
Also… Lets say you are holding SPY mid-week and it drops below 8% so your stop loss triggers you out…. and the following monday rolls around and the system is still saying to hold SPY…. would you then hop back in the SPY trade or stay in cash and wait possibly several weeks until the system triggers to go into SDS?
Thanks in advance for taking the time to answer the questions on this blog!
Travis
Travis,
I would not recommend a SSO-SDS pairing. You can work out the returns for this using the trade dates of SPY-SH listed in Table-3 of the model description.
The stop-loss is calculated from the most recent high. Re-balancing is done with the end-of-week closing prices. So if a stop-loss occurred on a Wednesday and by Friday the market was up again the model would not sell on Monday.
Chris,
Model can only switch positions on the first trading day of the week after it is rebalanced at P123 on the weekend.
Leveraging depends on how much risk you can tolerate.
We have the SSO-TLT model to benefit from the generally longer up-market periods.
You can calculate returns for SSO-SH pairing using Table 3 trade dates.
Hello Georg and Anton:
Would you ever consider doing a SPY-SH system without a 7 week minimum hold once a position is established (or at least a shorter minimum holding period)?
Best regards.
Greg
Shorter holding periods for SPY reduces the return. For example 2 week min holding period produces CAGR=23.6% with max dd=-20%.
I have 2 questions about the spy-sh model: is the model always long or short? Never flat? Why are you using for the short side a daily short etf? A future is the best choice for me, because over a long period you have with a daily short etf a problem to track the short performance, based on the daily calculation of the etf. Thanks, Ramon
Ramon, the model was developed on the P123 platform. The point in time database has values of the ETF SH, but there are no historic futures values there. You are correct that SH is not the best choice to reflect the short performance of the S&P500. Also the model is either in SPY or SH, never in Cash only.
Hi, as i understand you update the system on the weekend but the last 2 time you have updated during the week. Any reason?
Signals for all our models are determined on the weekend and communicated to members by email on Sundays. The site is always updated on Tuesdays once the Monday prices are known.
Hello George and Anton,
Is my understanding correct: for current SH position as of 11/11/14, if it closes down 8% or more from its highest price since purchase:
1. the model will buy SPY the next day at market close
2. the model will then stay in SPY until the next rebalance/new signals on the following Monday.
Kindest regards,
Allen
Trading signals are produced by P123 after rebalancing models weekly on Saturday using Friday’s closing prices and ranks. Thus the (SPY-SH) model can only produce a signal after Saturday’s rebalancing for trading on Monday. It cannot change positions during the week.
Recently the sell rules would have triggered a sale of SH, but simultaneously the ranking system ranked SH higher than SPY and re-bought SH. Therefor if next Friday SH closes down more than 8% from recent high, or if the sell rules want to sell SH, but the ranking system ranks SH higher, then SH will be retained.
SH closing price on 10/20/14 was $23.76 and has not closed 8% lower as of closing on 11/11/14. Why would a sale of SH have been triggered?
And may I ask you to clarify: “…but simultaneously the ranking system ranked SH higher than SPY and re-bought SH.”
Does this refer to the Saturday model rebalance/Monday trading signal?
Thank you very much,
Allen
The sell rules for SH use volatility, risk premium, earnings estimates together with moving average cross-overs as stated in the model description under Parameters, or alternatively when price of SH moves more than 8% from recent high. The 8% from recent high is not the only sell rule.
The algorithm checks on Saturday whether a sell rule is triggered with Friday’s data. If so, the model will want to sell SH. But it will re-buy SH if the ranking system ranks SH higher than SPY at that time. Thus the model will retain SH under those circumstances.
Note: End of October 2014 the SP estimate series were re-built by P123 due to recent fix. See this view-thread http://www.portfolio123.com/mvnforum/viewthread_thread,8135#41884
Thank you. To cement my understanding, one more question if I may. If I want to follow the model, I would only trade on Mondays based on published Model holdings OTHER THAN any possible mid-week switch from SH to SPY (or the reverse) based on the 8% rule.
Is my understanding correct?
Thanks again,
Allen
P123 can only provide signals for trading on Monday. Mid-week switches between the two ETFs are not possible, because the model is set to weekly rebalancing, which is the minimum period allowed by P123 for R2G models.
Please also look at the performance of Best(SPY-Cash) which does not switch to SH, but to cash instead.
I finally get it! I was looking at intra-week stop-loss vs weekly rebalancing/stop loss.
thanks again,
Allen
I had marked your SPY entries with green arrows and green candles and marked SH with red arrows and pink candles. When there is a red arrow and pink candles that is when the model has bought SH. This screenshot is of weekly candles ON SPY so that we can see a good historical snapshot. http://screencast.com/t/Yw09AXL0wIr
When you say that there is a 8% stop loss as of the closing candle on Friday but the model can re-buy the same ticker (SH in this instance) on Monday according to other rules in place what is the purpose of the stop loss?
Can you tell us which part of the rules has kept the trade in SH with this big bounce?
SPY-SH has a ranking systems based on weekly values of current year estimated earnings of S&P500 which have been declining. So this is what was keeping the model in SH. Apart from the 8% stop-loss there are moving average cross over rules to sell SH. If any of the sell rules apply then SH will be sold, but will be simultaneously bought if it is higher ranked than SPY at the time. In any case the 8% stop loss has not yet been triggered.
Also this recent revision may have affected the model. At the end of October 2014 the SP estimate series were re-built by P123 due to recent fix. See this view-thread http://www.portfolio123.com/mvnforum/viewthread_thread,8135#41884
The model will re-buy SH if the ranking system ranks SH higher than SPY, which is the case now because current year S&P500 Earnings (SPEPSCY) are declining.
Thank you for your reply. If the stop loss begins on the day it was bought and accounts for the high of that purchase day it looked like it did meet the 8% stop loss as of last Friday. Perhaps it doesn’t account for the high of the buy day?
I’m still trying to wrap my head around the purpose of having a stop loss that also has a rule that allows it to be repurchased. I understand the logic of it still being the better choice due to the reasons you mentioned but do not know the purpose of the stop.
How can we see how the annual numbers and draw downs changed from before and after the P123 revision?
The purpose of the 8% stop is to have an additional sell rule for SH.
The S&P estimate series which were re-built by P123 due to recent fix do adversely affect performance of this model. We are investigating this further and may have to re-calibrate and revise the algorithm of the R2G model.
Can anymore comments due to S&P estimate series fix be made about model performance or possible recalibration at this time?
Please see https://www.portfolio123.com/app/r2g/summary/1259110 and the second comment below.
After reading your update to Best(SPY-SH), which held spy through the Oct downturn and switched signals to the SH just as the SPY rebounded, the model YTD is about -10%, while SPY is up 12%. You appear to be backdating signals to negate this disastrous loss and fake a positive return similar to the SPY. Please explain if my logic is incorrect, or I am not getting your complicated explanation. Thanks, Fred
I think you misunderstood the update. The model has been revised for the reasons stated. The original performance to 12/7/2014 remains frozen and is not changed by the revision, no signals are backdated. The “Best(SPY-SH) rev. 12/7/2014” has been posted to enable a comparison of historic performance with “Best(SPY-SH) Gains for Up & Down Markets”, and will be removed from R2G in a few weeks.
OK..I’m sorry for misunderstanding..I get it now. Thanks
Honestly, I read the note posted on the iMS homepage re Best SPY/SH, and I have no idea what you’re talking about. I’m at a complete loss as to what is going on here. Can you explain this in plain English? Am I supposed to buy SPY tomorrow, or stick with SH? Should I check back tomorrow when the P124 results come out? It’s very very unclear.
Did the system reveal itself not to be working so you revised it? (The system has been caught in the wrong direction for about 7 or 8 weeks – as the market has zoomed up). This seems to be the first obvious malfunction in SPY/SH system – if you check the results you guys post from back-testing.
The link to have to a explanation “thread” at P123 leads to an “error” message in my browser. What am I (and the rest of us) to make of all of this?
What should I do now?
Please read all our comments below which address your concerns.
This is the link to the “viewthread” –
https://www.portfolio123.com/mvnforum/viewthread_thread,8214
and this is the error message:
▸ Portfolio123 ▸ Error !!!
The error message is:
Cannot parse the parameter “thread” to a “int” value! Please try again.
» You may go back now and try again
» If you believe this is a bug, click here to report this error to Website administrator
We believe this to be a temporary P123 error – we cannot reproduce it, please try again or try http://www.portfolio123.com/mvnforum/index and search for the thread titled “How many R2G’s have INCORRECT PERFORMANCE Stats?”
Also look in https://www.portfolio123.com/mvnforum/listthreads?forum=32 and find the thread “IMPORTANT: SP estimate series were re-built due to recent fix ”
In your note you say: “to be consistent with Portfolio123, we report on the holdings of the unrevised model which may change when Portfolio123 re-balances the R2G model early Monday morning.”
What does that mean for me, a subscriber to iMarketSystems? Are you going to send us an update email if it turns out the investment is SPY and not SH?
We made the revision today. We will see tomorrow morning whether the P123 email will signal the switch to SPY. If it does, we will follow up with an email to our iM members. Future signals for SPY-SH will use the revised model’s algorithm.
the note goes on to say: “The revision has the effect that the model has a lesser performance now and has been invested in SPY since 9/15/2014.”
What the heck does that mean?
Do you mean – if you, through P123, had had the correct data – the model would have had us invested in SPY the whole time (instead of SH)? I ask because, truly and honestly, I don’t know what the sentence you wrote means.
I’m not trying to be argumentative. I just want clarity. This is important for us to understand.
On October 29, 2014 P123 posted that they had rebuilt the “Fed Model” series: #SPEPSCY, etc. due to recent fix. #SPEPSCY is the S&P500 estimated earnings for current year with weekly values. This series is used for the SPY-SH model. We subsequently checked the effect of this change and found that the backtest performance was now less than before the #SPEPSCY change. Today, on 12/7/2014, we made a minor revision to the model’s algorithm to improve overall backtest performance and this would have resulted in the model switching to SPY on 9/15/2014 had we made the revision before that date, which we could not do since the P123 change was made later on Oct-29.
Had the estimated earnings series not been changed we would not have made any changes to the model. Going forward the model will use the changed algorithm to generate signals.
The note also says:
“The Ready-2-Go model Best(SPY-SH) Gains for Up & Down Markets has been revised on 12/7/2014. The revised model holds SPY. However for now, and to be consistent with Portfolio123, we report on the holdings of the unrevised model.”
And, right above that – the iMarketSystems update says quote: “model holds SH.”
So… which is it? Should we be holding SPY or SH?
Are iMarketSystems subscribers being kept in SH to be “consistent” with the unrevised Model – even though it’s based on flawed data?
I apologize for leaving so many posts. But this is extremely confusing on so many points, not just one.
I hope you guys can provide timely answers. Not sure how often you check this. Just want to know what I’m supposed to do tomorrow.
No need to apologize. Sorry that this is so confusing. Since we want to follow the R2G signals we will have to wait for the Monday morning email from P123 to know whether the algorithm revision we made today will be effective when they run their updates with Final Weekend Data at 3:00 AM on Monday. We will email all iM members following the model once we receive this information.
A friend of mine warned me that stock market systems which perform well in back-testing scenarios often fail to work in real-time due to the inevitability of “revised data.”
Backtesting uses finalized, already-revised data – but when you’re working in real-time – there are always reporting errors and data revisions and re-interpretations which end up hurting what seem like very robust systems.
This may not be the case here, but now I’m beginning to understand what he means.
Your friend is correct. Out-of-sample performance is usually lower than backtest performance for the reasons given.
To mitigate risk and drawdown we use the (SPY-SH) model with the other two ETF models in Combo3. This has neutralized the recent poor performance of (SPY-SH) due to good performance of (SSO-TLT) and the Sector model.
Thank you for your quick replies above – I didn’t even see them while I was posting. The info helps.
This will probably be the first year Best SPY/SH will show a major double-digit percentage under-performance to the S&P, simply because of series revisions.
I’m still confused. If the P123 version of Best SPY/SH is currently in SPY, is the iMarketSignals version of Best SPY/SH going to stay in SH until P123 signals a change? (In which case they would both be in SH).
What if there is no change for the next year and the S&P goes up 200 points, or 300, or 500? Would the iMarketSignals version stay in SH the whole time? If so, does that make sense?
I’m not exactly sure what’s going on based on your previous statements. I’d like a fuller explanation.
The P123 model is not in SPY, it is also in SH. What is reported here at iM is the performance and holdings of the R2G model at P123. It is not different.
Hello, the system has for the second year a negative perf., what’s your comment? Thanks, Ramon
As posted before, end of Oct-2014 P123 rebuilt the “Fed Model” series: #SPEPSCY, etc. due to recent fix. #SPEPSCY is the S&P500 estimated earnings for current year which is used for the SPY-SH model.
The great market volatility during the last few months together with the change to the series data affected the model negatively. The system had a negative performance for 2014 and before also underperformed SPY by 4.5% over 2013.
As noted in the R2G model description that “incorporating this model into a book of similar models from other designers and rebalancing regularly should add alpha and lower maximum drawdown and risk.”
To mitigate risk and drawdown we use the (SPY-SH) model with the other two ETF models in Combo3. This has neutralized the recent poor performance of (SPY-SH) due to good performance of (SSO-TLT) and the Sector models.
Is there a downloadable spreadsheet available with all the trades for this system?
Unfortunately we do not have a downloadable spreadsheet of the trades. All the trades to August 2013 are listed in Table 3 of the model description. Subsequent trades can be found at P123. http://www.portfolio123.com/app/r2g/summary/1098426
Tab: Closed Trades
Gentleman. Would it be possible to provide an updated graph with risk premium levels? I would find it very comforting to understand why the model is generating an SH hold at this time. I appreciate your consideration.
Referring to the following chart:https://imarketsignals.com/wp-content/uploads/2013/09/spy-sh-r1-fig1.png
Could you explain why the model sold SH and bought SPY with increasing VIX, falling earnings, and, generally falling S&P Index? Thanks, Bob
The model has a sell rule which when the VIX exceeds a certain value and a short moving average of SPEPSCY exceeds a long moving average of SPEPSCY it sells SH. This was the case on 8/22/2015, which is the date of the data P123 uses to rebalance the models over the weekend.
SPEPSCY: Calculated using the Current Year Consensus Estimates for the S&P500 stocks on a weekly basis.
What would the risk/reward relacing spy with sso and with qld , in the spy/sh model?
Are the stats in P123 book simulation still accurate after the launch of smart alpha given the changes of their S&P earnings est calculations? I was assuming that following their re-launch that the stats would be updated to reflect revised info but it may be the same numbers as before, I’m not sure. Could you post a snapshot of the current/revised “annual” stats including annual draw downs if possible?
P123 has recently mentioned making changes to earnings est’s data feed source in this thread https://www.portfolio123.com/mvnforum/viewthread_thread,9308 Do you foresee any new challenges like we saw with the Oct 2014 thru July of this year with the SPY-SH model if P123 makes more changes around earnings data?
The stats of portfolios are not updated when there are changes to historic data, only simulation will reflect the changes.
The backtest simulation of the SPY-SH model for the period shown in the model description (1/3/2000 to 8/31/2013) now shows a return of 27.2% with a max D/D= -22.75%.
The simulation of the SPY-SH model for the period 1/3/2000 to 11/29/2015 now shows a return of 25.54% with a max D/D= -22.75%.
The smart alpha portfolio of the SPY-SH model for the period 1/3/2000 to 11/29/2015 now shows a return of 26.16% with a max D/D= -22.75%.
So far the most recent changes to earnings estimates data does not seem to have affected the simulated model performance detrimentally.
what would be the cagr/dd if spy is replaced with sso?
When the signal is given on the Sunday to close a position & enter a new one. What are you using as the entry price? Monday close for example? Thx
Monday prices are used determined according to this formula:
(Hi + Lo + 2xClose) /4
Thank you. Are you using the same formula for the strategy SSO-TLT?
All live models use the same convention to calculate prices.
When you say all live models, do you mean all ETF models or all models including the equity ones like im best 2×4 & vdigx as well? Thx
All iM models are live, ETF and equity as well.
Formula is (Hi + Lo + 2xClose) /4 .
What would the returns be if you used qqq/psq with the signals from this model? Thanks.
I have a question about this model. As can be seen from the FED chart below, since 2008 there has been a high correlation between the stock market and the monetary base. It appears that we have been living in “a different world” since 2008. I’m wondering if and how this affects this model: https://research.stlouisfed.org/fred2/graph/?graph_id=309790
Thanks
Could I please get a break down of returns by year starting with 2000- and ending with 2018.
Thanks
Best(SPY-SH).R1
Year … Return (%)
2000 … -11.87
2001 … 19.69
2002 … 33.75
2003 … 22.12
2004 … 24.88
2005 … 1.49
2006 … 22.07
2007 … 4.64
2008 … 87.74
2009 … 57.84
2010 … 22.91
2011 … 29.03
2012 … 17.35
2013 … 31.74
2014 … 12.94
2015 … 5.11
2016 … -9.03
2017 … 22.26
2018 … 6.41