
After publishing our iM-Best10 portfolio management system, we received critique that the high returns obtained may have been distorted by what is known as survivorship bias. Indeed, our subsequent research showed that the magnitude and polarity of survivorship biased returns depend on the market capitalization of the stocks in the stock pool and the model’s selection criteria. Consequently, our Best10 system’s algorithm has now been changed to select stock from the point-in-time composition of the S&P 1500 to ensure unbiased returns. The algorithm periodically rebalances the portfolio to hold the ten highest ranked stocks and additionally reduces stock holdings during deteriorating markets by the newly added draw-down protection rules.
We employed a web-based stock trading simulation platform to test the hypothetical performance of our model. Trading stocks selected from the S&P 1500 pool using the revised survivorship bias free Best10 algorithm would have generated annualized returns of 49.2% for the period January 1999 to May 2013, and without draw-down protection 45.5%; both a multiple of the 3.8% that SPY (the ETF tracking the S&P 500) produced over the same period.
Ranking System
To find stocks which may be undervalued all stocks of the S&P 1500 point-in-time pool were ranked weekly according to the following parameters:
- Valuation (measured as market capitalization, debt and cash relative to earnings before interest, taxes, depreciation & amortization, future cash flow and projected earnings),
- Efficiency (measured as free cash flow relative to total assets),
- Financial Strength (measured as free cash flow relative to total debt),
- Short Interest (being the short interest ratio),
- Trend (measured as the stock price relative to a moving average of the price),
with the highest rank obtainable being 100.
To determine the robustness of the ranking system we performed a sensitivity analysis. Each parameter’s weighting was varied by 5%, one at a time, and the change in average annual return recorded. The average reduction of the 49.2% return was 3.1% with a maximum of 5.0%. This study indicated that the model is not dominated by any single parameter, but each parameter contributed near equally to the models overall performance. Therefore, we are confident that the model is robust and one can expect future performance to be similar.
Trading Rules
Stocks are sold from the portfolio once their ranks falls below 96 and are replaced by the highest ranked stocks at that time in the pool. The model does not restrict buying to stocks to those which are ranked 96 or higher.
The model assumes stocks to be bought and sold at the next day’s opening price after a signal is generated. Variable slippage accounting for brokerage fees and transaction slippage were taken into account. Taxes are assumed to be deferred, as for retirement accounts.
Performance
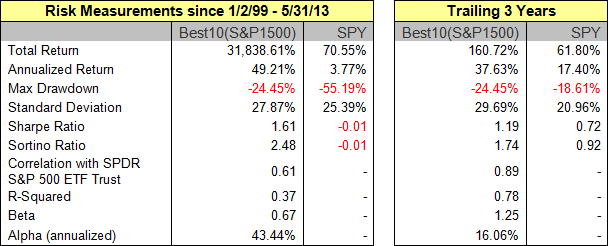
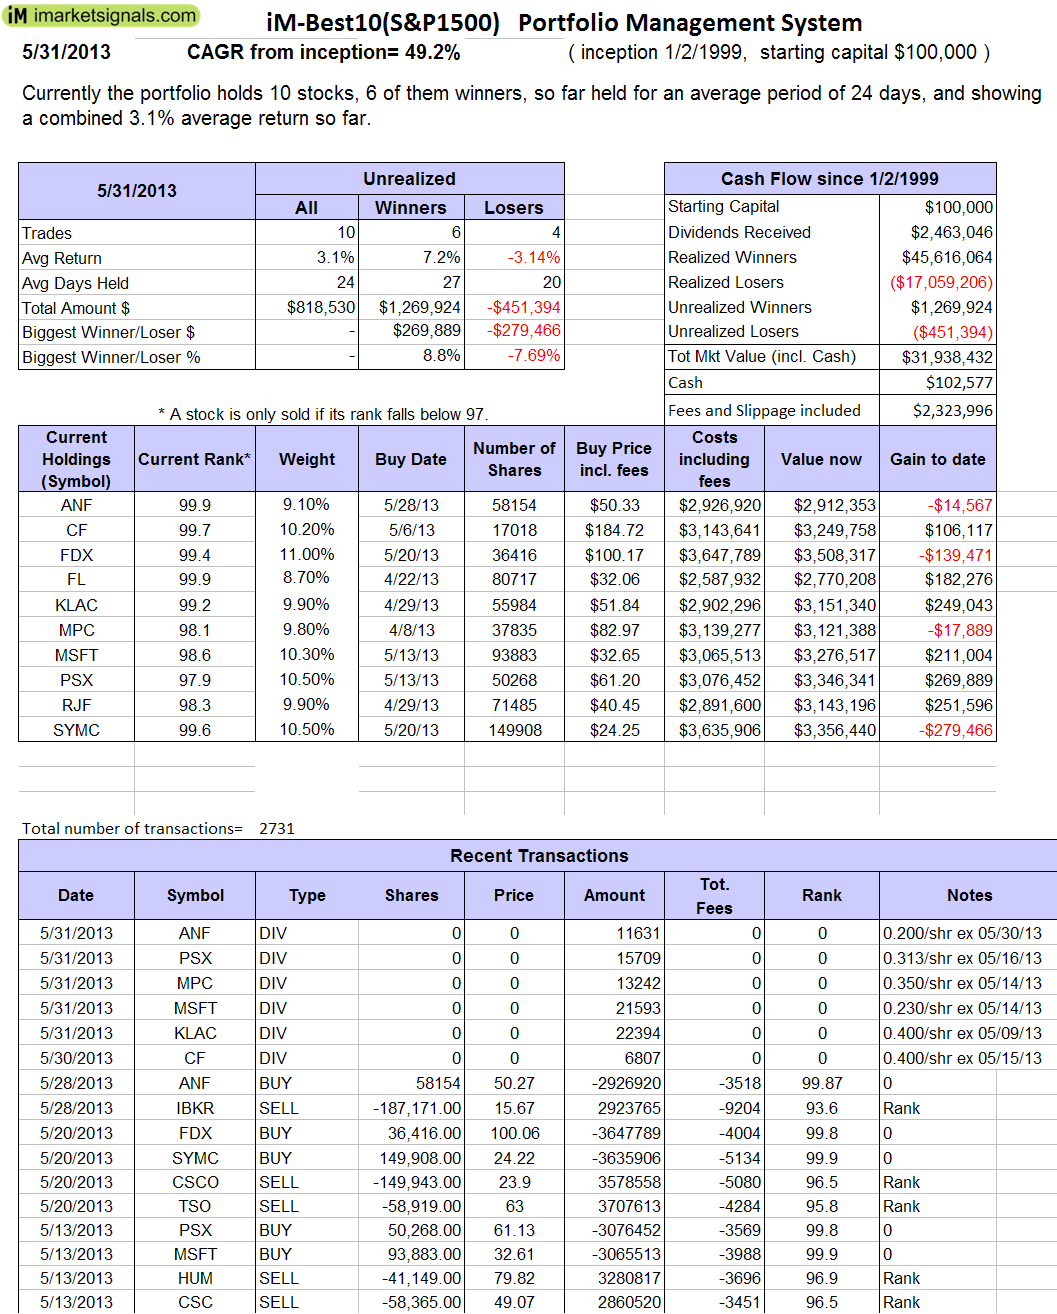
The trading performance of the system is shown in Figure 1 further down. The annualized return from January 1999 to end of May 2013 was an exceptionally high 49.2%, and the maximum draw-down was 24.5%, $100 grew to about $32,000 over this period. This assumes no interest income when the model was in cash.
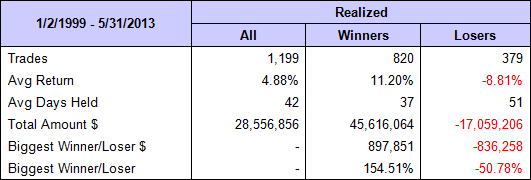
The model assumes an initial investment of $100,000 on Jan-2,1999. It normally holds no more than 10 stocks. To May 31, 2013 there were 1,199 completed trades, 820 of these were winners and 379 losers as summarized in the table below, the amounts shown include transaction costs of $2,323,996 arising from slippage and brokerage commission.
 Click to enlarge
In above chart, the lower green line is the ratio of the Best10(S&P 1500) index to the SPY index, the general rising trend of that graph indicating that the Best10(S&P 1500) outperforms the SPY; it produced 187 times the value which one would have had from a 1999 buy and hold investment in the SPY.
Performance during recession periods and drawdowns
One can further improve returns by investing in treasuries when the drawdown protection rules keep the model in cash, as occurred from 10/13/2008 to 12/12/2008. This would have increased the CAGR to 50.8%.
The maximum drawdown from 1999 to 2007 was 15.6% in October 2000, while the maximum drawdown after 2007 was 24.5%, occurring early in October 2011 when the market declined as a result of the gridlock in Congress over whether to allow the national debt to increase.
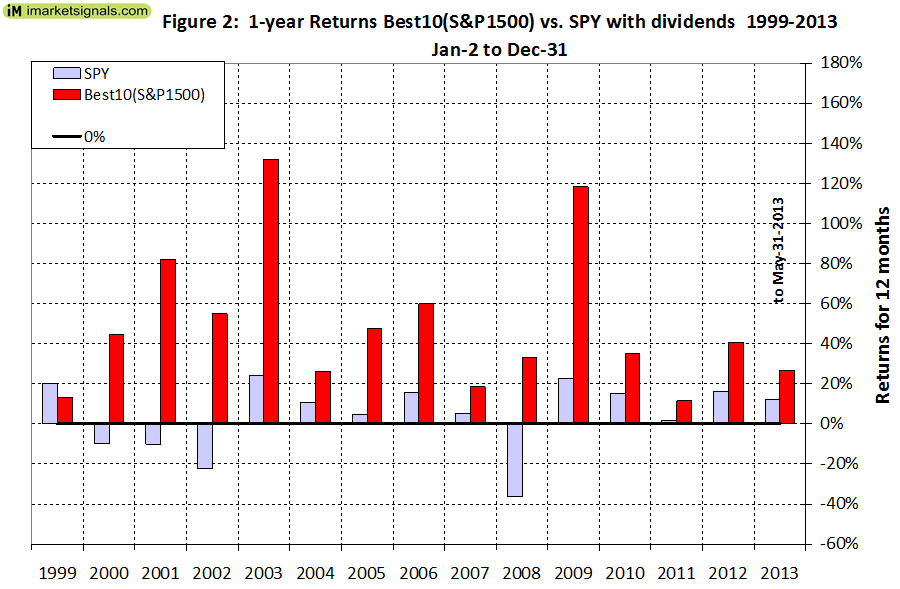
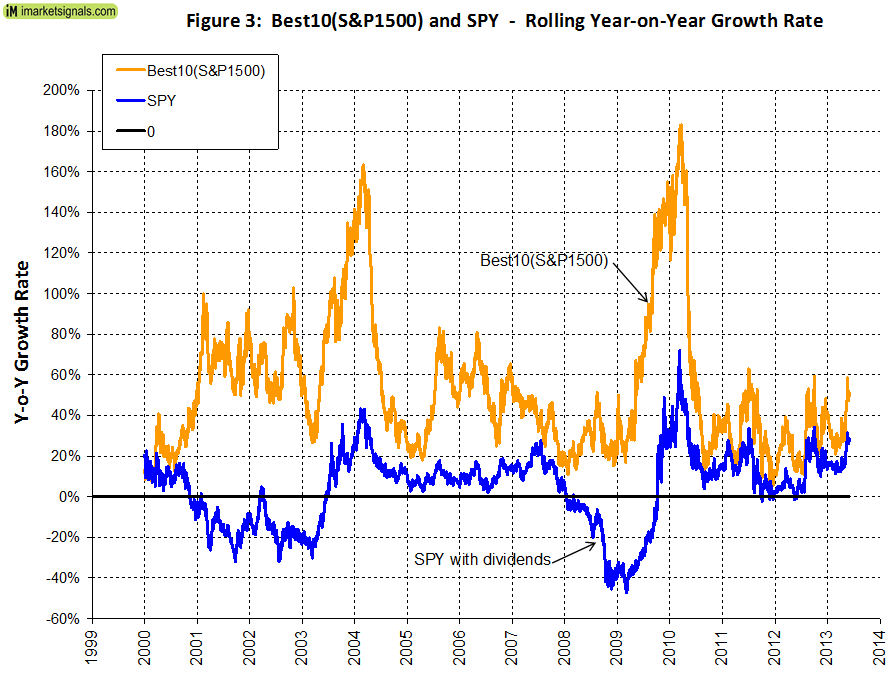
Annual Returns
Annual performance from January to December ranged from a maximum of 130% for 2003 to a minimum of 12% for 2011, as can be seen in Figure 2. In Figure 3 the running 12-month returns for SPY and Best10(S&P1500) are shown. One can see that Best10(S&P1500) always outperformed SPY over a 12 months period, except for investments made in the first few months of 1999.
 Click to enlarge
Terminal Values
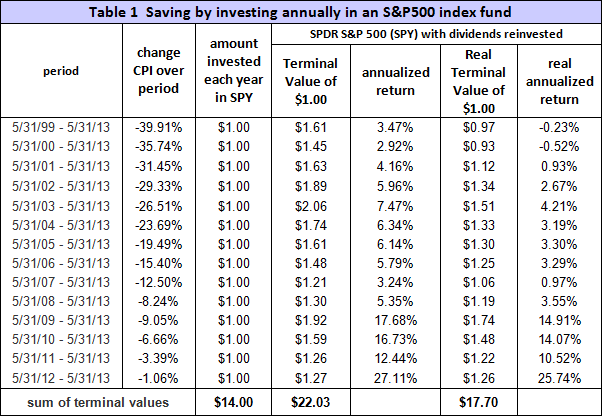
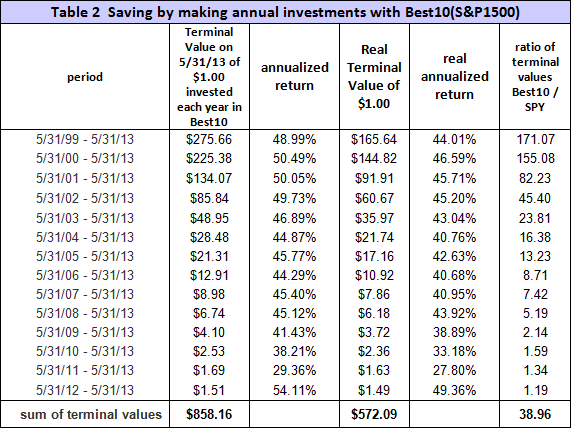
Table 1 in the Appendix shows the terminal values to the end of May 2013 for annual investments in the S&P 500 index fund SPY on an ongoing basis for the last 14 years. Assuming an investment of $1.00 at the end of May of every year, from 1999 to 2012, one would have invested a total of $14 cumulatively by the end. Summing the 14 terminal values, this strategy would have netted the sum of $22.03 by May 31, 2013, and accounting for inflation this would only have amounted to $17.70.
Making the same $1.00 annual investments in a portfolio managed according to the Best10(S&P1500) trading system would have provided a terminal value of $858,16, as shown in Table 2 in the Appendix. That is 39 times of what one would have had from an S&P 500 index fund. Furthermore, the lowest annualized return for the various time periods was 29.4%, and the average of all the periods was just over 45%.
Liquidity
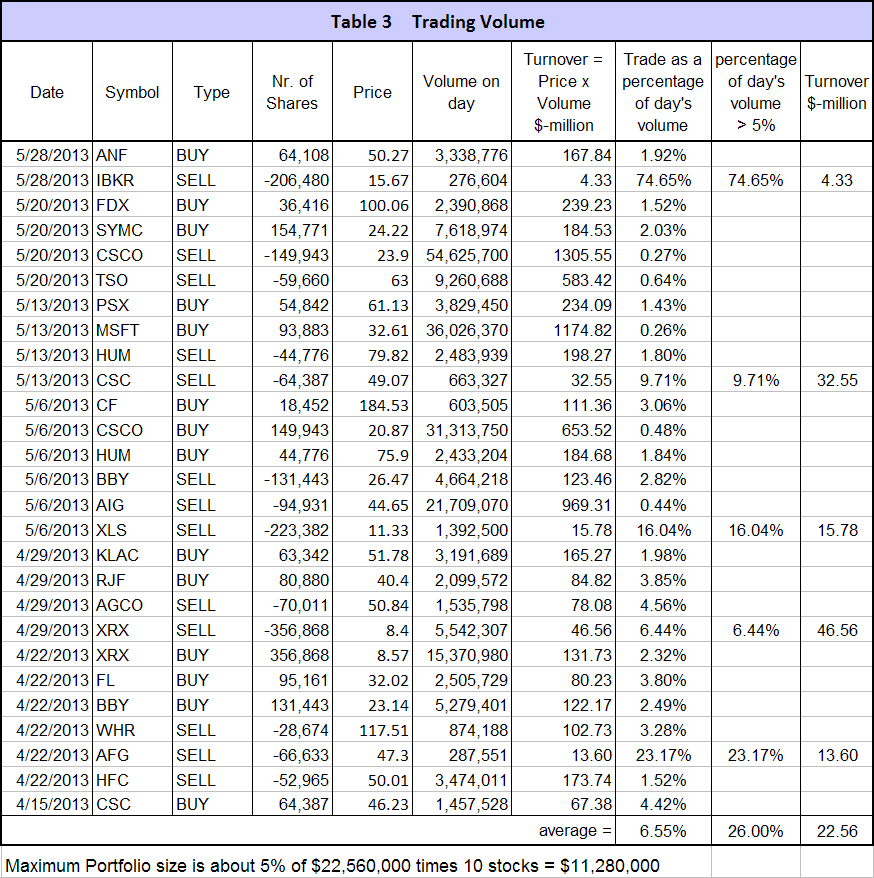
Table 3 in the Appendix lists the last 27 trades to May 31, 2013, and also the actual total trading volume for these stocks on the days when the trades occurred. This portfolio has a value of about $32-million and the individual trades require a large number of shares to be bought and sold. Although most required trades were for large and mid-sized companies, there were some trades of smaller companies which were comparatively large in relation to the actual daily volume traded. Assuming that one could comfortably trade 5% of a stock’s daily turnover then the maximum portfolio size would be about $10-million. Thus the Best10(S&P1500) system is suitable for sizeable portfolios, because most stocks in the S&P 1500 are highly liquid and easy to trade.
The above is illustrated in Table 4 of the Appendix, which shows the 2-year returns (growth of $100,000 over 2 years) and the allocation by market capitalization. The large- and mid-cap companies make up the majority of the holdings.
Conclusion
This portfolio management system does require 4 to 6 trades each week (resulting in an average annual portfolio turnover of 795%), but this small weekly effort would have provided high returns.
A simple ranking system is consistently applied to the stock selection process, which a sensitivity study showed to be very robust. This is this not a complex, high risk system with many parameters which could cause the model to easily break down. Additionally, selecting only from a known pool of S&P 1500 stocks assures liquidity, even if the portfolio value is fairly large. The returns are not distorted by survivorship bias, and we are confident that this model will continue to outperform in the future as well.
More particulars can be found on our website’s “Systems” page where one can also follow weekly the progress of a Best10(S&P1500) portfolio having an inception date in January 2009
Appendix
 (click for enlarged view)
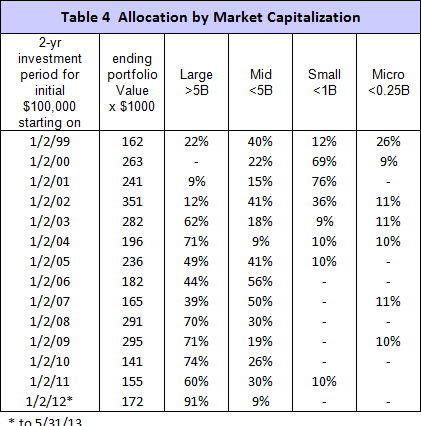
 (click for enlarged view)
Note: Dividends Received includes funds from stock splits. The model does not increase the number of stocks when a split occurs. The value of the additional stocks is accounted for as dividends.
Variable Slippage
The model assumes that stocks are bought/sold at the next day’s opening price. Since one may not be able to obtain the opening price for the whole transaction, a slippage factor is applied to account for a possible higher/lower price for the transaction.
The slippage percentage is calculated for every transaction based on this algorithm:
1) The 10 day average of the daily traded $-amount is calculated (price*volume).
2) The slippage is set according to where the average falls in this table:
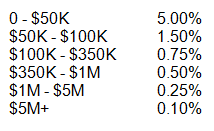
3) Add (1/ Price)% to the result from Step 2.
For example, Step 3 would add 1% to the slippage if the stock trades at $1, 0.1% if it trades at $10, etc.
For the following transaction
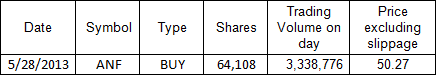
the slippage percentage would be (0.10 + 1/50.27) = 0.120% of $50.27, amounting to about 6 cents per share. So the average price per share paid for this transaction is $50.33.
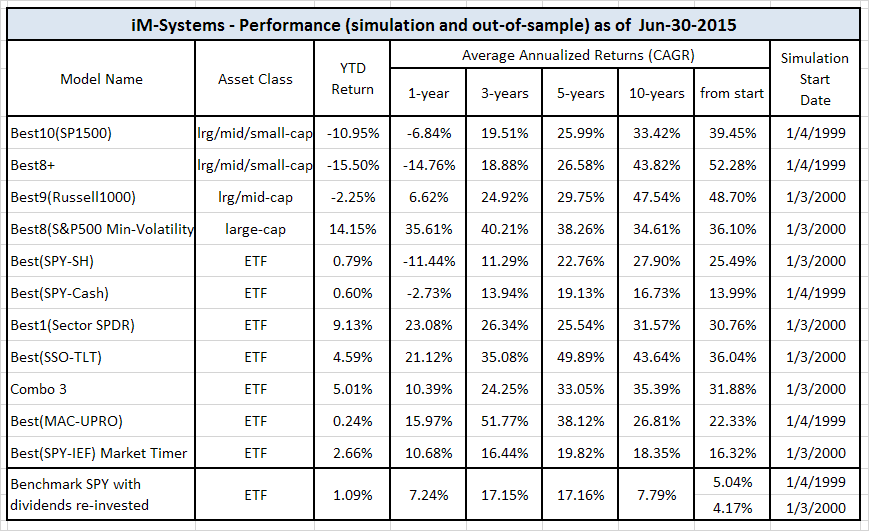
iM-Best Systems
Quick Comparison
Quick Links to Model Descriptions
R2G & iM(Silver) iM-Best10(S&P 1500): A Portfolio Management System for High Returns from the S&P 1500
R2G iM-Best9(Russell 1000) – Large-Cap Portfolio Management System
R2G iM-Best8+ Portfolio Management System
iM(Gold) iM’s Best12(USMV)-Trader Minimum Volatility Stocks
iM(Gold) iM’s Best12(USMV)Q1..4-Investor Minimum Volatility Stocks (The Q3 model available to Silver)
iM(Silver) iM-Best10(VDIGX) Trading the Dividend Growth Stocks VDIGX
R2G & iM(Silver) iM-Best(SPY-SH) Market Timing System: Gains for Up and Down Markets
R2G & iM(Gold) iM-Best1(Sector SPDR) Rotation System
R2G & iM(Gold) iM-Best(SSO-TLT) Switching System
iM(Gold) iM-Best Combo3: Best(SPY-SH) + Best1(Sector SPDR) + Best(SSO-TLT)
iM-Best(SPY-Cash) Market Timing System
iM-Best(SSO-SDS): Beating the Market with Leveraged ETFs
Survivorship Bias: neither Myth nor Fact
Quick Links to Ready-2-Go Models
Best(SPY-SH) Gains for Up & Down Markets
When subscribing to P123 please use this link or enter token IMARKETSIGNALS when registering to obtain 30 days free membership.
Disclaimer: The opinions in this document are for informational and educational purposes only and are obtained from a mathematical algorithm and should not be construed as a recommendation to buy or sell the stocks mentioned. Past performance of the companies may not continue and the companies’ stock values may decline. The information in this document is believed to be accurate and represents the output of a mathematical algorithm, and under no circumstances should a person act upon the information contained within. We do not recommend that anyone act upon any investment information without first consulting an investment advisor as to the suitability of such investments for his specific situation. Also see our Terms of Use/Disclaimer.
Is this system available for trading?
Best10(S&P1500) should be available for subscription at the R2G section of Portfolio Simulations from July 11 onwards. This would provide email notification over the weekend of the trading signals which are generated on Saturdays.
Alternatively you can observe the performance of this model at imarketsignal.com evey Friday, which will reflect the model’s position on the Monday before.
are you going to run the fully invested model and the one that goes to cash
Also will the models just show up on Portfolio Simulations tomorrow under IM-best10
Best10(S&P1500)is normally fully invested and only reduces holdings when the moving average crossover system incorporated in the model signals weakness of the market.
The model is already on the R2G section of Portfolio Simulations and has the name of Best10(S&P1500), but is not open to subscribers yet. I was told that it will be open on July 11.
This is a very interesting system. Questions:
1. It looks like you are using Portfolio Simulations for the ranking system. Is the ranking system proprietary ? If not, can you share it ?
2. Are you using any kind of market timing ? I mean if you are closing positions when the timing system indicates so. If that is the case, which is the timing system ? If not, then the resuls in 2008 are nothing short of spectacular.
Thanks
eb
We use a proprietary ranking system using the parameters described in the article, to which we applied a sensitivity study to ensure that none of the parameters influenced the model’s returns too much. It is not a Portfolio Simulations ranking system.
We are using a moving average cross-over system, which incorporates some our research from the MAC system, to stop buying of stocks when market conditions deteriorate. Positions are only closed when a stock’s rank fall below 97.
Would love to see a longer lookback for the system
Unfortunately we can’t do that, because the simulation platform has only got point-in-time data from 1999 onwards.
Very impressive work, particularly now that you have a survivor free backtest!
Does one need to subscribe to both Portfolio Simulations and R2G to gain access to this model?
Unfortunately yes. But you can get the trading signals delayed by a few days each Friday here when we update the model. However, we have no obligation to publish the signals here, whereas if you subscribe to the model at Portfolio Simulations they will email the signals every weekend directly to you.
I suggest that you watch the progress of this model for some time on our website before making a decision whether you want to commit any money to it. Remember this is just a model, not a recommendation to trade accordingly.
when can anyone start to subscribe Best 10 for $80 from Portfolio 123?
how many positions are available? Can you arrange special membership package
for using your model only at discount rate say $200/year.I spent a lot of time comparing all the model on Portfolio 123 and conclude that Best 10
is absolutely the best in overall consideration. Thanks for your excellent
research work presenting us such a great model to share.
I have a problem too with the subscription rates to P123 for people who are only interested in following a R2G models. You should email Marco at P123 (marco@portfolio123.com) and ask him to lower the membership rate. I have done this already and it is under consideration.
The model is open for subscription now. It incorrectly says that there are still 498 seats available. The maximum seats available will be 20. There are 2 subscribers already after today’s launch, so there are 18 seats left.
You are absolutely correct that this is the best model on the R2G site. Also there are many models there that conveniently have an inception date later than Jan 1999 and many models trade in micro-caps only. 1999 and 2000 were difficult periods for the market and many models have a problem there, so it is convenient to start one’s model after those years. Also you must watch the benchmarks being used. The model’s returns are all with dividends, but most models have the S&P500 as the benchmark, which is without dividends. They should have used SPY which is with dividends – then the alpha, sortino- and sharpe-ratios would we worse than what they show.
All our Best10 models are, and will be, using SPY for a true comparison of returns. We will publish Best10(S&P500) with a 1999-2013 CAGR of 34.2% and a max draw-down of -18% soon. This will be suitable for large portfolio values up to $150-million. So if you want to run a real large portfolio wait for this model.
It would be interesting to see how the system would peroform in a backtest that only makes weekly trades. i.e., just trading based on your Friday posted updates.
The system only makes weekly trades. Signals are generated on Saturday with Friday’s closing data. The signals are then communicated by email to paying R2G subscribers to the model, so they can trade on Monday. We report the Monday position here 4 days later on Friday for our Best10(S&P1500) model starting on Jan 2, 2009.
Therefore the stocks will be the same, but the numbers will differ because the R2G model has a launch date of 1/2/1999 with a starting capital of $100,000.
So the only way to view the stocks before a Monday is via R2G? This requires a P123 account AND the R2G subscription? Or, one can view the list 4 days later here?
You can see the list 4 days later on Friday here. If you want it on Monday you have to be a subscriber to the R2G model and a member of P123.
George, from your Best10 update today I found that $100000 start capital only have grown to $595,782. In your original Best 10 model, the 48.5%
annual return was close to 32 million. Can you tell me why? Thanks!
Since you only open 20 seats, 4 been taken. you suggest we follow your weekly updates for a while before decide if subscribe from Portfolio123.
Will you offer extra seats for subscription if 20 seats go quickly.
Is there other way we can buy directly from you?
We use a model starting on Jan 2, 2009 for the updates on this site. In the article we started the model on Jan 2, 1999, 10 years earlier, which is the maximum period for back-testing at P123. Obviously the portfolio values are different if you start them at different times, but the stock selection remains the same.
We will not offer extra seats on the R2G model, because if there are too many people trading according to the signals it may detrimentally affect the stock prices, and it would not be fair to the subscribers to the model who do not expect more than 20 seats all together.
There are no other ways to get the trading signals. You can get them on time by email from P123, or delayed by 4 days on this site.
George,The reason I ask for top 20 ranking is to understand your model better .MPC price drop from 83 to 69 , last 3 months, it’s ranking is always above 96 so it’s still in the holding list. My question is if it’s ranking goes up when share drops because it’s more undervalued? If price drops further, will the ranking drop below 96 at certain point? I assume all other parameter remain the same. Many Thanks!
I don’t think we would want to publish a ranking list continuously here. But since you are a subscriber to the model I will email the past ranking lists to you for analysis.
Is it possible to get the transaction history for this trading system?
The transaction history of Best10(S&P1500) has been analyzed by an independent party in Australia using MPI, a software package that runs portfolio level risk and return analysis. We are waiting for the final report which we will posted here as soon as we get the final version. This comprehensive 14 page report uses the S&P 1500 index as the benchmark.
July 23, 2013
CF Industries is now up 10% intraday. Its part of the Best10(S&P1500), right on top of the holdings table.
Do you accept a waiting list for your model?
Yes, we have a waiting list. Also we will soon have our new model Best8+ available for subscription. Please enter your email in the “Subscribe to Best10 News” box at the bottom of the Best10 page, and everyone on that list will be informed of available seats in the model, as and when they become available, as well as any news on when new R2G models like the Best8+ model is out.
However, subscription to the model is on a first come first serve basis on P123.
Hi. Looks like I missed out on the Best 8 openings so I’ll wait to see if any slots open up on Best 8 or Best 10. I was trying to find though the week delayed info on Best 10; could you direct me to the appropriate page for that portfolio and updates. Thank you.
My apologies; just found it, thanks.
Great system, just found P123 and this site. Do you have any similar models coming out soon that one could subscribe to? I was looking at a subscription at P123 but the one problem I have is the most attractive systems, like yours, are full. I also wanted to know if you were satisfied with P123 for back testing. I’m looking at sites for back testing and some folks I know think I need more history, just wanted your thoughts as I have little experience in this area. The cost if attractive for back testing though. Aslo, have you done any mean reversion systems?
Thank you for your interest in our site and models.
P123 has a comprehensive point in time database from 1999 onwards and we found it most attractive to work with. I am not aware of anybody having a longer period available for backtesting.
Best10 and Best8+ are our stock models with high returns and reasonable trading requirements. You can try P123 by going there using the quick link just above this comment section. This will give you 4 weeks free, instead of the normal 2 weeks. You can register as a watcher at the model to be informed when any slots become vacant.
The new models planned are low turnover ETF models where one only trades every few months. Annualized returns are still about 30%. We will have a Best1 SPDR Sector rotation model shortly available, to be followed by a Best1 Country ETF model.
Really interesting post and system!
I’m curious though that when you list the factors, you list “future cash flow” as one of them. I know that there are analyst estimates for earnings, but I’ve never seen estimates for cash flow. Do you mind elaborating on what “future cash flow” is?
Apologies, this is a typo and should read “free cash flow”. Thank you for bringing this to our attention.
Thanks for the reply! Another question if you don’t mind. I know you cite there being only 5 factors (valuation, trend, efficiency, financial strength, short interest) as a strength and indicator of robustness, with which I agree. Have you optimized the weightings of each factor though or are they equal weight? I ask because there is a danger of overfitting if you don’t equal weight, no?
To determine the robustness of the ranking system we performed a sensitivity analysis, as mentioned in the model description.
Each parameter’s weighting was varied by 5%, one at a time, and the change in average annual return recorded. The average reduction of the 49.2% return was 3.1% with a maximum of 5.0%.
Good work Georg. I just have one question on trend. What trend rules do you use? The reason I ask is that average days held for this system is 42, which is very low as compared to any fundamental system you would use based on valuation.
As per model description the ranking system is not based only on valuation. Stocks are ranked weekly according to the following parameters:
Valuation (measured as market capitalization, debt and cash relative to earnings before interest, taxes, depreciation & amortization, future cash flow and projected earnings),
Efficiency (measured as future cash flow relative to total assets),
Financial Strength (measured as free cash flow relative to total debt),
Short Interest (being the short interest ratio),
Trend (measured as the stock price relative to a moving average of the price).
Very interesting data. However, here’s my simple skepticism: A system that can generate 50% CAGR would grow $100K to $20B in 30 years and 1.1 TRILLION in 40 years. You would end up owning the entire S&P 500 in 47 years! Why do you need to have subscribers when you’re making that kind of return?
Nobody is claiming that the out-of-sample return will match the backtest return. This model was launched end of June 2013 and returned about 39% since then to beginning of December 2014, while SPY gained 33%. Out-of-sample returns are usually less than those shown by the backtest. We make no claim as to future performance.
I am a Silver member and I see holdings through 2013. Do I have to join Portfolio123 to get the current status. If so sounds like a double dip to me.
Ken, The Best10(S&P 1500) holdings are available to our Silver members as can be seen on our schedule of services offered and can be found on the home page. They are updated every Tuesday – here is the update of March 24
For the Valuation, you are using Enterprise Value / (EBITDA + free cash flow + projected earnings) correct? Please confirm, and is projected earnings one year or is it present value of multiple years?