
This model switches between SSO (ProShares Ultra two times daily S&P500 ETF) and TLT (iShares 20 Plus Year Treasury Bond ETF) depending on market direction. Using a web-based trading simulation platform and only market timing buy and sell rules in the algorithm, then this model would have produced an average annual return of about 38% from January 2000 to end of December 2013, versus 3.5% for a buy-and-hold investment of SPY over the same period. This model is currently (Jan-8-2014) invested in SSO.
Model Parameters
The market timing rules use volatility, risk premium, earnings estimates together with moving average cross-overs and include the following parameters:
- CBOE Volatility Index – VIX,
- S&P500 Risk Premium – which is the difference between the Current Estimated Earnings Yield of the S&P500 and the Treasury 10-yr Note Yield,
- Current Year Earnings Per Share Estimate of the S&P500,
- and the daily price of SPY adjusted for dividends.
Performance
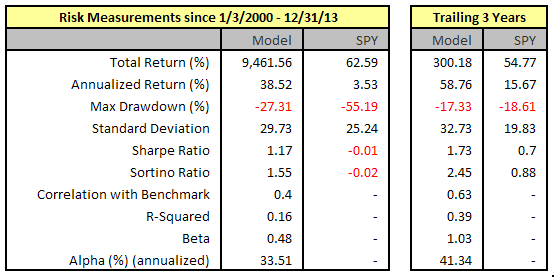
The simulated trading performance of the system is shown in Figure 1 further down. The annualized return from January 2000 to end of December 2013 was 38.5%; $100 grew to $9,560 over this period. The maximum drawdown was 27.3% in October 2002. All values are with dividends reinvested. (Note, that the inception date of SSO was June 2006, values before that date are synthetic, derived from the closing prices of the S&P500.)
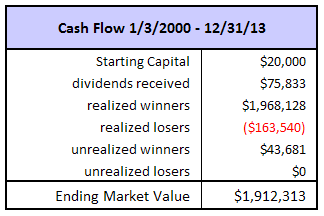
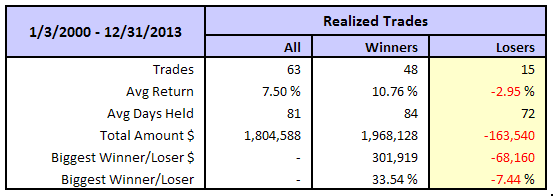
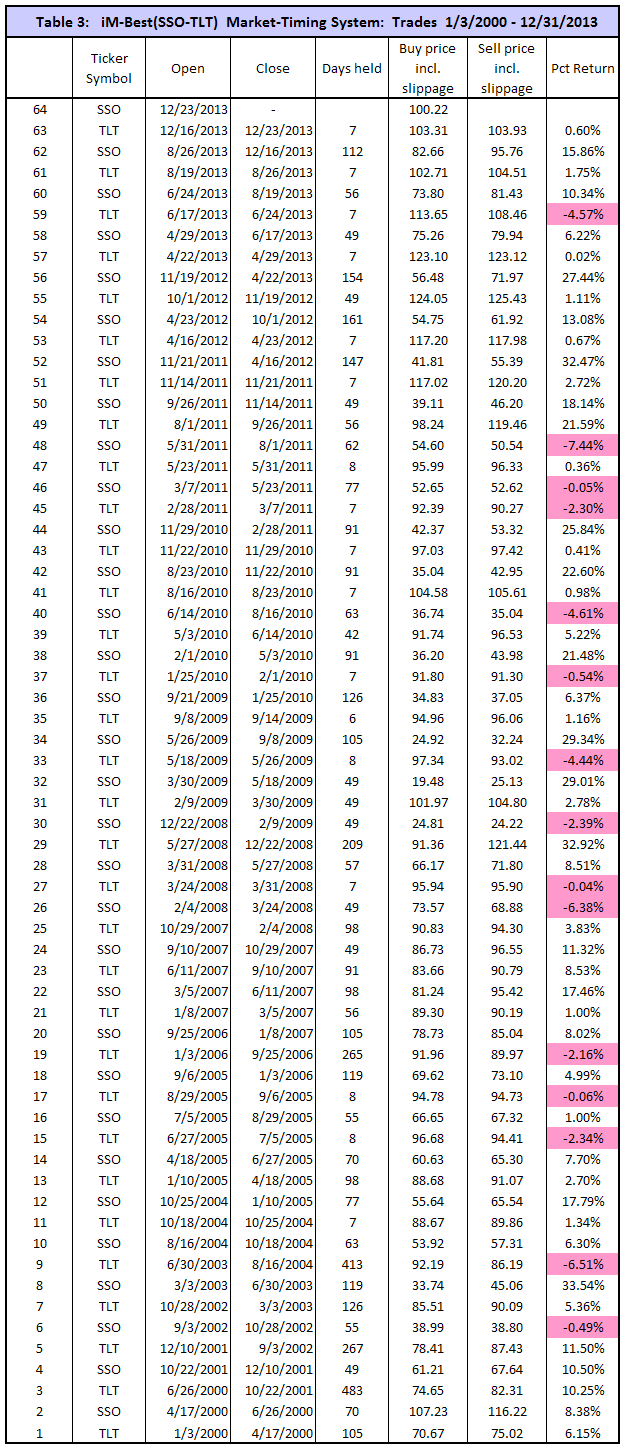
The model assumes an initial investment of $20,000 on Jan-3,2000. It either holds SSO or TLT. To December 31, 2013 there were 63 trades completed, 48 of these were winners and 15 losers, as summarized in the tables below, and listed in Table 3 in the Appendix. The amounts shown include transaction fees of $83,549 arising from brokerage fees and slippage.
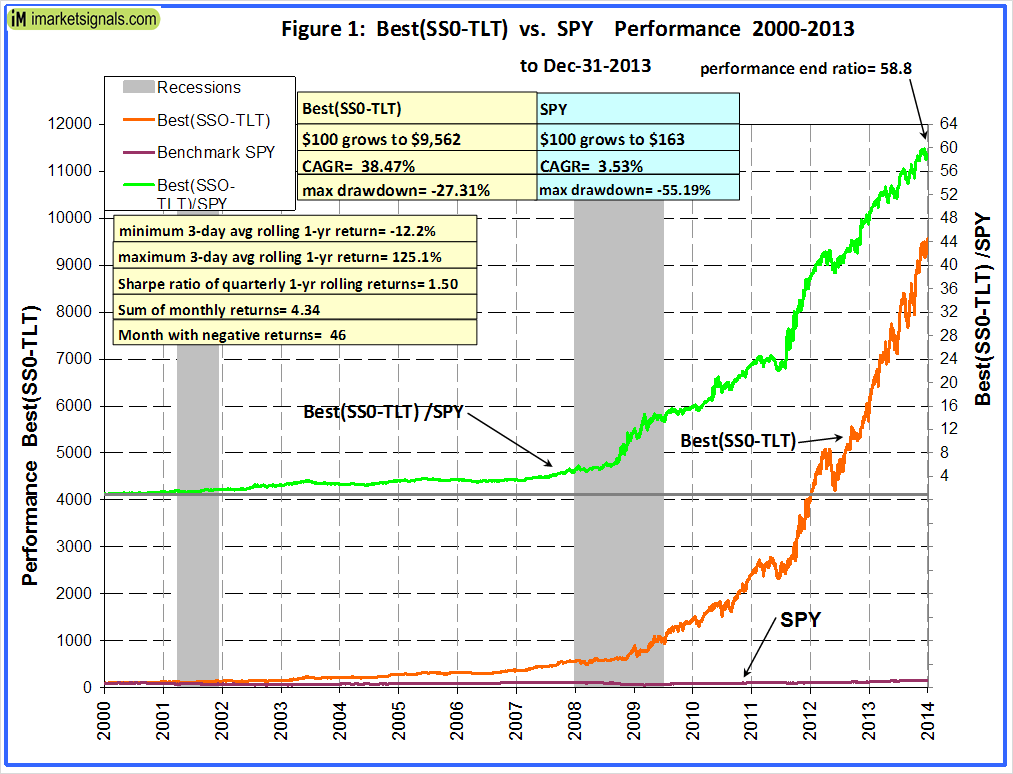
In above chart, the upper green graph is the performance ratio of the Best(SSO-TLT) to SPY. A rising trend of that graph indicates when Best(SSO-TLT) outperformed SPY; it produced about 59 times the value which one would have had from a buy-and-hold investment in SPY over the same period.
Annual Returns
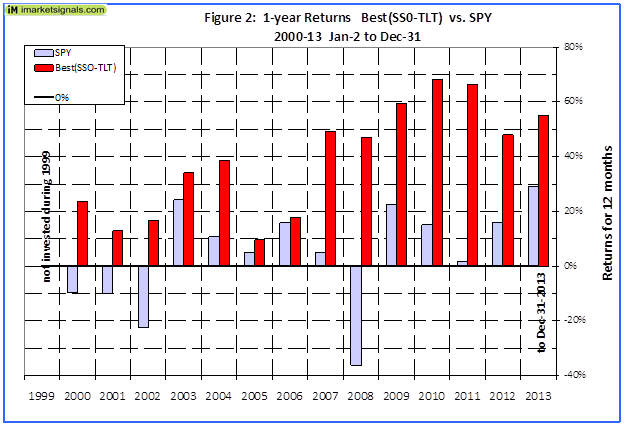
Annual performance from January to December ranged from a maximum of 68% for 2010 to a minimum of 10% for 2005, as can be seen in Figure 2. There was never a loss over those periods.
Rolling 1-year returns
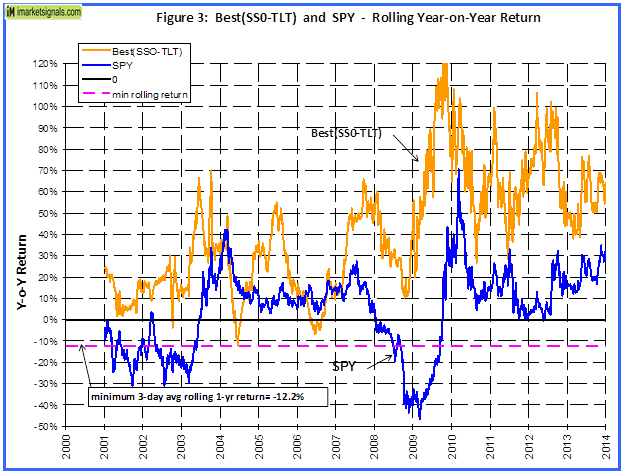
Figure 3 shows the rolling 1-year returns starting each trading day from 2000 to 2012. The minimum return over 12 months was -12% and the maximum was about 120%.
2-year Returns
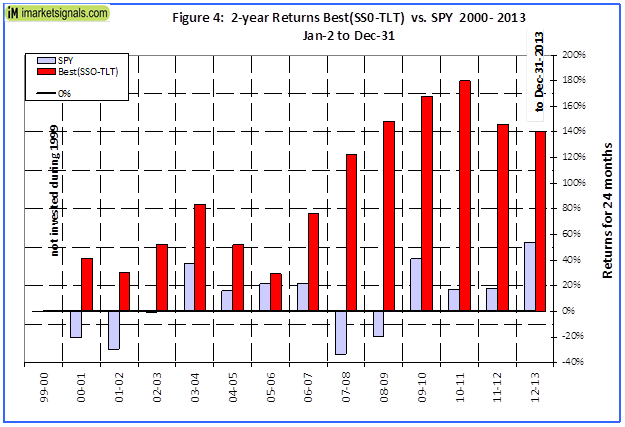
2-year performance from January to December ranged from a maximum of 180% for 2010-11 to a minimum of 29% for 2005-06, as can be seen in Figure 4.
Distribution of Monthly Returns
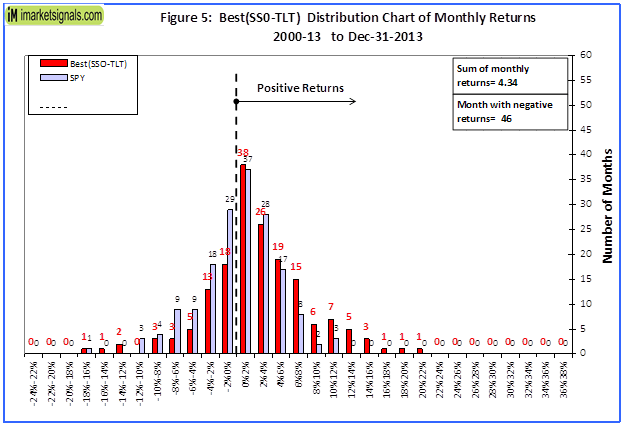
Figure 5 shows the distribution of monthly returns. There were a total of 168 months in the period under consideration. Best(SPY-TLT) produced positive returns during 122 months and only 46 months had negative returns, as is evident from the chart above. SPY had 73 months of negative returns.
Terminal Values
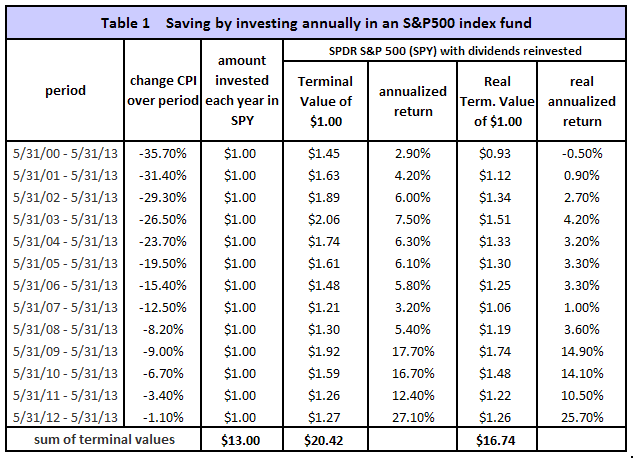
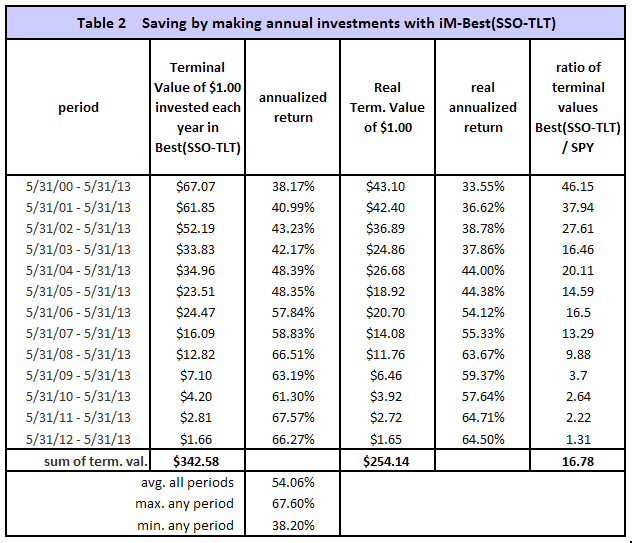
To simulate savings over time, terminal values were calculated to the end of May 2013 for annual hypothetical investments of $1. Starting with a dollar during each of the 13 years from 2000 to 2012, one would have invested a total of $13 cumulatively by the end. Summing the 13 terminal values, this strategy would have netted this dollar-per-year investor $342 at the end of 13 years.
Following a buy-and-hold strategy in SPY, one would have only $22, about 6% of what Best(SSO-TLT) provided. Furthermore, the lowest annualized return, for any of the 14 time periods was 38% and the average for all the periods was 54%. This is shown in Table 1 and 2 in the Appendix.
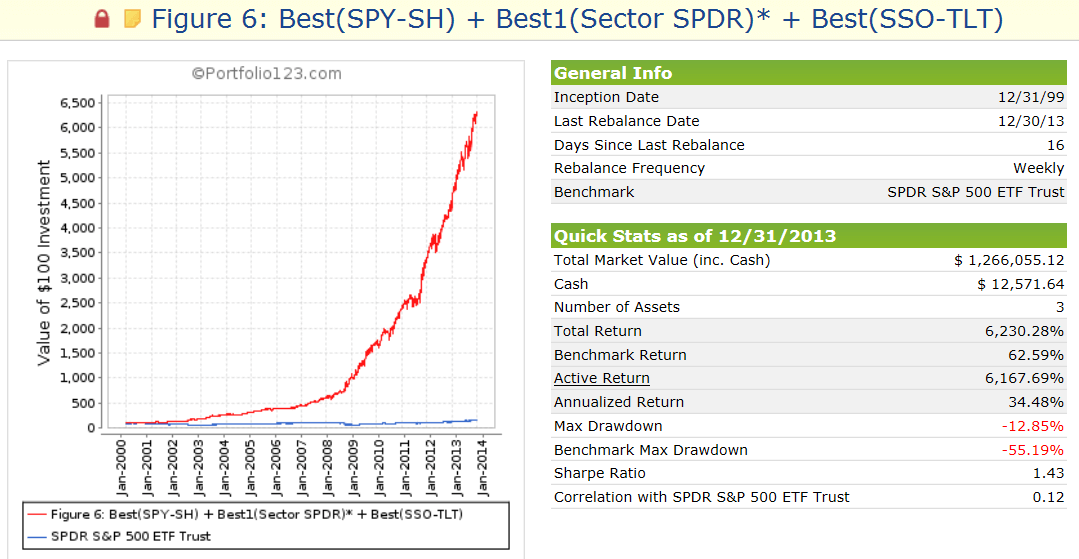
Correlation with other “Best” ETF models
The correlation between Best(SSO-TLT) with Best(SPY-SH) and Best1(Sector SPDR) is fairly low, 0.35 and 0.35, respectively, with 1.0 signifying 100% correlation. Thus a combination of Best(SSO-TLT) with Best(SPY-SH) and Best1(Sector SPDR) should produce a high return with low drawdown. This was tested with a combination model where the three component models were equally weighted. The combo showed an average annualized return of 34.5% from Jan-2000 to end of Dec-2013 with a maximum draw-down of only -12.8%. Also, over any 1-year period, starting at any day from Jan-2000 to Dec-2012, the return from the combo would never have been less than about 3%.
Statistical Analysis
A downloadable MS Excel workbook was set up to calculate the profit and loss of a model’s trading history using historic prices and dividends. All profits and dividends were reinvested. The performance of the model was calculated when:
- Trading at opening price,
- trading at closing price,
- buying at opening and selling at closing price,
- selling at closing and buying at opening price,
- trading at a random price between the days’ high and low. This was repeated 2000 times to obtain data for near life like trading, which can be statistically analyzed.
No slippage was applied to the trades, however for each transaction a $10 fee was included. This statistical analysis uses SPY up to July 2006 and changes to SSO thereafter as SSO was launched on June 21, 2006. The results are tabled below and depicted graphically in Figure 7.
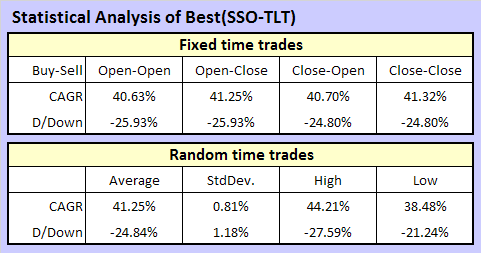
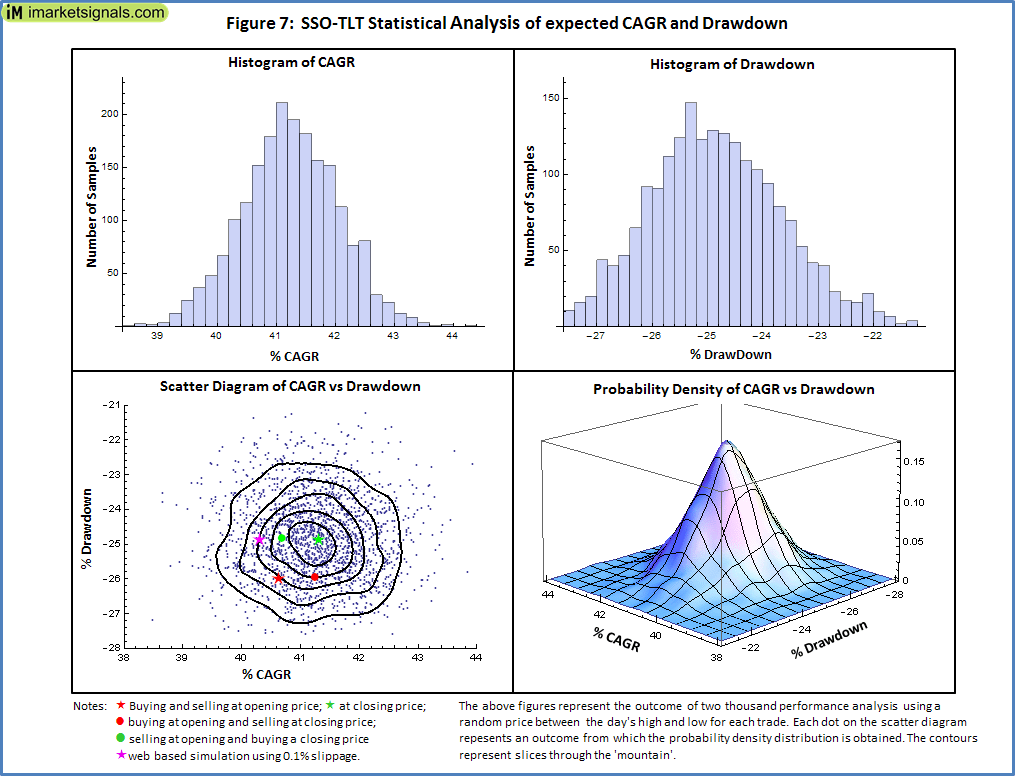
It is clear from above results that this model, if traded live, could have produced a CAGR of 41% with a drawdown of 25% if and only if traded within the last few minutes of the trading day. The expected variance in performance, when trading at random times, can be read from the above graphic.
Using other Treasury ETFs instead of TLT
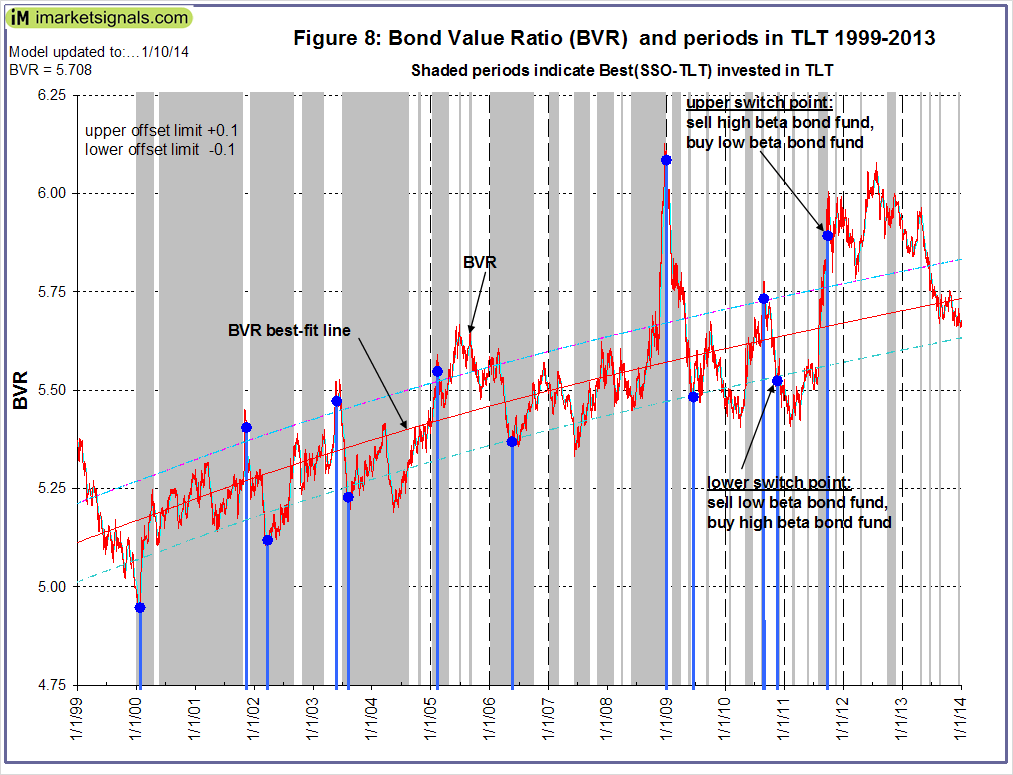
Under certain circumstances returns can be improved by investing in low-beta bond ETFs (such as SHY or MBB) instead of the high beta TLT. One can use the Bond Value Ratio model to determine whether to be in a low- or high-beta Treasury ETF when Best(SSO-TLT) produces a buy signal for TLT. The shaded periods of Figure 8 indicate when the model was invested in a Treasury ETF. Use TLT in up-bond-market periods and SHY in down-bond-market periods as indicated by the switch points of the BVR model. Our MS Excel simulation showed that by switching from TLT to SHY during the down-bond-market periods the average annual return of this model is increased by 1.05% and drawdown remained unaltered.
For example, since 9/27/2011 the BVR model suggests to switch to low beta Treasury ETFs. The down-bond-market is clearly indicated by the declining BVR. (The BVR model values are now out of sample for over 3 years.)
Note: Based on the simulated past performance one could expect this model to continue to perform well in the future as well. However, be aware that all performance results are hypothetical and the result of backtesting only. Out-of-sample performance may be much different. We can make no claims about future performance of this signal, which may include significant potential for losses.
Appendix
iM-Best Systems
Quick Comparison
Quick Links to Model Descriptions
R2G & iM(Silver) iM-Best10(S&P 1500): A Portfolio Management System for High Returns from the S&P 1500
R2G iM-Best9(Russell 1000) – Large-Cap Portfolio Management System
R2G iM-Best8+ Portfolio Management System
iM(Gold) iM’s Best12(USMV)-Trader Minimum Volatility Stocks
iM(Gold) iM’s Best12(USMV)Q1..4-Investor Minimum Volatility Stocks (The Q3 model available to Silver)
iM(Silver) iM-Best10(VDIGX) Trading the Dividend Growth Stocks VDIGX
R2G & iM(Silver) iM-Best(SPY-SH) Market Timing System: Gains for Up and Down Markets
R2G & iM(Gold) iM-Best1(Sector SPDR) Rotation System
R2G & iM(Gold) iM-Best(SSO-TLT) Switching System
iM(Gold) iM-Best Combo3: Best(SPY-SH) + Best1(Sector SPDR) + Best(SSO-TLT)
iM-Best(SPY-Cash) Market Timing System
iM-Best(SSO-SDS): Beating the Market with Leveraged ETFs
Survivorship Bias: neither Myth nor Fact
Quick Links to Ready-2-Go Models
Best(SPY-SH) Gains for Up & Down Markets
When subscribing to P123 please use this link or enter token IMARKETSIGNALS when registering to obtain 30 days free membership.
Disclaimer: The opinions in this document are for informational and educational purposes only and are obtained from a mathematical algorithm and should not be construed as a recommendation to buy or sell the stocks mentioned. Past performance of the companies may not continue and the companies’ stock values may decline. The information in this document is believed to be accurate and represents the output of a mathematical algorithm, and under no circumstances should a person act upon the information contained within. We do not recommend that anyone act upon any investment information without first consulting an investment advisor as to the suitability of such investments for his specific situation. Also see our Terms of Use/Disclaimer.
Hi Georg and Anton,
Would a fund that mimics AGG be a somewhat viable alternative to the TLT ETF, albeit with possibly much more muted returns?
Regards,
Chris
Chris, TLT is not necessarily the best Treasury ETF to invest in. As mentioned in the description one should check the BVR model to decide whether to be in a high beta or low beta bond fund. Our MS Excel simulation showed that instead of switching to TLT but to SHY during the down-bond-market periods the average annual return of this model would have been increased by 1.05%. AGG is a medium beta fund and would not produce the enhanced returns.
Georg,
Thanks for taking time to reply to my comment!
I was wondering if AGG could be a rough substitute for someone that does not have access to alternate between TLT or SHY, which means that they will not be able to take advantage of the high beta / low beta preference from the BVR model.
Instead, since AGG is a medium beta bond fund, when the bond position is in the market, would it still track the returns in a somewhat similar, but muted fashion?
I love all your models by the way!
Regards,
Chris
Chris, I plugged AGG into this downloadable MS Excel workbook and found that returns are reduced by 20% (CAGR 41.3% dropped to 33.8% if no slippage on closing prices is assumed) and drawdown remains the same.
Chris, using IEF instead of TLT, annualized return becomes 33.63% and max drawdown is -27.4%. IEF has an exposure to treasury bonds with remaining maturities between 7 and 10 years, which is similar to that of AGG.
Thank you Anton and Georg for doing the numbers for me, you guys are so quick! I guess it was right, much more muted returns, but still respectable, no doubt! I have downloaded the workbook and I will try to tinker and see different results myself.
Once again, love both your work lots! I’m excited to see how robust these models are for the investing environment that we are in now! I hope the future fee will be reasonable so that I can support you, and I wish you both success! :)
Georg and Anton:
Congratulations on the publication of your SSO-TLT model!
One question: Does the SSO position have a minimum holding period before transitioning to the TLT?
Thank you.
Greg
Yes, 7 weeks.
is the new switching algorithm a paid for subscription?
Currently yes. We may however soon have the signals weekly at iM at a much lower cost. Currently only the Best(SPY-SH) signals are available (at no cost for the time being) at iM by registering in the dedicated box at the bottom of the iM-Best Market Timing Systems page.
I would be interested in purchasing the sso-tlt model on your website here. When will it be available? Hope soon! And will some of the other models be available here?
You are preempting our current development. We soon will have the signals of our iM Best-Combo3 model on our website, although for a reasonable fee. Combo3 is the equal weighted combination our 3 ETF models Best(SPY-SH) + Best1(Sector SPDR) + Best(SSO-TLT).
Hello,
Is there an order link on the website?
Thank you.
Stanley, not yet. Please see the comment above.
Georg and Anton:
Love your work and equity curves but keep thinking of how much pain and damage can be incurred in 7 weeks (your minimum hold on the equity side).
Assuming you have tested shorter minimum holds, can you discuss your findings with those constraints? Perhaps part of an overall strategy is to use several timing systems?
Thank you.
Greg
Greg, to overcome the risks of following only one timer model, we will soon have iM-Best Combo3 available for subscription at iM.
We have tested shorter holding periods but that reduced the overall return for Best(SSO-TLT).
Impressive work, thank you for publishing your work and going into great detail with the statistics and sharing of the dates of entries/exits! With the 7 week minimum hold time of the SSO-TLT model do you have a stop loss factored in during that time?
The SSO-TLT model has no stop loss provisions. If percentage from highest close since position started was set at -15% for SSO and -5% for TLT, then this model would have produced an average annualized return of 32.7% and a max drawdown of -27.8%.
George, what is the best page to watch for the upcoming Combo3 subscription? I am anxious to put it to use!
Right on top of the homepage you will see the holdings, and also subscribe to iM-Best(SPY-SH) News to get an email.
Normally when one ticker is closed the other ticker is bought but in 2009 there is a week without the switch over occurring on the same day. TLT was closed on 9/14/09 but SSO wasn’t opened until 9/21/09. Is this indeed a week where cash was held or is there an error on one of the dates? http://screencast.com/t/GG9tv7tT
Thank You
Yes, model was in cash for one week.
I absolutely love your website and the work you have done. It is exactly what I have been looking for…objectivity, solid statistics, sensitivity analysis, etc… I cannot wait to start implementing it.
I do have a question that concerns when exactly you would choose between a high beta and low beta Treasury ETF.
In Figure 8, the blue points seem to be placed when 1) BVR is outside the best fit envelope and 2) BVR reverses. In early 2005 we have such an occurrence. Yet how come in 2008 a similar occurrence was ignored (turned out to be a false reversal) and instead the blue point was placed later at a much higher value of BVR.
Thank you!
I am glad you like our site and hope that you will continue to enjoy it. Please refer to Figure-3 on the home page which shows BVR in more detail from 2005 to 2014
I am using a moving average of BVR. If you look carefully you will see a blue graph under the red one. (You can see the chart enlarged by clicking on it.) The blue graph is the moving average. In 2008 the blue graph did not move over the upper offset limit line. A switch point is generated when the MA of BVR moves over the upper-offset limit line and subsequently turns down. In December 2008 the Ma of BVR was moving up and up. Until it eventually rolled over in January 2009 to generate the switch point.
Also as discussed in the description of the model, the model has to be periodically re-calibrated, meaning the off-set lines get periodically changed, but the historic switch points should remain. If you check Figure-3 in the original article you will see that the offset was then 0.11. http://advisorperspectives.com/newsletters10/47-betabond2.php
Thank you for your prompt reply!
Hello Mr. Vrba,
Your research is excellent. I really appreciate the objectivity used in your models. I have one question regarding SSO/TLT switching system. What would have been the Annualized Return and Maximum Drawdown if you would have used SPXL instead of SSO? Therefore, the system would now be switching between SPXL and TLT. Thank you for your time!
SPXL is the Large Cap Bull 3x Shares ETF and has an inception date of 11/5/08.
From 11/5/08 to 2/19/14 Best(SSO-TLT) Annualized Return=66.1% and Maximum Drawdown=-26.1%.
From 11/5/08 to 2/19/14 (SPXL-TLT) Annualized Return=99.6% and Maximum Drawdown=-36.6%.
Please keep in mind that the S&P500 had its low on 3/9/2009 and has gained a lot since then. So obviously a 3x leverage would provide greater returns than the 2x leveraged SSO.
Thank you for the quick response! Is this assuming that you enter / exit the trades at a random price during the last few minutes of the trading session? Thank you again.
Price for Transactions Next Average of Hi and Low
Hello Mr. Vrba,
Is there any way you can tell me what is the annual return and max drawdown if there is a minimum of 30 day holding period for TLT? The problem is, some 401(k) plans only allow you to change your current allocation once every 30 days. Thank you!
Model description Table 3 shows all historic trades to 12/31/2013. So far out of 69 completed trades, 20 of them had a holding period for TLT btween 6-8 days. This model cannot be run with TLT held for more than 30 days and would therefore not be suitable for 401(k) plans that only allow changes to current allocation once every 30 days.
Will a revision be required for this model due to S&P earning estimate series change at P123?
No revision is required for the Best(SSO-TLT) model.
Hi George,
For the switch to TLT on December 15, does BVR indicate low beta SHY or high beta TLT?
thanks very much,
Allen
BVR currently (Dec-15-2014) signals investment in short (low beta) bonds. So BVR would not invest in TLT but rather in SHY.
Hi George and Anton,
Will the SSO/TLT performance record reflect purchase of SHY instead of TLT for the last trade?
thanks,
Allen
The model Best(SSO-TLT) only switches between SSO and TLT. It does not invest in SHY. Performance record reflects SSO and TLT prices plus dividends received and minus trading costs.
Hi Georg and Anton:
I just started a trial subscription. I have some questions about the SSO-TLT model.
1. Where do I find the weekly updates? Do I look at the Combo3 for those updates?
2. Where are the trades for 2014?
3. When did SSO-TLT go out of sample?
Thank you,
JP
Hi Georg and Anton:
I think I answered some of my questions.
1. Combo3 shows the SSO-TLT model
2. Scrolling down shows the trades for 2014. How about the first 3 weeks of 2014, I don’t see those.
3. I still would like to know when the out of sample period starts.
Thank you,
JP
1. Correct
2. We document the out-of-sample holdings on our homepage. The model held SSO from 12/23/2013 through to 2/10/2014
3. SSO-TLT is out-of-sample since January 2014.
Hi guys. Out of curiosity, what would performance look like if one bought SDS instead of TLT in the SSO/TLT model?
Thanks.
Tom C
SSO-SDS (1/2/2000 to 5/2/2015)
Annualized Return 38.98%
Annual Turnover 686.96%
Max Drawdown -41.35%
Benchmark SPY Max Drawdown -55.19%
Sharpe Ratio 0.90
Correlation with SPY -0.32
Overall Winners (53/79) 67.09%
Current Holdings = SDS
Georg,
Is there a stop loss component to this model? I was wondering what would happen in a situation where bonds and stocks sell off in tandem. Would the model go to cash?
Has this been updated recently to run through 2018? Can you share those results using the same system?
In the model description the last trade was buy SSO on 12/23/2013. That is 5 years ago.
Results from 12/23/2013 to 12/17/2018
for the model SSO-TLT and for SPY in(___):
Total Return= +86.3% (+53.5%)
Annualized Return= +13.3% (+9.0%)
Max Drawdown= -23.5% (-12.6%)
Georg,
Would you mind posting the trades after 12/23/2013 to be able to complete backtests for both this strategy and the Best(SPY-IEF) Market Timer?
Thanks much!
drftr
Found them by reading all Combo3 reports since 2014. Pfff…
Wonder if there’s no easier way though.
drftr