
This model invests in highly liquid large-cap stocks selected from those making up the Russell 1000 Index which represents the large-cap segment of the U.S. equity universe. When adverse stock market conditions exist the model reduces the size of the stock holdings by 50% and buys the -1x leveraged ProShares Short S&P500 ETF (SH).
Using a web-based stock trading simulation platform with our ranking system, and periodically rebalancing the portfolio to hold 9 of the highest ranked stocks would have produced survivorship biased free average annual returns of about 53% from Jan-2000 to end of Nov-2013. Over any 1-year period, starting at any day from Jan-2000 to Nov-2012, the return would never have been less than 14.7%. The model is appropriately named Best9(Russell1000) and is hereinafter referred to as Best9.
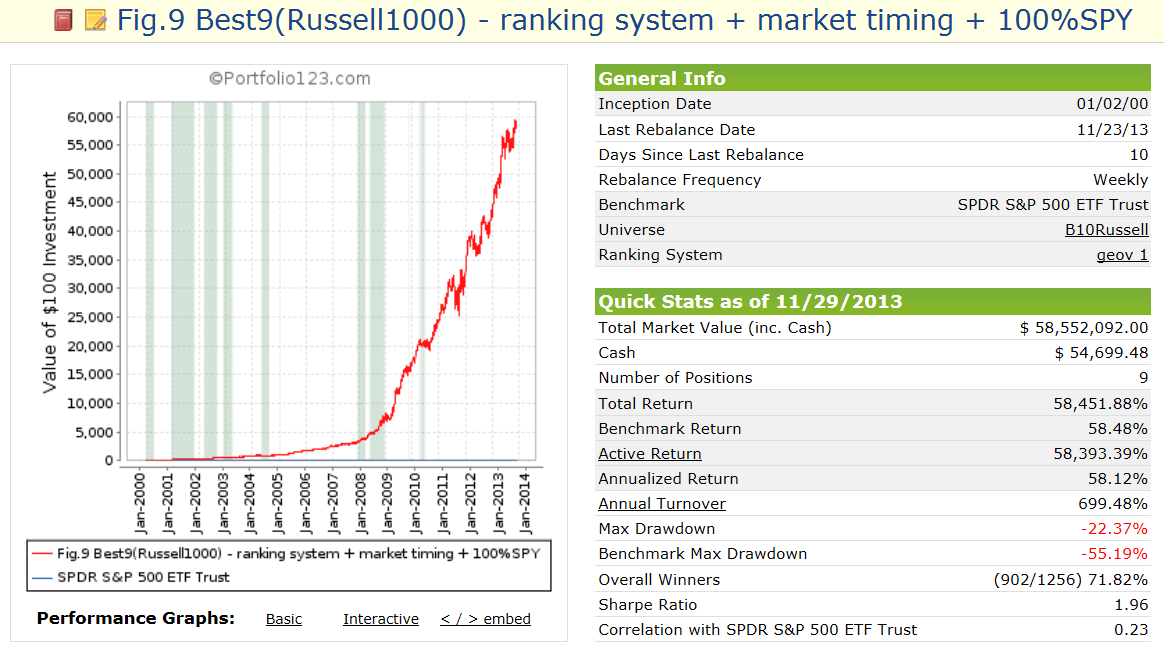
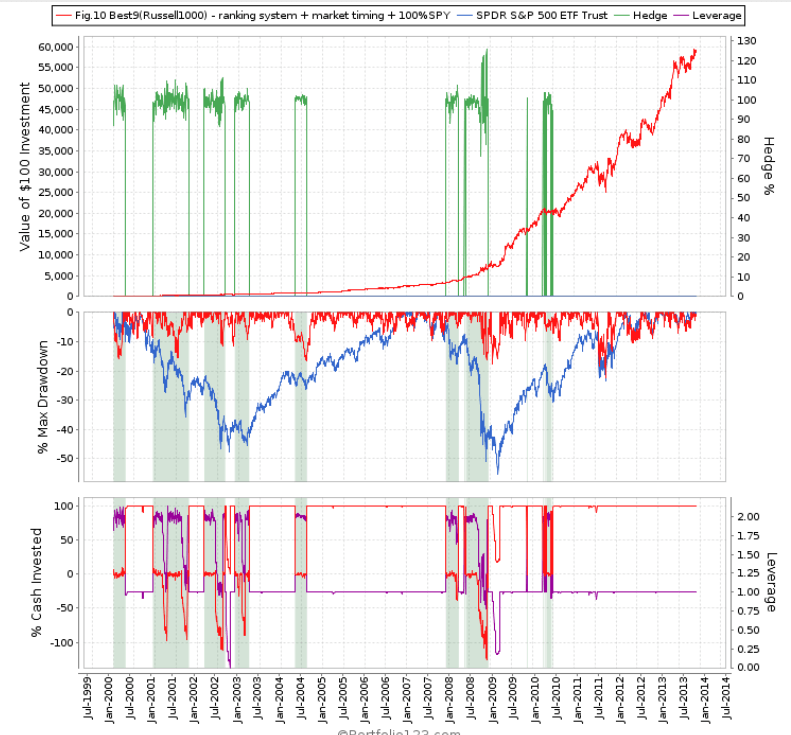
(An alternative to reducing the size of the stock holdings and buying SH is to sell short SPY. This would have produced an average annual return of about 58% as shown in Figures 9 & 10 in Appendix D.)
Ranking System and Trading Rules
Ranking System and Trading Rules are described in this article. Additionally liquidity has been assured by stipulating that for a stock to be bought its average daily $-volume over the last 50 trading days must have been greater than $7-million. The only sell rule is rank less than 97.
Figures 6 to 8 in Appendix C show comparison of performance when the following govern:
- only the ranking system,
- the ranking system and market timing in the buy-rules,
- the ranking system, market timing, and when the model reduces the size of the stock holdings by 50% to buy SH, which occurred 8 times from 2000-2013. (Note: The inception date of SH was June 19, 2006. Prior to this date values are “synthetic”, derived from the S&P 500.)
The model assumes stocks to be bought and sold at the next day’s opening price after weekly weekend rebalancing generates the signals for Monday. Variable slippage accounting for brokerage fees and transaction slippage was taken into account. Taxes were not considered.
The model was backtested from Jan-2-2000 onwards, as this was the first full year when the algorithm had access to all the required indicators.
Performance
The trading performance of the system is shown in Figure 1 further down. The annualized return from January 2000 to end of November 2013 was a high 53%; $100 grew to about $37,000 over this period. The maximum drawdown of 22% occurred early in October 2011.
Annualized returns for periods of 1 to 13 years were all higher than 32%, with the average being 52%; they are listed in Table 2 in Appendix A.
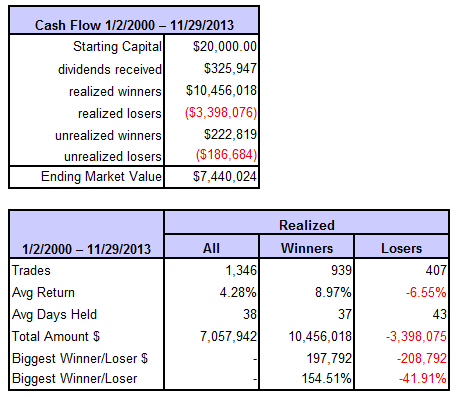
The model assumes an initial investment of $20,000 on Jan-2,2000. It normally holds no more than 9 stocks. To November 29, 2013 there were 1346 trades completed, 939 of these were winners and 407 losers as summarized in the tables below. The amounts shown include transaction fees of $457,425 arising from slippage and brokerage commission.
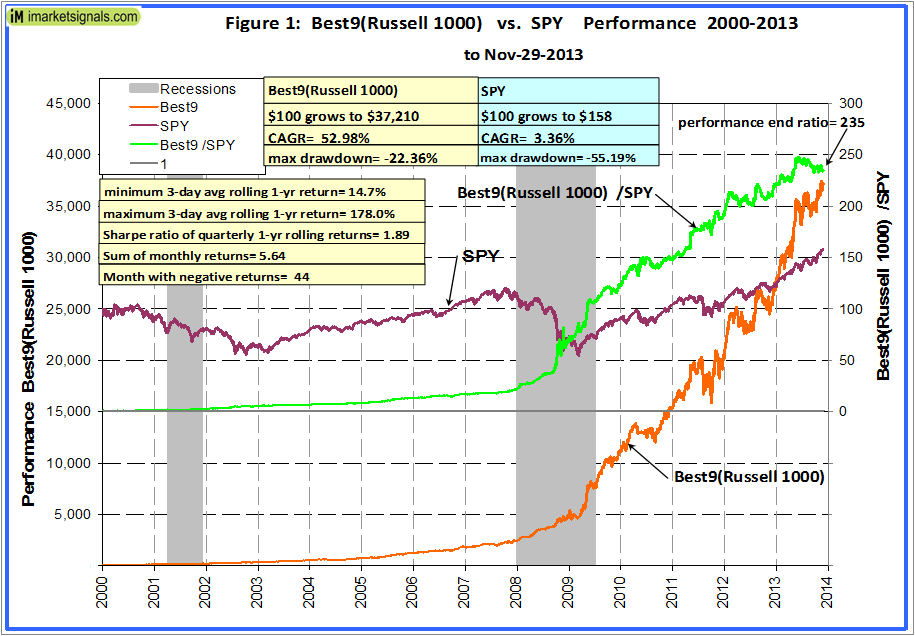
In above graph, the green line is the ratio of the Best9 to SPY, the general rising trend of that graph indicating that the Best9 continuously outperformed SPY over longer periods; to end of Nov-2013 it produced 235 times the value which one would have had from a Jan-2000 buy and hold investment in the SPY. Note, that over shorter periods the model had sometimes underperformed relative to SPY, which is indicated by the segments of the green graph with negative slopes.
Annual Returns
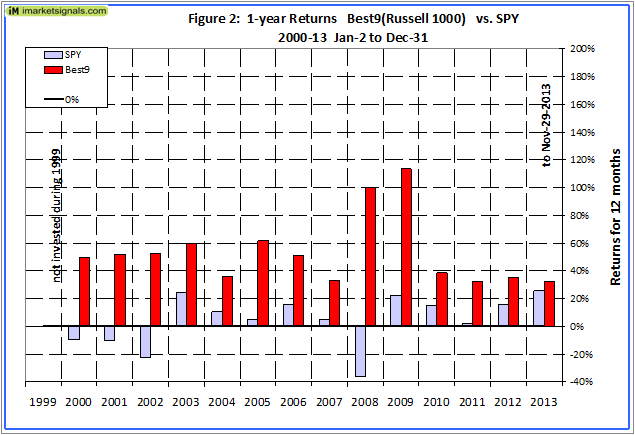
Annual performance from January to December ranged from a maximum of 114% for 2009 to a minimum of 33% for 2011, as can be seen in Figure 2.
Rolling Annual Returns
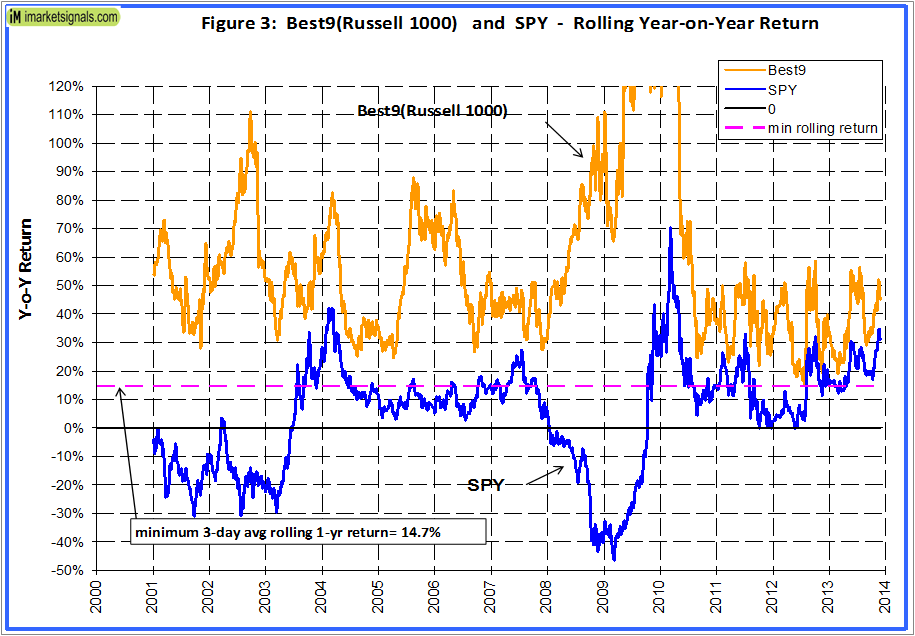
Figure 3 shows the 3-day average rolling 1-year returns starting each day from 2000 to 2012. There was never a loss over any 1-year period. The minimum return over 1 year was 14.7% and the maximum was 178%. One can see that Best9 always outperformed SPY over a 12 months period, which is indicated by the golden graph never being below the blue graph at any time. For rolling 1-year returns starting every 3 months the Sharpe ratio was a reasonably high 1.9, indicating that the returns were of similar magnitude.
2-year Returns
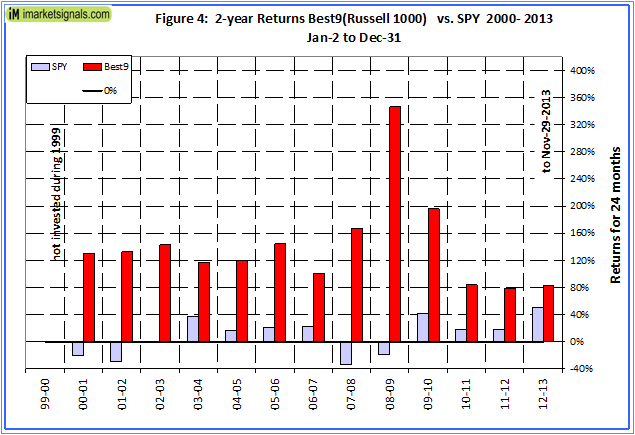
Performance over 2 years from January to December ranged from a maximum of 346% from 2008-09 to a minimum of 79% from 2011-12, as can be seen in Figure 4.
Distribution of Monthly Returns
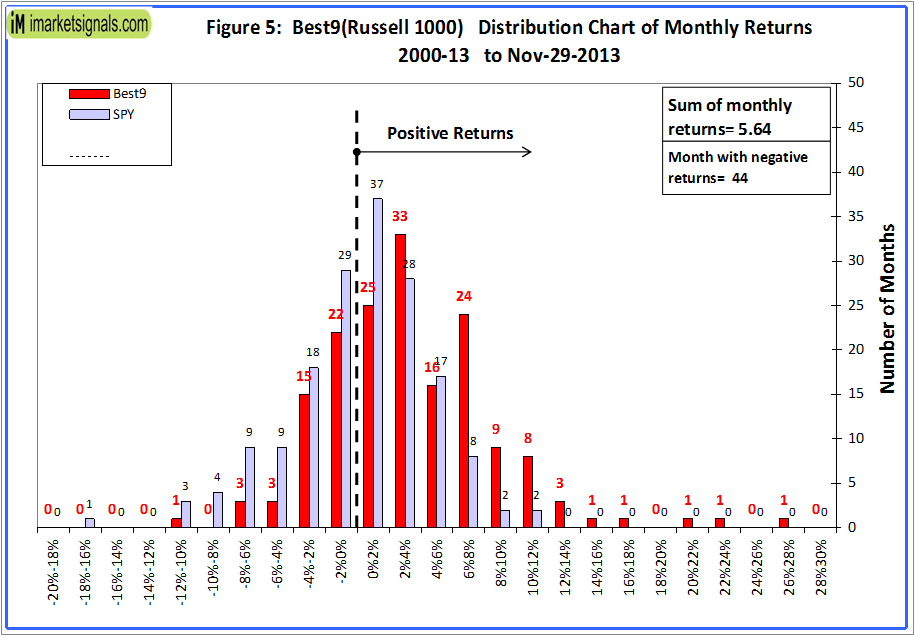
Figure 5 shows the distribution of monthly returns. There were a total of 167 months in the period under consideration. Best9 produced positive returns during 123 months and only 44 months of negative returns, as is evident from the chart above. SPY had 73 months of negative returns.
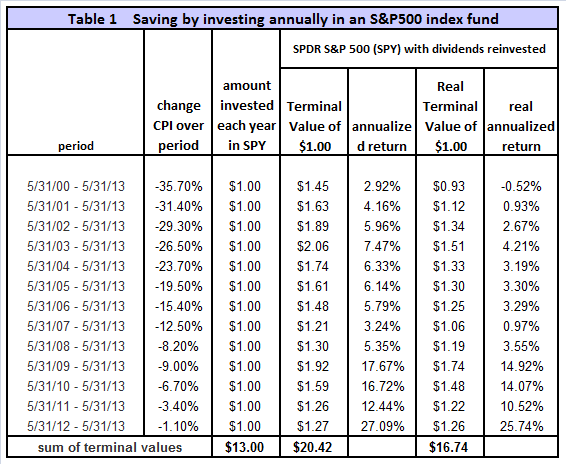
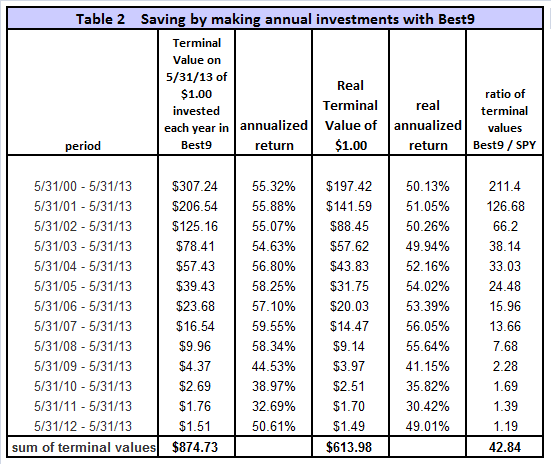
Terminal Values
To simulate savings over time, terminal values were calculated to the end of May 2013 for annual hypothetical investments of $1. Starting with a dollar during each of the 13 years from 2000 to 2012, one would have invested a total of $13 cumulatively by the end. Summing the 13 terminal values, this strategy would have netted this dollar-per-year investor $875 at the end of 13 years.
Following a buy-and-hold strategy in SPY, one would have only $20.42, about 2.3% of what Best9 would have provided. Furthermore, the lowest annualized return, for any of the 13 time periods would have been 33% and the average for all the periods would have been 52%. This is shown in Table 1 and 2 in the Appendix A.
Correlation with other “Best” models
The correlation between Best9 with Best10 and Best8+ is a high 0.76 and 0.75, respectively, with 1.0 signifying 100% correlation. Therefore the signals from Best9 would produce many stock duplications of the stocks selected by the other two models.
However, the correlation with Best(SPY-SH) is only 0.35. Thus a combination of Best9 and Best(SPY-SH) should be advantageous. This was tested with a combo of 70%Best9 and 30%Best(SPY-SH). The combo showed an average annual returns of about 46% from Jan-2000 to end of Nov-2013 with a maximum draw-down of only -17%. Also, over any 1-year period, starting at any day from Jan-2000 to Nov-2012, the return from the combo would never have been less than 20.5%.
Conclusion
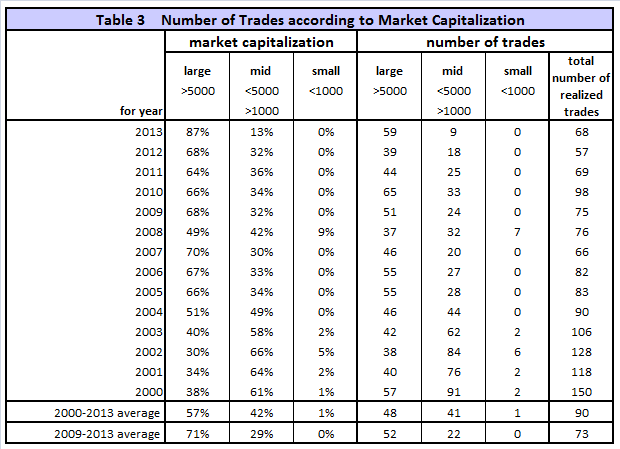
As shown in Table 3 this portfolio management system made on average about 90 completed trades per year, resulting in an moderate average annual portfolio turnover of 825%. This is equivalent to making 3 to 4 trades each week, not an unreasonable effort considering the good returns.
A simple ranking system with only 8 variables (which a sensitivity study showed to be very robust) is applied to the stock selection process. This is this not a complex, high risk system with many parameters which could easily break down. Robustness is a function of the number of parameters in a model. It is well known that increasing the number of parameters in a model improves the goodness of the fit, but also makes the model less robust. Simply put, the more rules a model has the more likely it is being curve fitted. For example, the Akaike information criterion not only rewards goodness of fit (which would be maximum return in our case), but also includes a penalty that is an increasing function of the number of estimated parameters in a model.
The backtesting returns are not distorted by survivorship bias because the model uses a point-in-time database. Based on the past performance one could expect this model to continue to outperform in the future as well. However, please be aware that all performance results are hypothetical and the result of backtesting only. Out-of-sample performance may be much different. We can make no claims about future performance of this signal, which may include significant potential for losses.
Appendix A
Appendix B
Risk Analysis
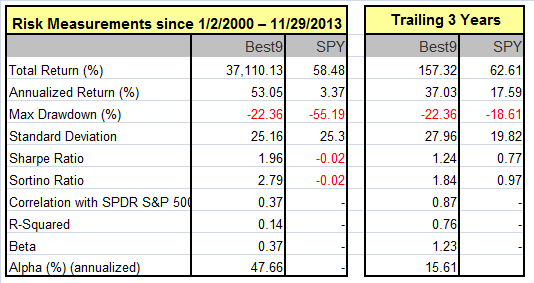
Note the risk measurements, particularly the reasonably low drawdown and high Sharpe- and Sortino Ratios.
Liquidity
Table 3 in Appendix A shows the number of realized trades according to market capitalization. One can see that over the last 5 years the model only bought stocks from large- and mid-cap companies. The maximum portfolio size is dependent on the liquidity of the stocks in the model. To calculate the maximum dollar-value of a portfolio without incurring too much slippage the following formula was recommended by P123:
($LiquidityBottom20Pct * #Position * 5%) / WeeklyTurnover%
where 5% is the maximum amount traded without affecting the stock price.
$LiquidityBottom20Pct = $ 12.8MM
#Positions = 9
Annual Turnover% = 825%
WeeklyTurnover% = 15.9%
Maximum Portfolio Size = ($12.8MM * 9 * 5%) / 15.9% = $36MM
Thus, this model could accommodate a good number of individual investors and also professional fund managers.
Appendix C
Note: All performance values are for an initial investment of $100,000 made on Jan-2-2000.
Fig. 6 – Performance with only the Ranking System governing
(CAGR= 39.0% max DD= -60.0%)
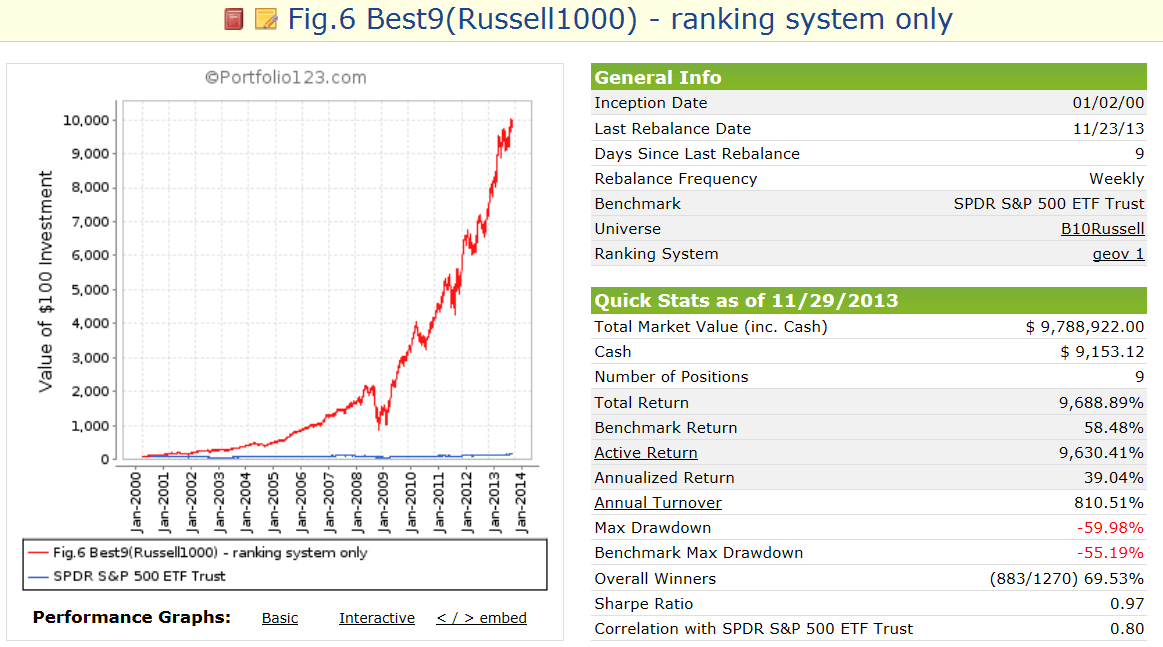
Fig. 7 – Performance with Ranking System + Market Timing Rules governing
(CAGR= 45.5% max DD= -22.4%)
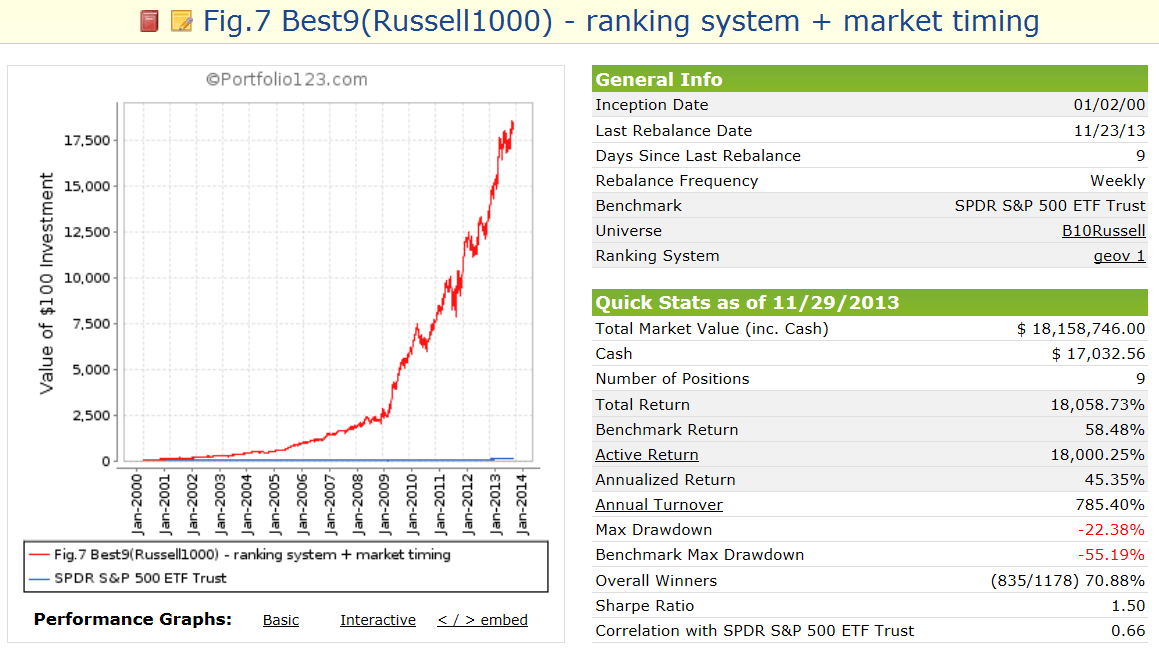
Fig. 8 – Performance with Ranking System + Market Timing Rules + 50% SH governing
(CAGR=53.1% max DD= -22.4%)
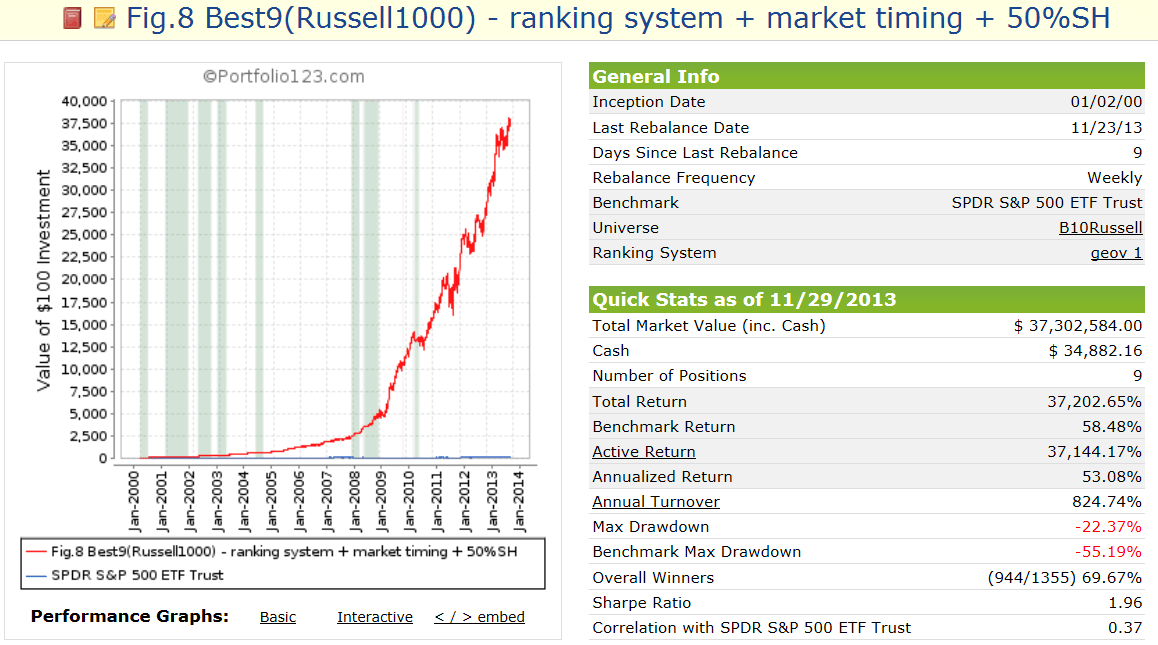
The vertical shaded stripes indicate when the model reduced the size of the stock holdings by 50% to buy SH, which occurred 8 times from 2000-2013.
Appendix D
Note: All performance values are for an initial investment of $100,000 made on Jan-2-2000.
Performance with Ranking System + Market Timing Rules + 100% short SPY
(CAGR=58.1% max DD= -22.4%)
iM-Best Systems
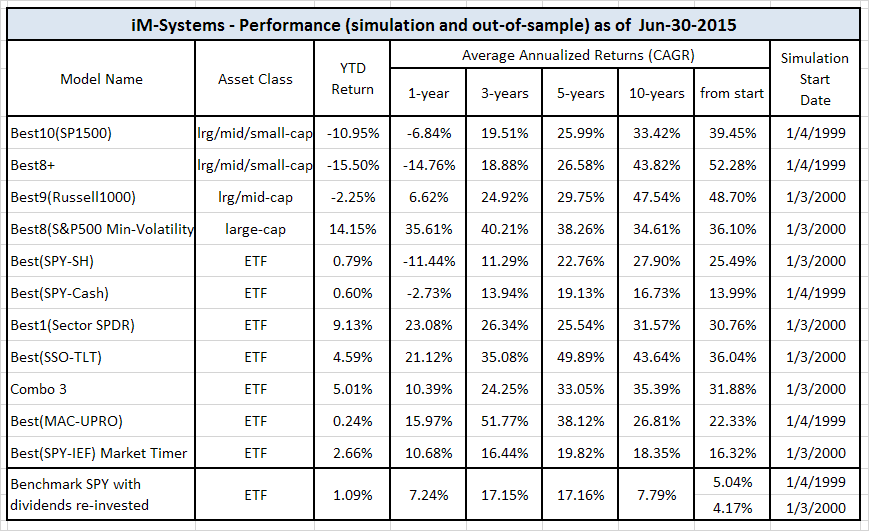
Quick Comparison
Quick Links to Model Descriptions
R2G & iM(Silver) iM-Best10(S&P 1500): A Portfolio Management System for High Returns from the S&P 1500
R2G iM-Best9(Russell 1000) – Large-Cap Portfolio Management System
R2G iM-Best8+ Portfolio Management System
iM(Gold) iM’s Best12(USMV)-Trader Minimum Volatility Stocks
iM(Gold) iM’s Best12(USMV)Q1..4-Investor Minimum Volatility Stocks (The Q3 model available to Silver)
iM(Silver) iM-Best10(VDIGX) Trading the Dividend Growth Stocks VDIGX
R2G & iM(Silver) iM-Best(SPY-SH) Market Timing System: Gains for Up and Down Markets
R2G & iM(Gold) iM-Best1(Sector SPDR) Rotation System
R2G & iM(Gold) iM-Best(SSO-TLT) Switching System
iM(Gold) iM-Best Combo3: Best(SPY-SH) + Best1(Sector SPDR) + Best(SSO-TLT)
iM-Best(SPY-Cash) Market Timing System
iM-Best(SSO-SDS): Beating the Market with Leveraged ETFs
Survivorship Bias: neither Myth nor Fact
Quick Links to Ready-2-Go Models
Best(SPY-SH) Gains for Up & Down Markets
When subscribing to P123 please use this link or enter token IMARKETSIGNALS when registering to obtain 30 days free membership.
Disclaimer: The opinions in this document are for informational and educational purposes only and are obtained from a mathematical algorithm and should not be construed as a recommendation to buy or sell the stocks mentioned. Past performance of the companies may not continue and the companies’ stock values may decline. The information in this document is believed to be accurate and represents the output of a mathematical algorithm, and under no circumstances should a person act upon the information contained within. We do not recommend that anyone act upon any investment information without first consulting an investment advisor as to the suitability of such investments for his specific situation. Also see our Terms of Use/Disclaimer.
When does Best9 start in Portfolio123 ?
Barring any unforeseen circumstances Best9 will be open for subscription on December 18, at 9 a.m. EST.
How many subscriptions will be allowed
This model has huge liquidity and should be able to support a total portfolio value of about $36-million. Initially we will have 35 available subscriptions.
Is it possible to subscribe through this website? I know you offer through another website but I’ve registered here to be a member a couple of times (or so I believed) but have never heard anything back.
Thank you,
Doug
Hoenix, AZ
Doug,
We don’t offer the trading signals here at iM. You have to be a member of P123 to subscribe to the Best9. It should not be difficult to become a member there, lowest priced member tier at P123 is “Investor”.
Hi, please could you provide some detail about the SPY short? Eg. are strike price, expiration and option premium assumptions determined by the model? Is the option premium included in the CAGR? thanks, looks like another great (perhaps greater) model!
You are referring to Best9(Russell1000)+shortSPY(100%). The price for SPY and all costs associated with short selling is fully accounted for by the P123 algorithm and database, including the cost of maintaining the margin account. Options are not used.
Which analytical system are you using that only invested in SH eight times between 2000 and today and is there a way for me to see when those investments were made and then removed?
SH entry uses change of Earnings Per Share Estimate of the S&P500 or when the market is looking overbought determined from moving average crossovers of benchmark SPY.
SH exit uses moving average crossovers of benchmark SPY, volatility VIX, Risk Premium and moving average crossovers of Earnings Per Share Estimate of the S&P500.
You can see the periods when the hedge was in place by downloading the performance spreadsheet of Best9 from the R2G model. The download button is located in the middle under the chart.
I was wondering if you might compare the Best9 system to the Best8+ system. I realize the universe of stocks that the two systems use are different, but I was excited to see the large cap system performs quite favorably.
I take this to mean your ranking system, buy/sell rules and the SH timing are perhaps more important to your results than the universe of stocks that are used… but I’d appreciate your thoughts. Thank you.
Russ,
As stated in the model description, the correlation between Best9 with Best10 and Best8+ is 0.76 and 0.75, respectively. This would cause many of the signals for the large/med-cap stocks from Best9 to be also produced by the other two models.
The main driver of this model is the ranking system which, as shown in Figure 6, produces a high AR of about 39% for the simulation. Drawdown-protection rules and “hedging” provide additional performance.
Sorry, my question was vague. What I meant to ask is, is the only difference between Best8+ and Best9 the universe of stocks that are used? thank you.
There are other differences as well apart from the universe from which stocks are selected. Best8+ avoids very large companies. Also the ranking system and buy rules have some differences. Additionally the determination when Best9 buys SH is unique to this model.
Congratulations on the popularity of this one!
Hi Georg,
Will I be able to subscribe to the Best9 Russell system tomorrow morning after I open an account at Portfolio 123?
Regards.
You need to be a paid up member at P123 before you can subscribe to any R2G models. The $29 Investor category at P123 will do. Please use the invitation code IMARKETSIGNALS when registering/subscribing to P123
Geov, I’m looking to subscribe to this model given you have an open slot. I really like how there are only a few factors used. But I noticed that with just the ranking system the max drawdown is 60%, but just by adding the market timing rules, it falls to 22%.
That’s a huge difference due to the market timing rules. I was wondering if you can elaborate a little more on the nature of this market timing rule, as you haven’t provided any details on it, and it would make me more comfortable as a subscriber to know what I’m relying on so much to reduce the drawdown. Thanks!
The market timing rules are in the buy rules and use a short period moving average crossover system or a long period moving average crossover system of benchmark SPY. See Figure-7 of the model description. There is nothing fancy in those rules but it reduces drawdown considerably.
The hedging rules do not reduce drawdown, but increase return only, as shown in Figure-8.
Thanks for sharing all the hard work. I’m a bit confused (which is not that tough to do). What do I need to subscribe to to get real time trading signals for this model–IS or P123? Does the gold membership in IS just give Friday updates of the picks the signal made the prior Monday, or does it give you the current picks from that Friday? Can you please let me know what comes with the IS gold subscription compared to P123. Many thanks!
Trading signals for the Best9 are only available to subscribers to the model at P123. P123 sends out emails early Monday mornings with the trade signals. At iM we do not provide this information. Please see the table on our home page on what is a available to various membership tiers.
Currently we provide delayed trading signals for the Best10. Monday signals are published on the following Friday.
https://imarketsignals.com/systems/imbestx-systems/#best10-update
It would appear that following the delayed signals of Best10 was quite profitable as per this communication from one of our members:
“My paper tracking of the delayed signal with a $20,000 initial investment ($2,000/stock) resulted in a 22% return vs a 15% return for the S&P500 over the same period. $7.50 commission on the Buy and $7.50 on the Sell. Beating the S&P by 50% was good enough to convince me. June 2013 through March 2014.”
Georg,
In general, how does the timing of the SH hedge that is invoked in Best9(Russell) differ from that which is involved in your SPY-SH timing model?
Thanks.
–Tom C
Tom,
Best9 uses SH as a hedge, whereas Best(SPY-SH) switches between the two ETFs. There has to be a sell signal for SPY first before the switch to SH can occur. Before the model switches to SPY again there has to be a sell signal for SH and it’s rank must be lower than that of SPY at the same time.
Sell rules for SPY are long or short moving average crossover systems of benchmark. Sell rules for SH considers VIX, moving average crossover systems of benchmark, risk premium and SP500 EPS Current Year.
For Best9 the hedge entry and exit rules rules are different than those for (SPY-SH). Basically the frequency of the signals is less than those for (SPY-SH), although similar parameters are used.