
Minimum volatility ETFs should provide exposure to stocks with potentially less risk. They track indexes that try to capture the broad equity market with a reduced amount of volatility, seeking to benefit from what is known as low-volatility anomaly. Consequently they should show reduced losses during declining markets, but also reduced gains during rising markets. However, better returns with simultaneous tax efficiency can be obtained also during rising markets by selecting a number of the highest ranked stocks of a minimum volatility ETF and holding those positions for at least one year before new trades are initiated.
One of the largest minimum volatility funds is the iShares MSCI USA Minimum Volatility ETF USMV which provided an annualized return of 17.75% from inception Oct-20-2011 to Jun-18-2014, whereas SPY, the ETF tracking the S&P500, had a higher return of 22.06% over the same period. USMV’s lower performance did not deterred its growth, as evidenced by the fund’s current net assets of about $2.7-billion. Investors seem to assume that they are incurring less risk by investing in this fund and that any potential downside will also be lower relative to the broader equity market, just as the upside has been so far.
USMV tracks the hypothetical investment results of the MSCI USA Minimum Volatility (USD) Index. The parameters for this index are not publicly available, making it impossible to reconstruct a similar index to verify historic performance. The best one can do is to use the current holdings of USMV for backtesting. The backtest results should not be significantly affected by survivorship bias, because the fund’s annual portfolio turnover rate is low and the backtest period is relatively short.
Backtesting Performance
USMV currently holds 150 large-cap stocks (market cap ranging from $4- to $445-billion) of which 148 were listed at the inception of the fund on Oct-20-2011. Using these stocks as the universe, backtests were performed on an online portfolio simulation platform assuming an initial investment of $100,000:
Backtest period Oct-20-2011 to March-31-2014.
- (A) All stocks held continuously over period, no buy/sell rules applied.
- (B) 12 stocks selected by a ranking system, with buy/sell rules.
Ranking System:
- As for the Best10(S&P1500) portfolio management system described here.
Buy Rules:
- Sector Weight < 30%,
- and Industry Weight <20%,
- and exclude some of the largest market cap stocks from being selected.
Sell Rules:
- Hold position at least 1-year,
- or sell when price declines more than 15% from the most recent high since the position was opened.
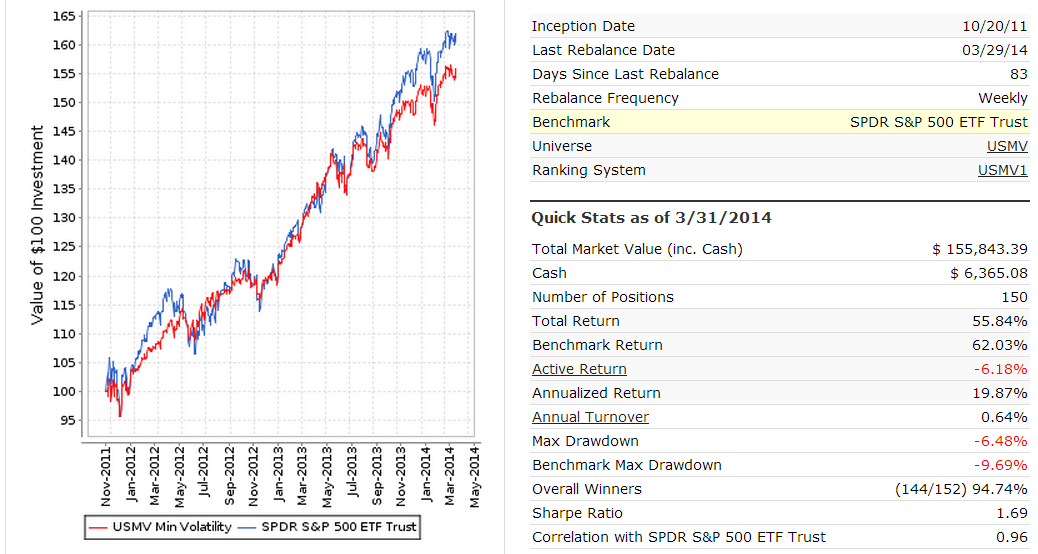
Results of backtest A with all the stocks of USMV holdings:
Had one at inception invested equal weight in all the stocks and applied the same expense ratio as for USVM, then to Mar-31-2014 the annualized return would have been 19.9%. Over the same period USMV produced 17.9% according to the fund’s fact sheet. The 2% higher annualized return of the simulation can be attributed to backtesting with an equal weighted universe, whereas the fund has weighted holdings. (Similarly, annualized return from equal weight ETF RSP for this period was 23.08% versus 21.03% for SPY.) The results confirm that using the current holdings for the entire backtest period is a legitimate technique when backtesting over shorter periods.
In the figures below the red graph represents the model and the blue graph shows the performance of benchmark SPY, the ETF tracking the S&P500.
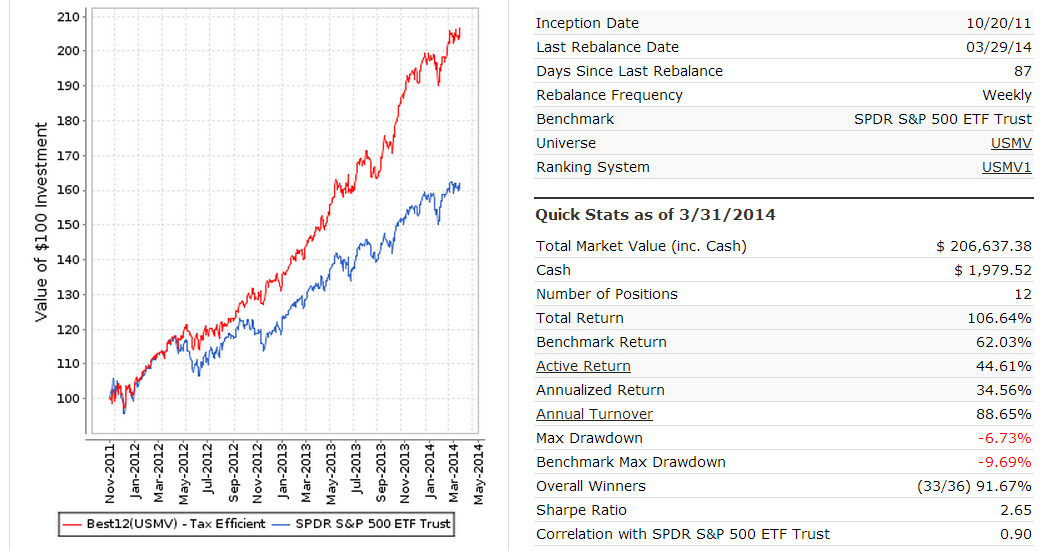
Results for backtest B with selected stocks from USMV holdings:
Had one at inception invested equal weight in the 12 highest ranked stocks and applied the buy/sell rules, then to March 31, 2014 the annualized return would have been 34.6 %. Allowance was made for an expense ratio of 0.15% as applied by the fund and slippage of 0.1% of the transaction price when stocks were bought and sold.
This strategy would have provided much higher returns than SPY and USMV, and shows that minimum volatility stocks can outperform the broader market also during up-market periods.
Conclusion
Using a ranking system to rank the stock holdings of USMV and only investing periodically in the 12 highest ranked stocks according to the buy/sell rules would have produced the best returns, as demonstrated by the results for backtests B. The performance from 2011 to 2014 is shown in Figure-1 together with the sector allocation of current holdings. One can see that the model’s holdings are well diversified.
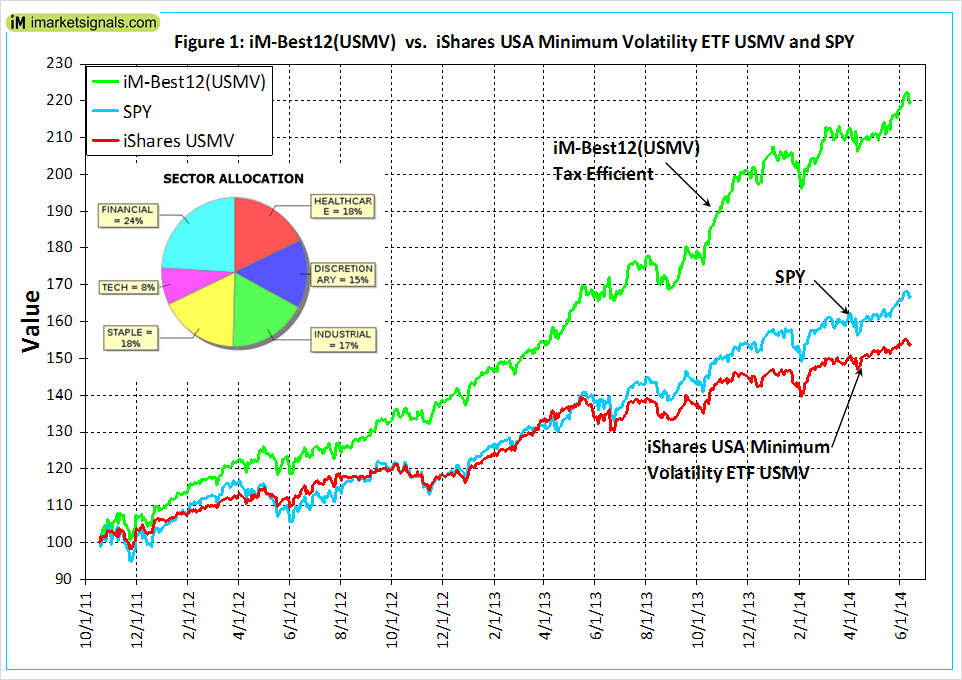
Also the model’s annual portfolio turnover rate is only 82% because of the specified minimum one year holding period, making most of the returns subject to long-term capital gains tax only.
Performance of four displaced models
A simulation of performance for four models, displaced by 3 months from each other (starting dates Oct-20-11, Jan-20-12, Apr-20-12 and Jul-20-12), provided an internal rate of return of 31.6% to Jun-18-14, with most of the returns classified as long-term capital gains
The combined holdings at the end consisted of 48 positions of which 23 stocks were represented once, 2 were represented twice, and 7 were represented 3 times. Thus there were 32 different stocks in the holdings with only a 28% overlap between the four models. Using four displaced models provides the ability to stage one’s investments over a year with trades occurring approximately ever 3 months thereafter.
Although more than 20% of USMV’s 150 holdings are held by the four models, the combination still showed a 31.6% annualized return, almost twice the 17.8% return of the ETF. A shadow ETF consisting of four displaced models could accommodate about 20% of USMV’s assets, and should at the same time produce significantly higher returns than USMV.
Following the 12-position model
As demonstrated, a 12-stock model should significantly outperform USMV and SPY. At our website one can follow the performance of this model from July onward. We aim to update the model weekly and every three months renew the stock universe corresponding to the then current holdings of USMV. Additionally, we are planning to add another three similar models, quarterly displaced, to provide the ability to track the performance of staged investments over an extended period.
Disclaimer
One should be aware that all results shown are from a simulation and not from actual trading. They are presented for informational and educational purposes only and shall not be construed as advice to invest in any assets. Out-of-sample performance may be much different. Backtesting results should be interpreted in light of differences between simulated performance and actual trading, and an understanding that past performance is no guarantee of future results. All investors should make investment choices based upon their own analysis of the asset, its expected returns and risks, or consult a financial adviser. The designer of this model is not a registered investment adviser.
Are you still using Portfolio123? I would be interested in this new portfolio [Best12] also but I do not know the cost or how to reserve a subscription. Thanks.
The simulation was done with P123 but it will not be available as a R2G model there. We will update this here weekly. Since stocks are held for at least one year, there will not be much change in the holdings. Dividends received will be converted into stocks. So number of stocks will grow over time.
Beginning October-2014 we will start another model, and 3 and 6 months thereafter another one. So one will eventually have to trade every 3 months, but most of these trades will only attract long-term capital gains tax because position will be held at least one year unless the the stop-loss sell rule kicks in. But then that position will usually show a loss anyway.
Periodically we will compare performance of this model with the ETF USMV to see whether it performs better than the ETF.
This model will be initially free so one can see the activity, if any. Later we will move it into the “Silver” section so Silver and Gold members will be able to see it. So there is no need to reserve a subscription.
Georg,
What’s the result from 10/20/11 of Top 12 without the 1 year sell rule? With and without the 15% trailing stop?
Thanks.
–Tom C
Return does not become better by frequent trading because all stocks in the universe have similar characteristics, for which they were selected by the fund manager. For example, specifying a minimum holding period of 3 months produces an annualized return of 34.7% to end of March 2014 with a min dd= -6.7% and no stop loss provision, and annual turnover is 370%. With stop loss the return is about the same.
Also, Georg, have you ever tried your own minimum volatility criteria to use as a screen as opposed to USMV? If so, what were your results?
–Tom C
Tom, we are working on a minimum volatility model. To set up one’s own criteria for this is not easy. Other designers at P123 are working on this as well. I don’t think that with the tools available at P123 we will be able to produce anything that comes near the MSCI USA Minimum Volatility (USD)Index.
yes, Georg, I totally get that. Thanks….
Congratulations on another interesting approach. Getting good returns with reduced draw downs is highly desirable to me. (I suspect it would not sell well on P123 where huge CAGRs seem to rule the R2G model sales).
1) I would love to see how this back tests in the 2007-9 years, even though the survivorship issue might skew the results a bit.
2) Out of curiosity, did you try substituting USMV for SPY in your SPY-SH model? If so, how did that do?
3) I gather that these trading models do not attempt to adjust for paying taxes when comparing its results to a buy and hold benchmark. I would guess a rough approximation would be to adjust the BeforeTaxCAGR by something like BeforeTaxCAGR * TurnOverRate * Taxrate
(The TurnOverRate would need to be capped at 100% for this calculation).
For this model: BeforeTaxCAGR of 32.7% * 82.49% TurnOverRate * 15% TaxRate = 4.05%, so 32.7%-4.05% = 28.7% ApproxAfterTaxCAGR.
Of course, some people have different Capital Gains tax rates including zero in an IRA, but for taxable accounts, seems like this would be ball park. I would greatly appreciate if an accountant might comment, as I am not one, and am only guessing here!
1. I think survivorship bias will distort results for backtesting longer than 5 years. So for what it is worth: returns from Jan-2000 to Mar-2014:(CAGR%, DD%, Winners%, Turnover%)
1-yr holding period: 23.0%, -37.8%, 59.8%, 128%
3-mo holding period: 24.7%, -34.2%, 64.8%, 380%
These returns are a lot better than for buy-and-hold SPY which produced only 3.6% over this period with a max DD= – 55.2%. So the additional 20% return from the model can’t be entirely due to survivorship basis. Low volatility stocks will perform better over longer periods.
2. One can’t substitute USMV for SPY in the Best(SPY-SH) model because USMV has only been around since Oct-2011.
3. I agree with your calculation for ApproxAfterTaxCAGR.
Did your test from Jan-2000 to Mar-2014 showing the 37.8% DD use a 15% stop from highest price?
Yes, this is with 15% stop-loss, all as per model description.
Is the 15% stop loss a trailing stop, or hard stop below buy price only?
Stop is based on negative percentage change from highest close since position started.
Again, your work is always impressive. A few questions..
Since the model is investing every 3 months I’m assuming it is allocating 25% of a portfolio to the 12 stocks each time. So at the end of the year the model would be holding approximately 12 stocks x 4 investment periods per yr = 48 positions with the exception of when tickers are “represented” more than once or they hit a 15% stop. Is this correct?
Assuming a $100K starting portfolio, if every 3 mos it is investing 25% of the portfolio in 12 stocks this would equate to 8.3% of the quarterly funds to allocate per ticker or about 2% of the $100K per ticker. If a ticker is “represented” more than once I take that to mean it also hits the trigger to invest in it an additional quarter within the same year hence the allocation to that ticker will be double or sometimes 3 x’s that of others. Is this correct?
I see the analysis says “weekly rebalance” On this low tax model, how does it re-balance weekly?
You are correct in your interpretation.
Weekly rebalancing will only affect additional stock purchases due to dividends, or stock sales due to stop-loss provisions.
If one wishes to hold fewer stocks, can one allocate 100% to the 12 stocks each quarter and rebalance quarterly. In Canada this would not affect taxation because there is no differentiation between long and short term cap gains
The USMV-Investor quarterly displaced models hold stocks for a minimum period of 1-year unless a stock shows a loss of more than 15%. We do not rebalance them every 3 months.
One can follow the USMV-Trader model if one wanted to trade more frequently. The Trader gets rebalanced every 2 weeks and only holds 12 stocks.
Georg, can you tell me the 4 year return to date of the USMV-Trader vs. the USMV-Investor? Am I correct that the USMV-Investor is rebalanced annually?
Georg and Anton,
Great strategy that should be very helpful especially to a taxable account. Have you considered applying this approach to a high-beta universe using SPHB or a similar ETF as the benchmark? I don’t know if the one year holding rule would work well in a high vol\beta universe but it may be worth trying. Then an investor would have an ability to invest in both a min vol and high vol strategy with tax efficiency. I think the low volatility anomaly is real but for diversification purposes etc it may be useful to have a high vol strategy to complement the low vol strategy.
Great work!
Using the high beta stocks of SPHB will do well during upmarket periods, but during down-market periods high beta stocks will underperform the broader market. During 2008 the max DD would have -75% for this portfolio. Also holding them for one year is not a good strategy. There are better strategies to use high performance models with low risk portfolio.
I have wondered whether there were any potential benefits to using a subset of SPHB stocks in a short portfolio at those times your SPY-SH model indicated being short.
–Tom C
Just my 2 cents worth. An ideal system (for me) would be one that holds about 12 stocks per year, instead of 48. During the holding period, if a stock – or stocks – drop out due to the !5% stop-loss rule, replacements could be chosen (randomly?) from the next quarter’s new list.
All the stocks have similar properties (low volatility etc) so I would think 12 (or 20 or 24) would provide sufficient diversification. I would prefer fewer holdings – even if it meant slightly reduced returns. (Obviously, greatly reduced returns would be a different story).
I have to admit I don’t like making that many purchases (48) every year. Simplification is important to me. Thoughts?
There is no need to follow all 4 models. One can just follow the July model. Reason why we will have 4 models is to make it possible to enter the market over 9 months, which would be prudent in case there is a sudden market downturn, and also there may be people who want to trade more often than once per year.
Also if people want to invest a lot of money it is probably safer to spread it over more positions. The model is updated every week in order to re-invest dividends, or to exit a position if it loses more than 15% from recent high. If a stock is sold due to 15% stop-loss provision it is immediately replaced with the highest ranked stock in the USMV universe, so there would be always 12 positions.
Georg, do you plan on showing the top 12 stocks in the model each week also?
No, we will only show current holdings which are not expected to change for a while. The first time one will see the new highest ranked stocks is at the beginning of October, when we start the October model.
Here’s a thought: what would the results look like if you used the SPY-SH model, except instead of SPY you purchased instead the Top 12 minimum volatility stocks at equal weights according to your ranking each time you had to re-enter after going short?
–Tom C
We can’t do this because we don’t have a point in time historic universe for USMV.
Yes, I just meant using the inception date of 10/20/2011 you were using above.
I guess another way of saying it would be that in your USMV simulation from 10/20/11, what if you bought SH during the periods your SPY-SH model would have dictated. I’m guessing it would have added a kicker to the already good returns you have shown, yes?
Interesting discussion on this one. Another idea. Let’s say I decide to buy fewer stocks (12 instead of 48 annually) but still want to “feather in” by buying 4 each quarter until I get to 12 (and likewise selling the 4 stocks when their quarter comes up a year later – if they’re no longer on the list – and buying new ones etc).
Bottom line – would it be possible for you to list the stocks by ranking – instead of alphabetically – so I could possibly buy the top 4 or 5 stocks by rank? Or does it really matter that much?
I realize I wouldn’t have definitive back-testing on my side but I think the results would be close enough, and the tax efficiency would be the same.
The way I understand it is… you’re presenting an idea that offers the most growth possible – within the frame-work of holding for a year to avoid taxes… which is a brilliant idea, in my opinion. My only modification would be to hold fewer stocks.
Return diminishes when holding fewer positions.
Here are returns over last 5 years to 7/7/2014. All are better than SPY’s CAGR of 19.8%.
4 positions 23.1%
6 positions 25.7%
8 positions 29.7%
10 positions 28.9%
12 positions 30.3%
Hi Georg,
Would you consider using the sell signal from the MAC-US model and switch to a treasuries (e.g. TLT, SHY, …) until a buy signal is issued to reenter the combo-12? Would it better protect any gains, and offset the additional tax during during a downturn?
Greg
Greg,
One should consider the MAC signals as well. One could set up a model that invests a portion of the capital in bonds and Best12, similar to what was done with the Vanguard funds with dynamic asset allocation. The MAC signal do not occur very often, so such combo would be quite easy to trade.
Also when a recession signal is given by COMP or BCI stocks should be avoided.
Going back to my post re SPHB, will P123 allow you to backtest a strategy that shorts the lowest (worst) ranking 10-15 stocks in SPHB only when your SPY\SH model is signaling bearishnes (in SH mode. So basically a modification to your SPY\SH model so that instead of buying SH it shorts the 10-15 worst stocks from the SPHB universe. I think the decline in the worst SPHB stocks when the model is signalling to be short would be 2 to 3 times more return than just buying SH. Its a bet that high beta does the worst in times of market weakness (betting against beta) and that your ranking system adds value by selecting the worst of the high beta universe. Thoughts?
I agree that the worst stocks of of a SPHB universe will provide a much higher return when sold short than SH. I will try and run such a simulation in P123. Problem is that there is no point-in-time universe for SPHB.
What would happen to the returns if you applied the same 50% SH position that you do using Bestx9? Is that visable or even advisable in your opinion?
The objective of having the Best(USMV) models at iM is to see whether the results of the original in-sample backtest will be confirmed out-of-sample, namely that when selecting the 12 highest ranked stocks from the ETF’s holdings returns should be better than those of the underlying ETF.
To add market timing to this test would be wrong, because it would distort the results, and the test would be invalid.
• and exclude some of the largest market cap stocks from being selected.
Can you be a little more specific about this money management rule? I am following this 12 stock portfolio and its doing well from June 30 2014 to the present but why do you exclude some of the largest market cap stocks and what are the rules arount this?
Yes, from Monday Jun-30 to Friday Sep-12 Best12(USMV)-July is up 8.1% while the ETF USMV gained a mere 1.5% over the same period.
The largest cap stocks typically perform less well and there is a rule to exclude them, not a list of them. It is not my intention to be specific and publish the whole algorithm.
Our next USMV model will be launched on Oct-1 and signals will be communicated on Sunday Oct-5. It will be interesting to see how it performs relative to the ETF.
Quick question – now that you have new levels for Best12, will the July version be fully updated throughout the year? In other words, if a stock is dropped in the quarterly USMV rebalancing – or if one falls below the 15% stop etc – will that be reflected in the weekly update (and other stock chosen) in the “Silver” level?
Yes, the July model will be fully updated with all trades shown.
The universe from which stocks are selected will be updated every three months, with the universe corresponding to the then current holdings of USMV with the model’s then current holdings added to the universe. Adding the current holdings will ensure that stocks are not sold should they not be part of the future holdings of USMV, because the model should keep its holdings unchanged for at least one year. This should ensure that the model’s universe will not deviate too much from the holdings of USMV over time.
HI George,
Will you be publishing the January version today?
As previously announced, we will renew the universe to end of December holdings of the USMV ETF, and the new sister model will be published in the first week of January, 2015.
Can you clarify? I assume you HAVE launched a USMV at the end of 2014? Is it just not visible for members during the free trial?
Once I sign up for membership, all the holdings will be visible?
And you have a USMV with ETF (sectors?) only? I can’t find any version of that on the home page. Is that also invisible?
Jimmy, for trial members all site content is enabled. The Best12(USMV)Q1-Investor was launched on January 5, 2015, the holdings can be found on the logged-in homepage.
Once you sign up for membership, further email services will be enabled, there is no extra site content.
The Best8(S&P500 Min-Volatility) is a R2G model and selects stocks mainly from the Health Care, Consumer Staples and Utilities sectors
nmtdoc says:
Jan 29, 2015 at 7:17 pm (Edit)
Georg, can you tell me the 4 year return to date of the USMV-Trader vs. the USMV-Investor? Am I correct that the USMV-Investor is rebalanced annually?
These models have only used point-in-time universes from beginning of July 2015 onward. A long 4-year backtest with the current universe will have distorted performance results due to survivorship bias.
Invetor: rebalanced annually
Trader: rebalanced every 2 weeks
Investor: CAGR= 29.1%, max DD= -12.3%, Annual Turnover= 97%
Trader: CAGR= 28.6%, max DD= -16.8%, Annual Turnover= 448%
Sorry, stupid question. Forgot we can only go back to July 2014…….would it be correct to assume that performance would be enhanced by combining this with the MAC-US or IBH models exit and entry signals?
MAC-US has been backtested over 65 years and also shown to be very robust by a third party analysis.
Question re this week’s change. Hasn’t QCOM, the new buy to replace AXS in Best-12 3Q Investor, just violated the 15% from the recent high rule (depending on what recent means – but it’s more that 15% below the intra-day high of Jan 13)?
Or is that rule only violated if it drops more than 15% “after” buying it?
It is the percentage from highest close since position started.
How does the USMV Trader compare to the Best 8 Min Volatility regarding liquidity?
Thanks!
The Best8(S&P500 Min-Volatility) is a R2G model at P123. It only trades S&P500 stocks with huge liquidity. See end of model description for max portfolio size. https://www.portfolio123.com/app/r2g/summary/1276065
The Best12(USMV)-Trader selects stocks from iShares minimum volatility ETF USMV. It also only trades large caps which have no liquidity issues.
I am a newbie, so I apologize for this unsophisticated question. Why are there four models of IM-BEST12(USMV)Qx. Also why is on the the Q1 available to Silver level subscribers?
The BEST12(USMV)Qx models have identical trading rules but their inception dates are quarterly displaced. The idea is to have four overlapping tax efficient models (stock holding period longer than 1 year), each of which getting rebalanced only after one year.
Since they are displaced by 3 months one would have to do some trading every 3 months after the first model is 1 year old (which will be end of June 2015). This should ensure that periodically the lowest ranked stocks of each model are replaced by the higher ranked stocks from the USMV holdings.
The idea is to test whether tax efficient trading of the USMV highest ranked stocks can provide higher returns than the ETF USMV by itself. So far after one year the combined average return of the 4 models has been significantly higher than that of the ETF USMV.
Why should the initial model (Q3) not be available to Silver members. There may be some people who are not interested in the other models in the Gold section.