
Since end of June 2014 we provided updates of our Best12(USMV) at iM, a tax efficient model which holds positions normally for at least one year. Concurrently we were testing the Best12(USMV)-Trader model. The only difference between the two models is that the Trader is not restricted to hold stocks for a 1-year minimum period and has an additional sell rule based on rank. We backtested the Trader for various periods and found its returns to be to be marginally higher than that of the tax efficient Best12(USMV) model. However, returns were more consistent. A listing of returns, terminal values, and internal rate of returns is shown in the Appendix for both models.
The universe from which stocks are selected will be updated every three months for the Trader with the universe corresponding to the then current holdings of USMV. Additional sister models are not required, because stock holding periods are not restricted. The trader is rebalanced every 2 weeks and on average one can expect 2 buy- and 2 sell-trades every 2 weeks, resulting in an annual turnover of about 400%.
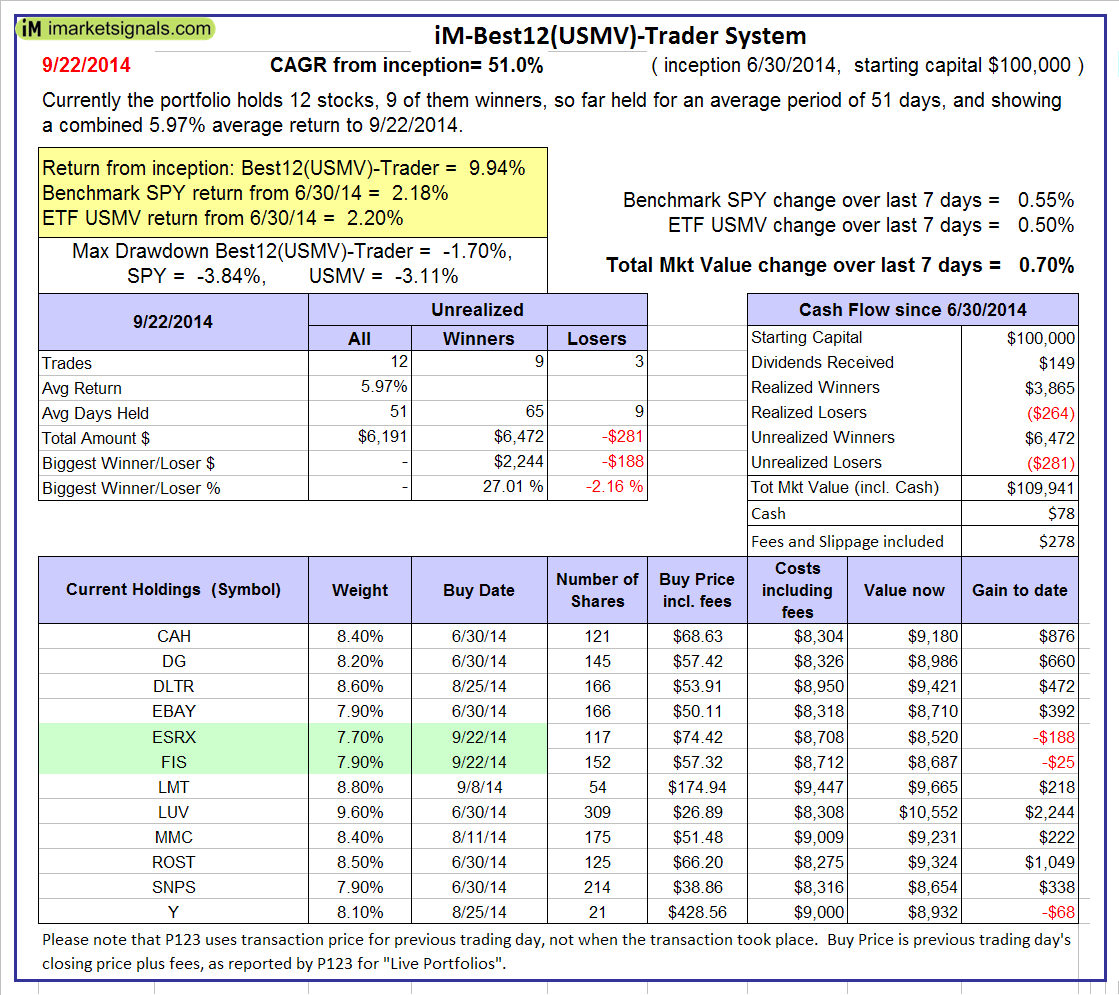
Current Holdings and Return to Sep-22-2014 for Best12(USMV)-July-2014
From Jun-30-2014 to Sep-22-2014 the Trader has gained 9.9%, while iShares’ USMV gained only 2.20% over the same period. A starting capital of $100,000 at inception grew to $109,914, with fees and slippage accounted for.
The table below shows the performance to Sep-22, and current holdings with gain/loss for each position. The high-lighted green positions are the most recent additions to the portfolio.
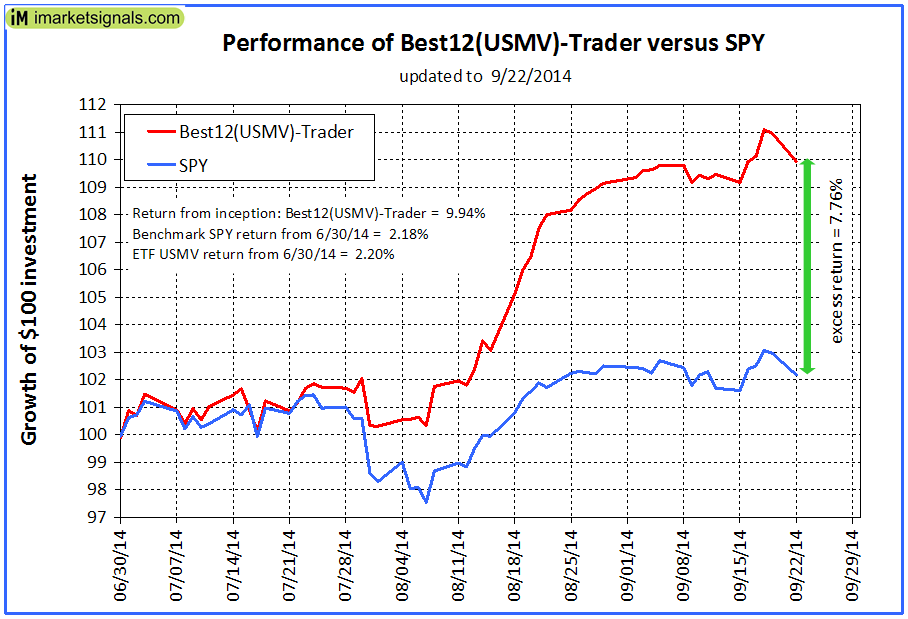
The performance graphs of $100 invested in the Best12(USMV)-Trader and SPY (the ETF tracking the S&P500), is shown below, with the red graph indicating the value of Best12(USMV) and the blue graph depicting the value of SPY.
Following the Models
The weekly performance update will be an additional feature accessible to Gold members only, however we reserve the right to terminate this model at any time.
Appendix
The purpose of this appendix is to provide a comparison of results for a tax efficient investment strategy to those of a moderate turnover investment strategy. The stock universe is the same throughout the period as selected end of June 2014, thus the results may be affected to some degree by survivorship bias. However, as shown in this article this effect is not pronounced when backtesting over shorter periods.
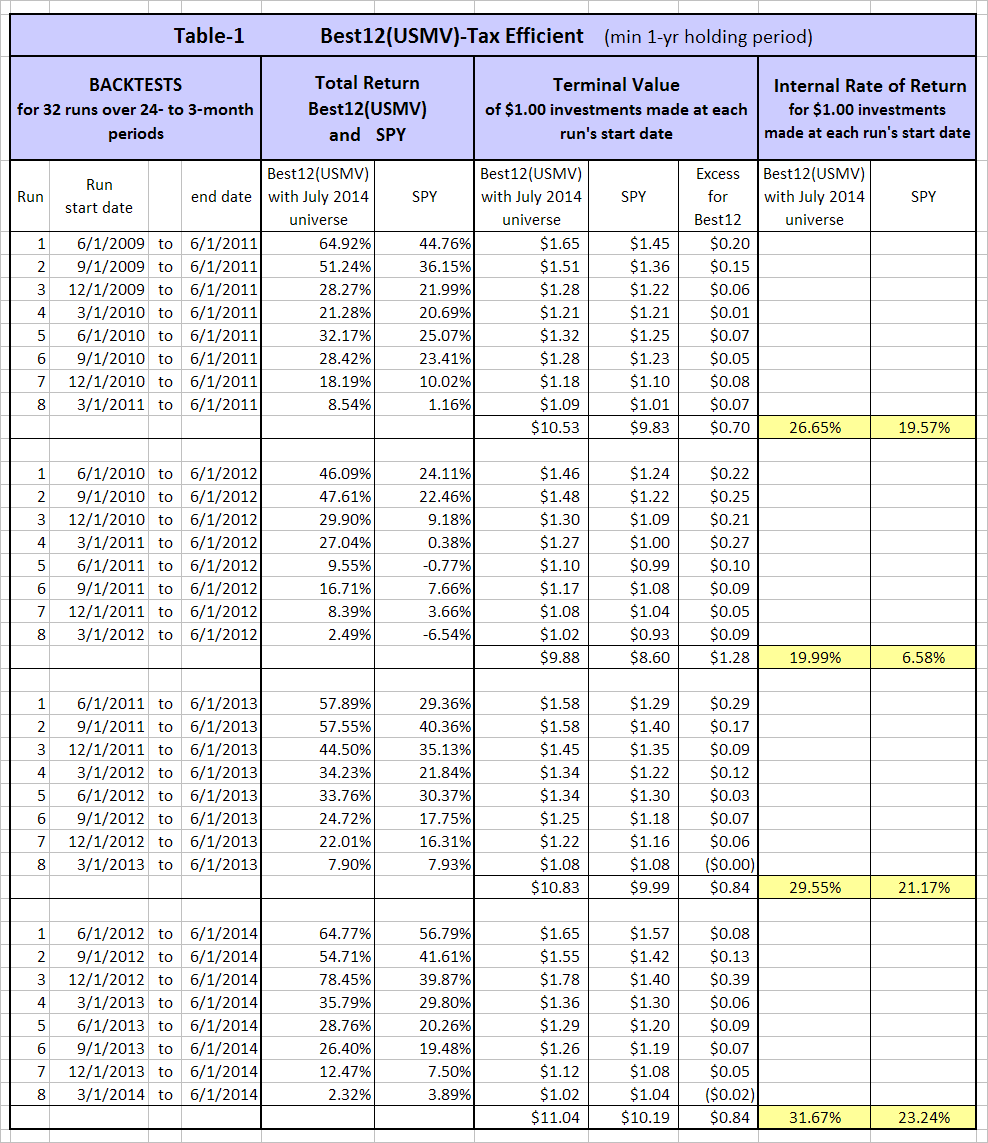
Best12(USMV)-Tax Efficient
Table-1 shows the results of four sets of 8 runs ranging in length from 24- to 3-months, and starting in yearly increments from Jun-1-2009 to Jun-1-2012. For each run a new portfolio of the 12 highest ranked stocks was chosen from the Best12(USMV)-July model’s universe. Backtest results are compared to those of SPY.
- For all periods (except one 3-months period) total returns were always greater than what SPY would have provided over the same periods.
- Terminal Values of $1.00 investment (a total of $8.00) made at the beginning of each period in the Best12(USMV) and SPY were also consistently higher for the model than for SPY.
- For the four 2-year periods the internal rate of return for eight $1.00 investments made every 3 months ranged from 20.0% to 31.7%, all higher than for SPY.
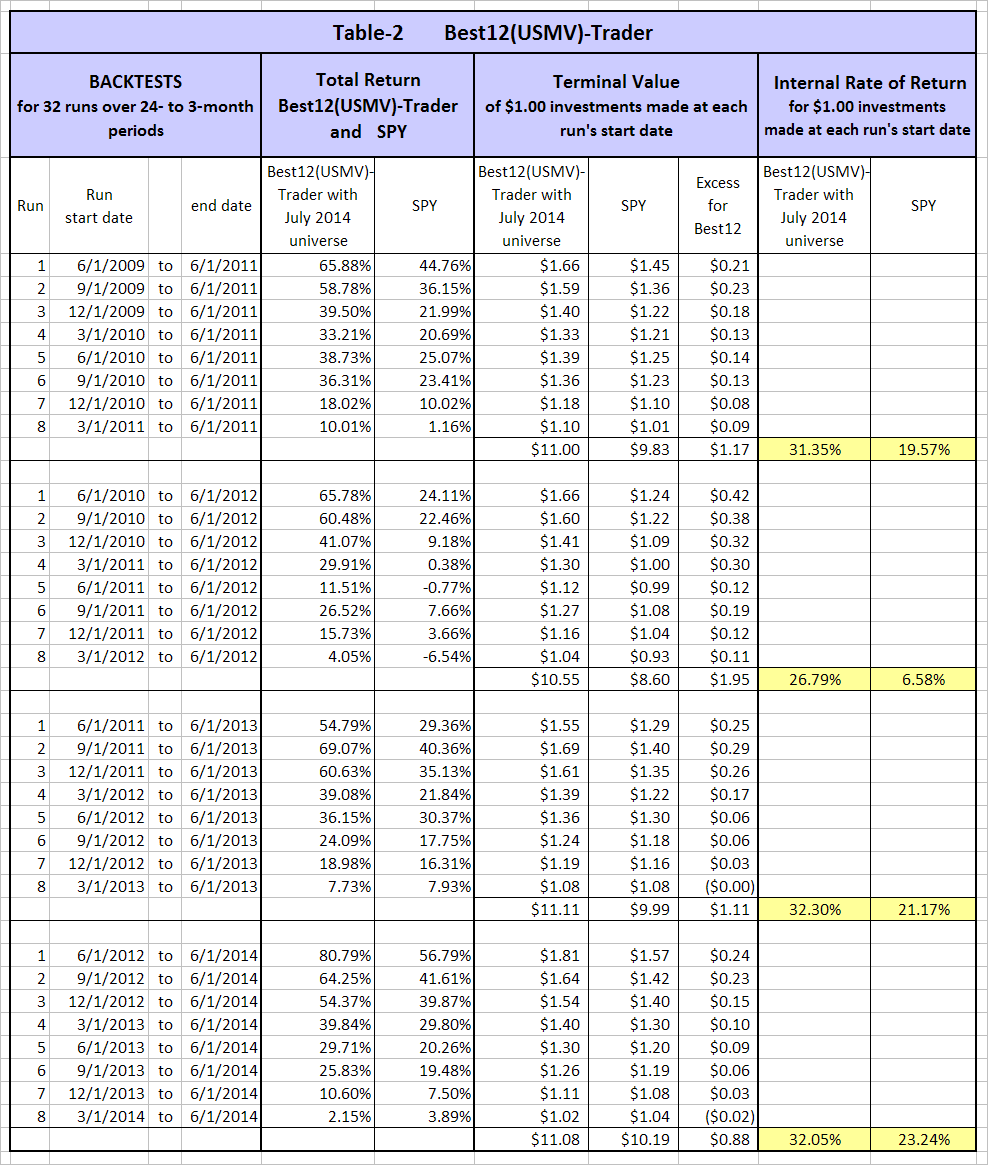
Best12(USMV)-Trader
Table-2 shows the results for the Trader model. There are the same four sets of 8 runs as in Table-1. For each run a new portfolio of the 12 highest ranked stocks was chosen from the Best12(USMV)-July model’s universe. Backtest results are compared to those of SPY.
- For all periods (except one 3-months period) total returns were always greater than what SPY would have provided over the same periods.
- Terminal Values of $1.00 investment (a total of $8.00) made at the beginning of each period in the Best12(USMV)-Trader and SPY were also consistently higher for the model than for SPY.
- For the four 2-year periods the internal rate of return for eight $1.00 investments made every 3 months ranged from 26.8% to 32.3%, all higher than for SPY, and more consistent than the internal rate of returns for the tax efficient model.
Georg,
Where will trader updates be posted? Thanks.
Trader updates will be posted weekly on Tuesday together with the other stock/ETF models. The first update for Sep-29 will be posted on Sep-30. You can view the Sep-22 update in the article.
Georg,
I find myself somewhat addicted to the Trader portfolio. Do you foresee continuing to track and update this model? Thanks.
Yes, we will continue to post weekly updates normally on Tuesdays, which will reflect the past Monday’s trades.
From your latest back-test, can you tell me the 3 year standard deviation of the Best 12 Trader vs SPY? (And inception (January 2000?) if you have it.) Thanks.
Thanks for providing us with your valuable, information packed website. I follow the Trader portfolio and would like to know if you employ the same stop loss as the Best 12 tax efficient model of 15% from the stock’s high since purchase.
There are 2 sell rules:
Rank and
PctFromHI <= -15. Therefore a position that loses more than 15% from a recent high is sold. However, if it is simultaneously ranked highest it will re-bought.
What are your specific thoughts about getting started ? Buy in on all 12 positions that are current ? Wait for new buys ?
The Trader is rebalanced every 2 weeks. If a stock gets sold due to sell rules listed above it gets replaced with the highest ranking stock, but it can also be repurchased if it is the highest ranked stock itself.
We can’t provide guidance as to what is best for your particular situation, but if one wants to follow the model then one must have a portfolio of all its stocks.
explain the difference between Best 12 USMV…on the updated returns why Q1,Q2,Q3,Q4 on the investor returns. … are these different models ?
The Best12(USMV)-Trader selects the highest ranked stocks by applying buy and sell rules weekly.
The Q1,Q2,Q3,Q4 Investor models hold their stocks for at least 1 year unless a stock loses 15% from recent high, or if the stock drops out of the universe which is updated every 3 month. Their start daters are staggered by 3 month.
(see iM-USMV Investor Portfolio)
https://imarketsignals.com/2015/im-usmv-investor-portfolio/
regarding the model- Is it fair to say that the model will always be invested in 12 positions regardless of market conditions. If this is true can you suggest a hedge, ie selling 1/3 of all positions and buying a 2x inverse ETF/Fund? what timing model would you suggest using to implement this?
Thanks
Buy on 17/19 (TXN) but mot listed in portfolio and no sell signal?
my mistake
Hi;
The 8/26/19 summary of this system shows it holds ORCL, bought 7/22/19. However, the Most Recent updates show it holds CTSH, bought 6/10/19, and no ORCL. Can you clear up this discrepancy for me? Thanks for your great work.
CCV
Hi George,
1)what’s the historic sharp ratio for this model ?
2)The Weekly Max Drawdown is -20.88 ? Is correct ?
Since Inception 06/29/14 to 12/9/2019
… Model … S&P 500 (SPY)
Total Return (%) … 127.87 … 77.82
Annualized Return (%) … 16.3 … 11.13
Max Drawdown (%) … -20.88 … -19.35
Monthly Samples … 65 … 65
Standard Deviation (%) … 13.87 … 11.65
Sharpe Ratio … 1.11 … 0.89
Sortino Ratio … 1.52 … 1.18
Correlation with SPY … 0.88 … –
R-Squared … 0.78 … –
Beta … 1.05 … –
Alpha (%) (annualized) … 4.6 … –
Thanks Georg! In order to make a comparison you can also publish (sharpe max dd and other historic metrics) of your other 2 stocks portfolios 10usmv min vol investor and 10 vdigx trader. Thanks in advance
THE MODEL IS NOT UPDATED. 12/9 exit FB entry ANTM
FB is still in portfolio or not ?
The Tuesday report shows the portfolio and trades as diseminated by our Sunday signals emails. On rare occasions the Monday 3.00 AM update on Portfolio123 adds a new trade. FB on 12/9 was such a spurios signal and we updated the model to reflect the portfolio as per our Sunday emails.