
A Combination Model of: Best(SPY-SH).R1 + Best1(Sector SPDR).R1 + Best(SSO-Bond).R1
-
Due to inconsistencies in SPEPCY (SP500 Current Year EPS Estimate) data at the beginning of the calendar year we have amended Combo3.
-
Going forward we will not replicate the signals from the P123 subscription models anymore as the P123 models can only be revised every six months. We have set up new component models for Combo3.R1 which incorporate rule changes.
-
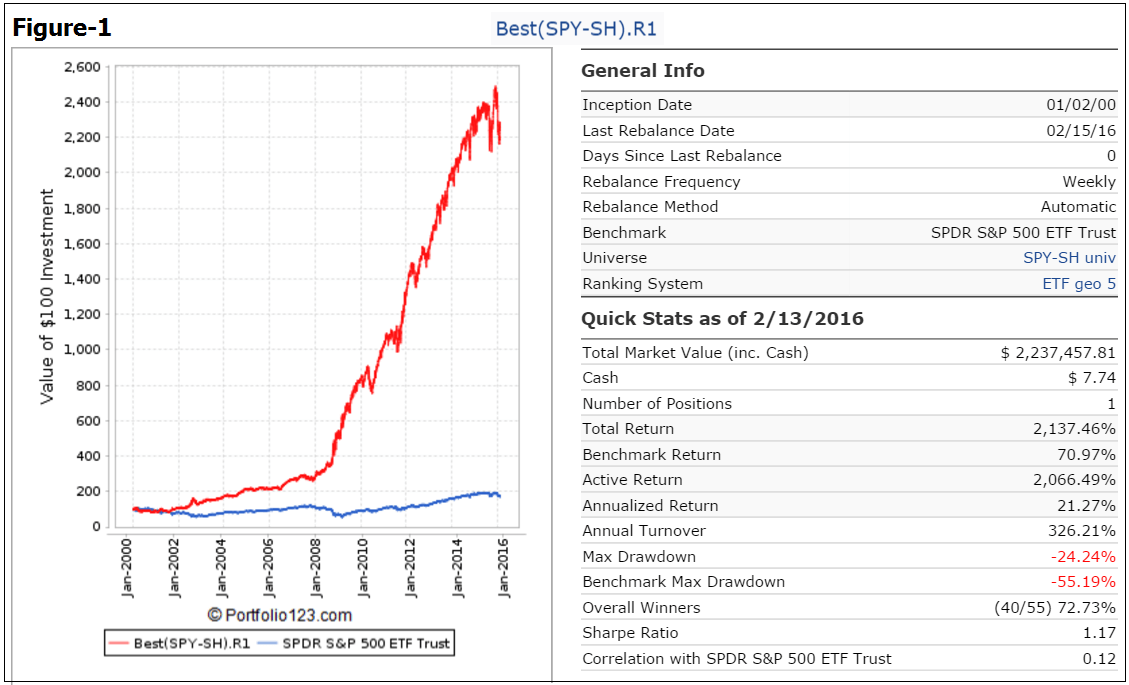
Best(SPY-SH).R1 replaces Best(SPY-SH), (Figure-1).
-
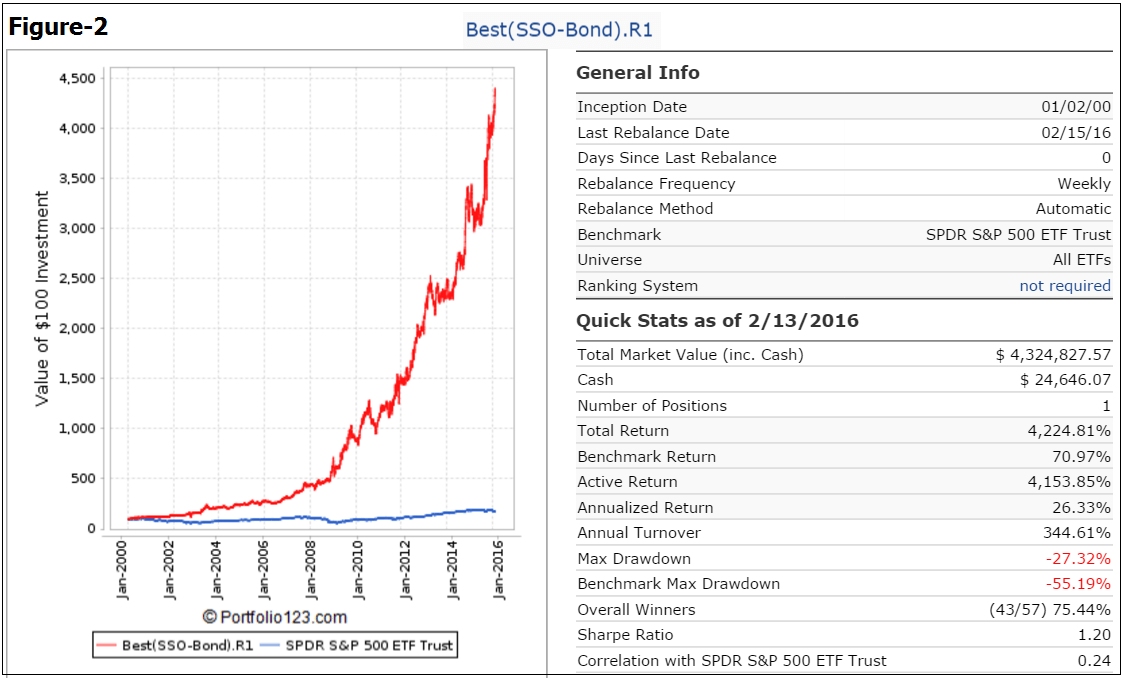
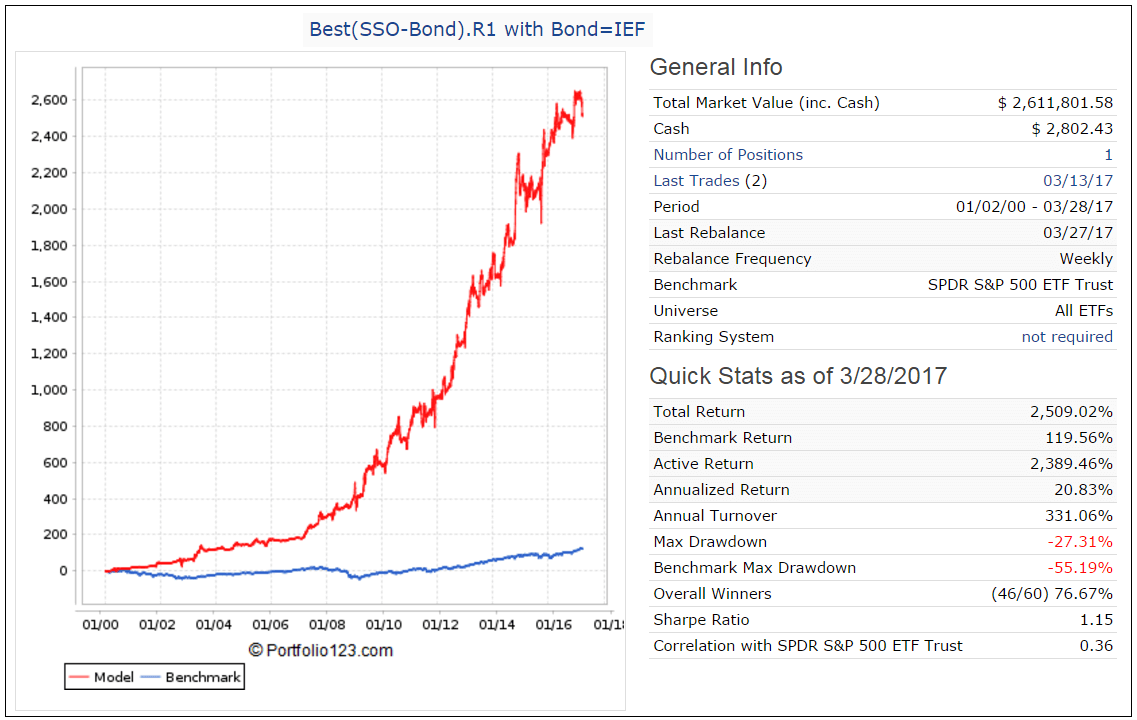
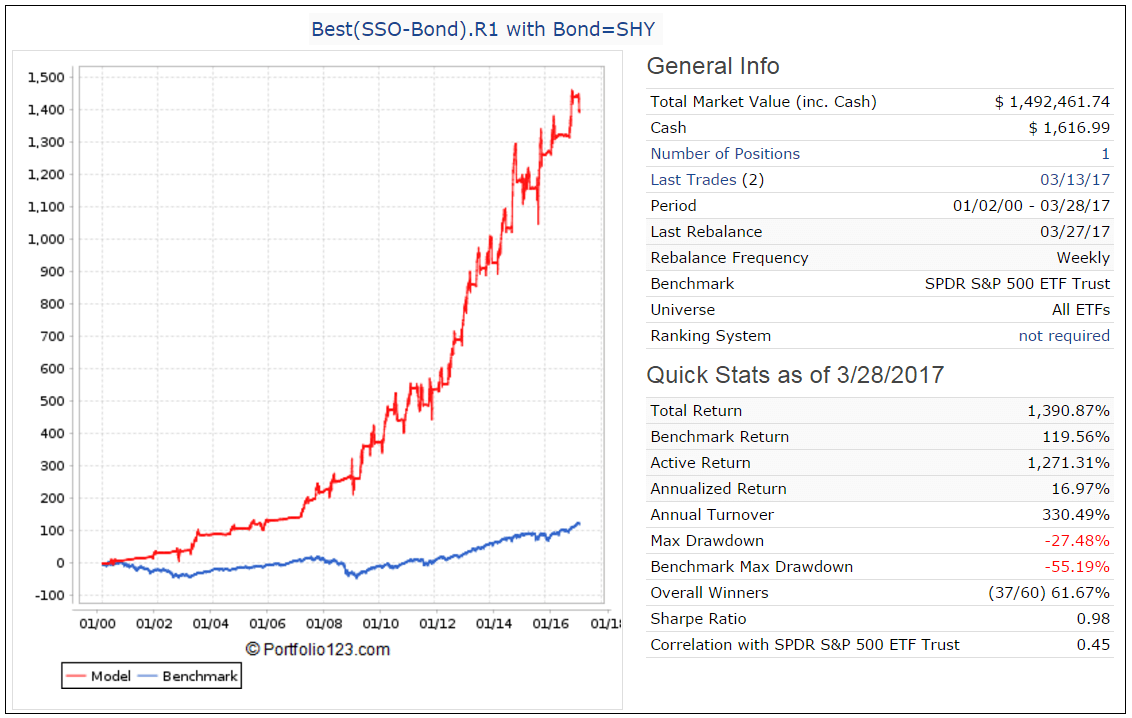
Best(SSO-Bond).R1 replaces Best(SSO-TLT), (Figure-2). Currently Bond = TLT. In future TLT could be replaced with IEF or SHY.
-
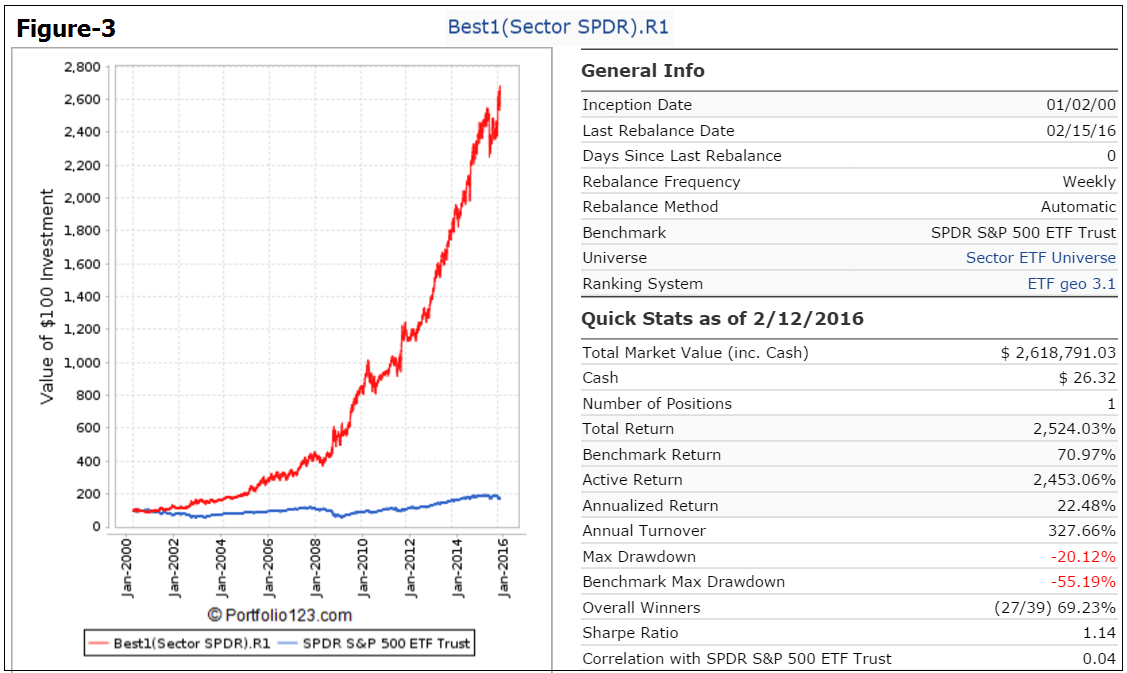
Best1(Select SPDR).R1 replaces Best1(Select SPDR), (Figure-3).
-
The simulated trading performance of Combo3.R1 from Feb-2014 to Feb-2016 is shown in Figure 5 below. The total return would have been 48.6% with maximum drawdown of -7.3%. For the same period the reported out-of-sample total return for Combo3 was 26.3% with maximum drawdown of -11.3%.
Simulated performance of component models
Simulated Performance of Combo3.R1
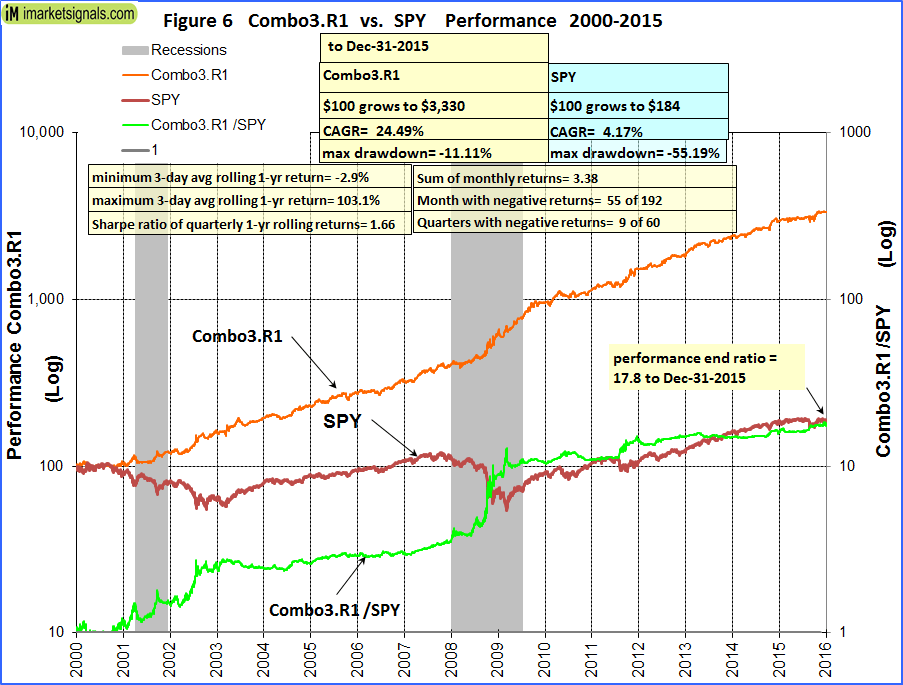
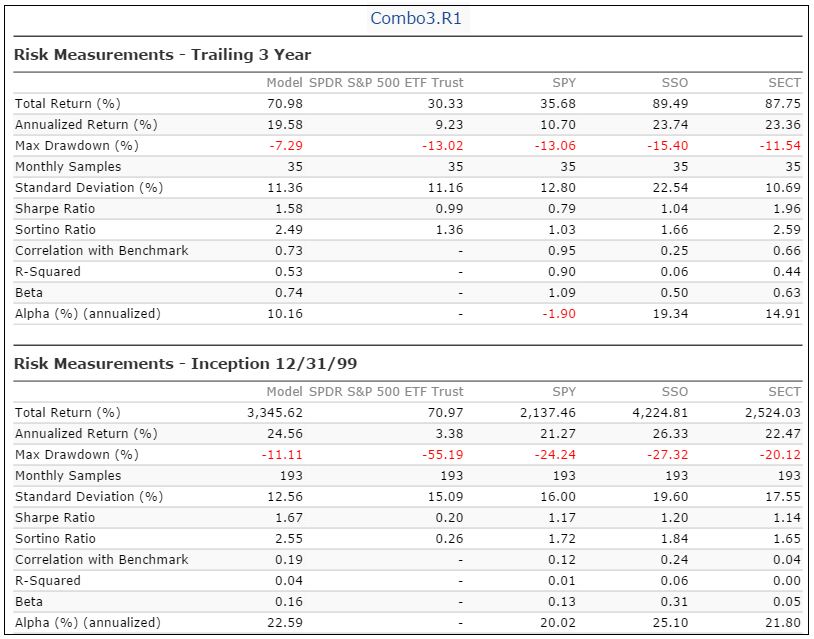
The simulated trading performance of Combo3.R1 from Jan-2000 to Feb-2016 is shown in Figure 4 above. The annualized return would have been 24.6% with maximum drawdown of -11.1%. All values are with dividends reinvested.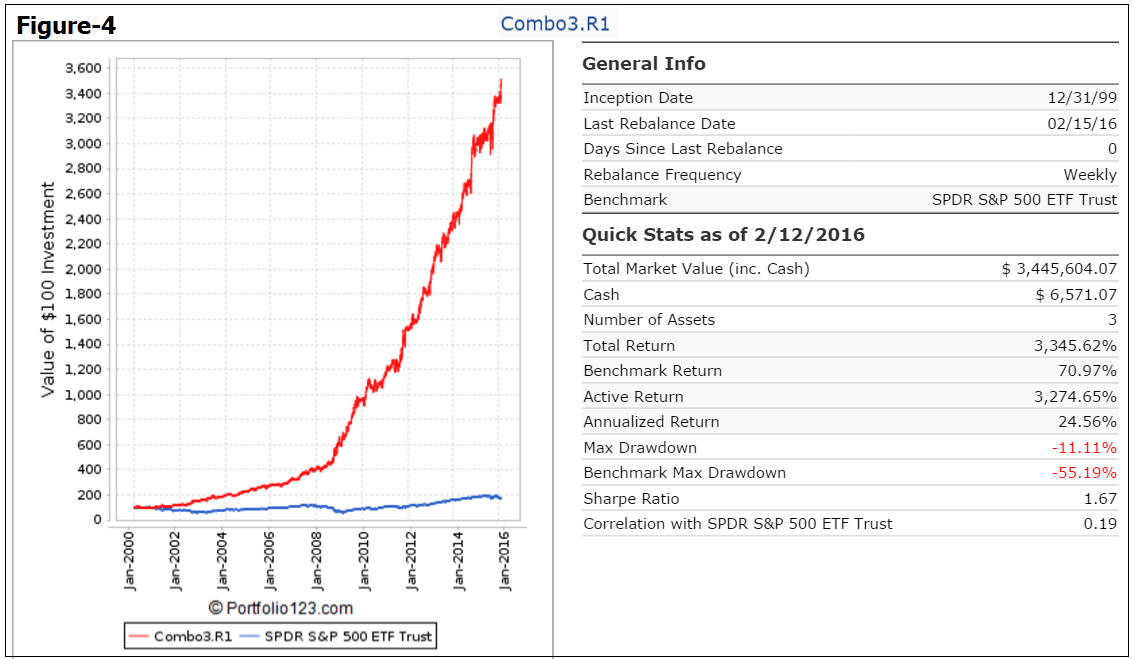
The simulated trading performance of Combo3.R1 from Feb-2014 to Feb-2016 is shown in Figure 5 above. The total return would have been 48.6% with maximum drawdown of -7.3%. For the same period the reported out-of-sample total return for Combo3 was 26.3% with maximum drawdown of -11.3%.
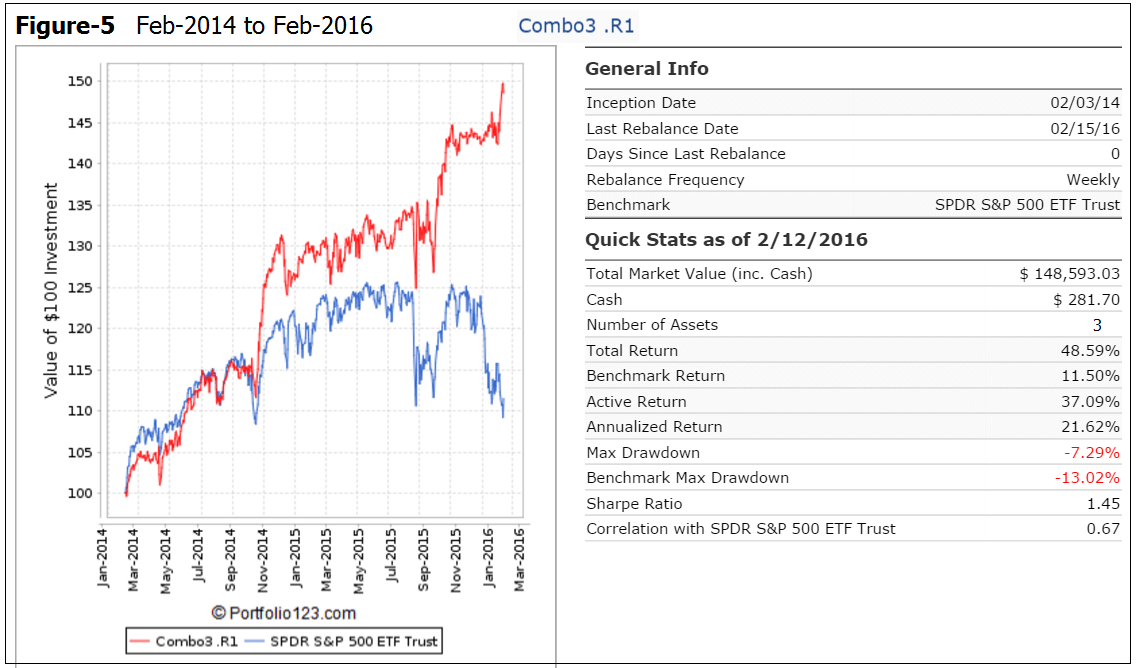
Figure-6 shows performance from Jan-2000 to Dec-2015. The green graph is the performance ratio of the Combo3.R1 to SPY. A rising slope of this graph indicates when Combo3.R1 outperformed SPY; Combo3.R1 produced about 18 times the value to December 2015 which one would have had from a buy-and-hold investment in SPY over the same period.
Annual Returns
Calendar year performance ranged from a maximum of 54% for 2008 to a minimum of 4% for 2000. There would never have been a loss over any calendar year.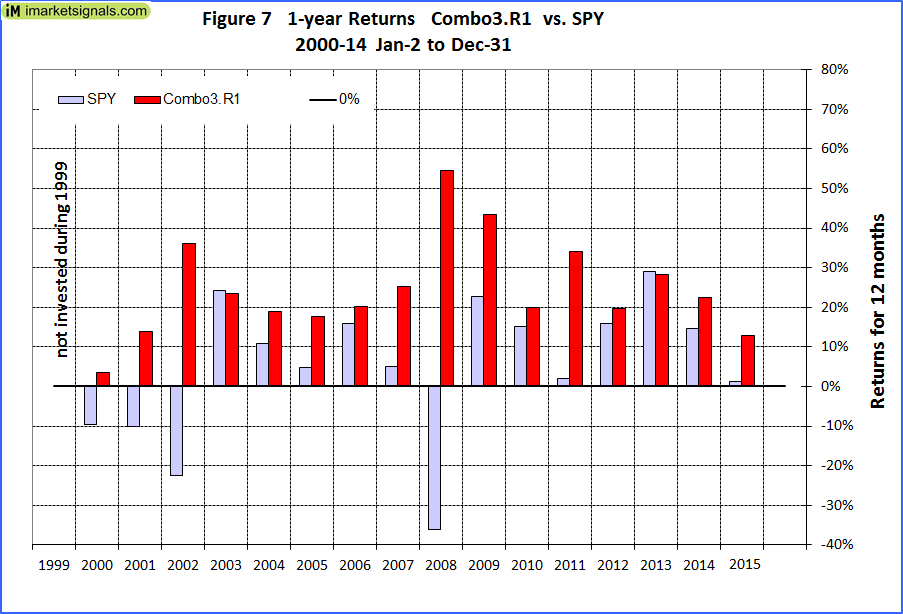
Rolling 1-year returns
Figure 8 shows the rolling 1-year returns starting each trading day from 2000 to 2015. The minimum return over 12 months was -2.9% and the maximum was about 100%.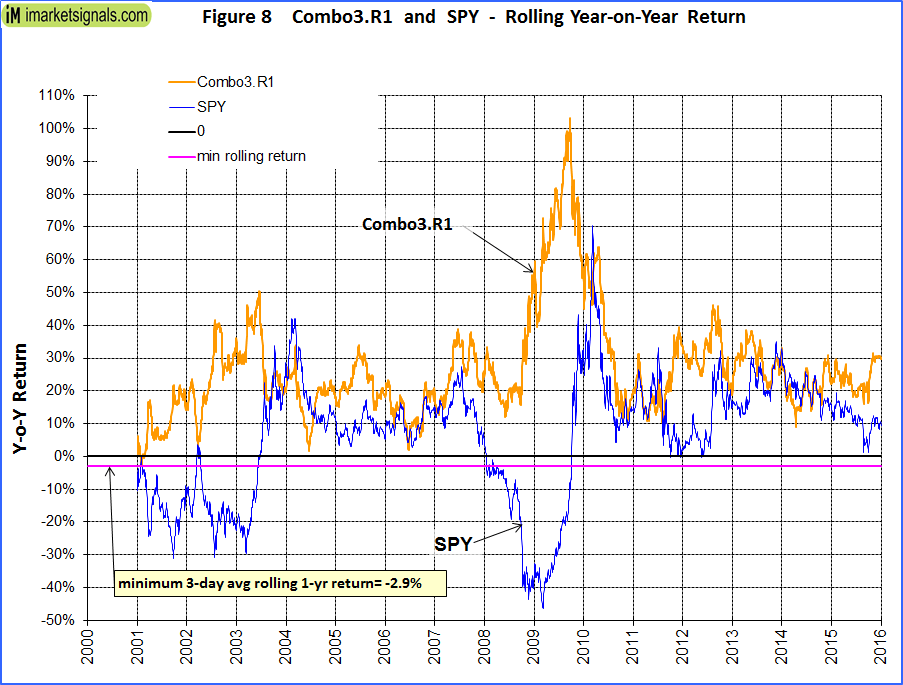
Distribution of Monthly Returns
Figure 9 shows the distribution of monthly returns. There were a total of 192 months in the period under consideration. Combo3.R1 produced positive returns during 137 months and only 55 months had negative returns. SPY had 81 months of negative returns.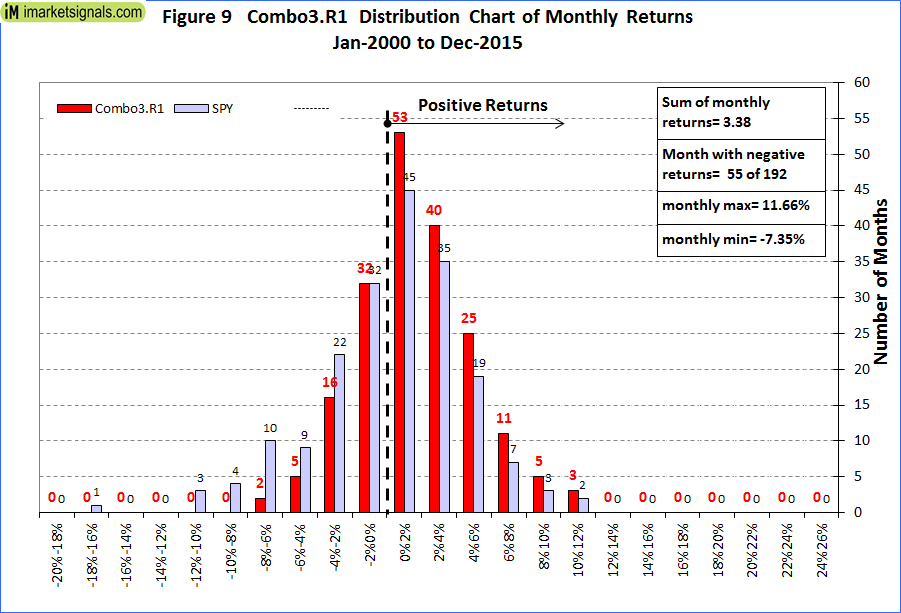
Correlation between component models
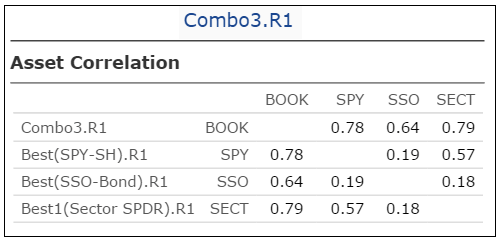 The correlation between the component models is fairly low, with 1.0 signifying 100% correlation.
Risk Measurements
Following the Model
This model can be followed live at iMarketSignals, where it will be updated weekly together with our other trading- and macro models.
Appendix 1
Disclaimer
One should be aware that all results for the Combo3.R1 system are from a simulation and not from actual trading.
All results are presented for informational and educational purposes only and shall not be construed as advice to invest in any assets. Out-of-sample performance may be much different. Backtesting results should be interpreted in light of differences between simulated performance and actual trading, and an understanding that past performance is no guarantee of future results. We can make no claims about future performance of this combination model, which may include significant potential for losses. All investors should make investment choices based upon their own analysis of the asset, its expected returns and risks, or consult a financial adviser. The designer of this model is not a registered investment adviser.
Hi Georg
These new Combo3.R1 past performance/risk #’s will certainly change the performance/risk #’s for the old Combo3b model. Could you possibly update the performance #’s of the Combo3b (now Combo3b.R1?)??
Many thanks
Jim V
Jim, here is the link to the simulated Combo3b.R1 performance
The charts and data for this strategy are a bit behind.
Is something available to show more current results?
iM-Combo3.R1 performance can be found in the link “Model Performance Tables”.
https://imarketsignals.com/wp-content/uploads/2021/02/2-Combo3-2-9-2021.png
Good request. If you can, please include the period from Feb-2014 to Feb-2016 like you did for like you did for Combo 3 and Combo3.R1.
Thanks.
Bill, here is the link to the simulated 2014-2016 performance
Hi Anton, it appears the asset allocation in those Combo3b.R1 simulations is incorrect. Shouldn’t it be 33% BESTOGA3, 33% Sector SPDR and the final 33% SPY-SH, rather than SSO-Bond?
Also I am curious about the CAGR and Max Drawdown of two other simulations you might have already tried:
1) Combo3.R1 with the SSO-Bond portion replaced with QLD-Cash (as someone suggested in the comments on P123).
2) Is there any benefit to doing something like a “Combo4” in a larger portfolio where it is split four ways with 25% each of BESTOGA3, SPY-SH, Sector and SSO-Bond?
Thanks for your time,
Ryne
Thank you for pointing out the incorrect allocation in the charts. This has now been fixed.
1) QLD has only been available since Jun-2006, so we can’t use it for a long backtest.
2) Combo4b.R1 gives good results with 25% each of BESTOGA3, SPY-SH, Sector and SSO-Bond.
from 2000-2016:
Annualized Return 24.95%
Max Drawdown -9.68%
Sharpe Ratio 1.90
from Feb-2014 to Feb-2016
Annualized Return 24.52%
Max Drawdown -6.94%
Sharpe Ratio 1.81
Those are good results below. Do you have the “minimum 3-day ave rolling 1-yr return” and the “sum of monthly return”?
Thanks again.
Combo4b.R1 minimum 3-day ave rolling 1-yr return is +6.3%.
sum of monthly returns = 3.36.
What exactly did you change in the model, specifically SPY/SH??? The data source for earnings, or does the model even use earnings anymore?
Thanks!
Model still uses SPEPSCY, but inconsistencies of the data at the beginning of the year have been addressed.
Anton, Just to be sure with the SSO/Bond you will be making weekly calls for SSO, TLT, IEF, or SHY?
SSO-TLT was changed to SSO-Bond so that the model is not permanently stuck with TLT. Currently this model is in TLT and will eventually move to SSO. At that stage we want to change the model so that it picks a shorter duration Treasury when it sells SSO. We will use the BVR model for this.
What was factored in for commissions/fees? If one had a rate of $7 per trade what would be the minimum account value that would make sense to trade this model? I’m wondering on smaller accts of $5K if a combo2 (eliminating one of these strategies) would make more sense. What are your thoughts?
Thank You.
We use slippage to account for commission and trade prices being perhaps higher than the closing prices the models assume. For the Bestoga3 model variable slippage was assumed (about 0.14%) and for the ETF models slippage of 0.1%. If one were to pay $7 per trade than the allowable slippage would have to be less to match the model’s return, and also it would depend on the number of stocks traded
The idea of a combo is to combine models having a low correlation to each other. This reduces risk. The fewer models in a combo, the higher the risk.
Have a look further up at Combo4b.R1 with 25% each of BESTOGA3, SPY-SH, Sector and SSO-Bond. The max drawdown is better than for Combo3b.R1, and the return and Sharpe is also better.
We can’t give any advice as to what is an appropriate trading amount. Please see our Terms of Use.
Hi Anton,
Similar to ryneschraw’s question, is there any benefit to a “Combo4″ using 25% each of SPY-SH, Sector, SSO-Bond, and the Aggressive Market Grader model?
Thanks.
We can’t backtest the Grader and Combo4.R1 together in a single model.
I just logged into P123. I am curious to know what the difference is with the prior version’s of SPY-SH, SSO-TLT and SECT running there and the revised combo 3 here. Is the P123 version of SPY-SH holding SPY versus this new model combo3 holding SH?
The P123 Version of Best SECT is down 12% for the year. What was changed with that model for the new revised combo 3? Is the P123 SECT holding SH versus what your new revised model has?
I’m just scratching my head wondering what model(s) are most likely to do best going forward with all these changes that have taken place.
Correct, the P123 version of (SPY-SH) is holding SPY versus (SPY-SH).R1 holding SH. Reason for this is that for (SPY-SH).R1 we have addressed the inconsistencies of the SPEPSCY data at the beginning of the year. This has not yet been done to the P123 version of SPY-SH.
The SECTOR model is out of SH at P123 and also at iM, both currently in XLV. Also the current holdings for SSO-TLT and SSO-Bond are the same.
Thank you. Can you shed some light on if SSO-TLT or SECT used/uses the SPEPSCY? How can we be assured going forward that these issues with SPEPSCY won’t become problematic and only resolved weeks after it coming to light?
Also, do you know why SECT had a 19% draw down recently when historically going back to 2000 that was the most it had ever been down against the market being down 55%?
Is there any way to track these new revised models and combos in a visual graph format like on P123?
Lastly, can you post the “annual performance” (each year listed seperately) of the revised SPY-SH.R1 and any other model that has been revised along with the combo’s annual performance’s?
As mentioned before the data series SPEPSCY has been revised twice in the last two years by P123, the last revision occurring on Dec-23-2016. The algorithms of these models used the un-revised series and when revisions of historic data are made the models react differently than anticipated.
We try to adjust the R2G models accordingly, but are only allowed to do this every six months. That is why we introduced the *.R1 models, which are not R2G models, so we can monitor and adjust them if needed. When permitted we will adjust the R2G models to mirror the *R1 models.
The R2G Sector model selected XLB which caused the large drawdown. The revised Sector model did not select XLB at that time, but held SH instead.
There is no to track these models daily on a visual basis, but the SPY-SH.R1 model’s weekly performance report is posted at iM, and also for Combo3.R1 which includes all three models.
Hi Georg and Anton
The model 4b.R1 is very interesting. Will you be giving a full performance/risk report on this model??
Many thanks
Jim V
Georg and Anton
Will you be giving a weekly position report on the 4b.R1 model?
Thanks
Jim V
No, we will not run this as a separate model. One can make up this model by allocating 75% to Combo3.R1 and 25% to BESTOGA3, and rebalancing occasionally to maintain those percentages.
Georg,
Does the 2014-2015 simulated performance use the new SSO-BOND or is it still using TLT only?
I would assume the former, but your comments at the beginning of the article indicate you are not switching to the BVR choices until after this cycle competes and we go back to SSO.
Thanks,
Jon
Jon,
Your assumption is correct. Currently model is in TLT. Subsequently it will go to SSO and then going forward we will use IEF. This should be a safer Treasury ETF under current conditions of very low interest rates. However, there is nothing to stop users from using shorter duration Treasury ETFs now already.
Thanks for the great models! I was wondering about performance of a different Combo3 with Best1(Select SPDR).R1 plus BESTOGA3 plus (QLD-IEF)Timer. Could you please check Annualized Return, Max Drawdown, Sharpe Ratio for such an approach? Thanks!
Best1(Select SPDR).R1 plus BESTOGA3 plus (QLD-IEF)Timer
From Jan-2000 to Apr-2016
Annualized Return…. 26.43%
Max Drawdown…. -15.63%
Sharpe Ratio…. 1.81
From Jan-2009 to Apr-2016
Annualized Return…. 31.15%
Max Drawdown…. -15.63%
Sharpe Ratio…. 2.00
The only difference I see mentioned between iM-Best(SSO-TLT[Bond]) and iM-Best(SPY-SH) seems to be whether or not SPY is adjusted for dividends. Does that really have enough of an effect to put iM-Best(SSO-Bond) in the market, while iM-Best(SPY-SH) could be out of the market?
Dividends are always included.
The correlation between those two models is very low, 0.19. So there is a big difference between them.
I’ve been meaning to ask, are the correlation figures between models based entirely on the underlying model itself or do they also take into account the similarity between the ETFs a model holds?
Correlation is based entirely on the underlying models, not the similarity of the ETFs which they may hold.
How would the results be affected if one used VOOV or VOOG instead of SPY, depending on which of the two was outperforming? VOOV does better during periods of Fed tightening, and VOOG when monetary policy is easy or easing. It would be interesting to see how much, if any, this would enhance the results of the overall model. Thanks!
VOOV and VOOG have only been available since Sep-2010. The Growth ETF VOOG has out-performed the Value ETF, and also SPY over this period. So it would have been advantageous to use VOOG instead of SPY.
Our backtest period is typically from Jan-2000 onward, and therefore those two ETFs are not usable for backtesting purposes.
Could you please add clarity to Fig. 5 above, which shows a graph of the Combo-3 R.1 hypothetical account performance spiking in value from around $143 on January 1st 2016 to about $149 in mid February 2016, an approximate 4% increase in value. In reality, the model took a big hit on Jan. 18th, and only recovered a small portion of these losses in the 2/8 and 2/15 trades. To date the model is down 8.1%. It appears that your graph is inaccurate. Am I missing something?
The graph is accurate. Here are the daily performance figures from Jan-1-2016 to May-27-2016.
Date : $100 Ret
01/04/16 : 142.91
01/05/16 : 142.67
01/06/16 : 143.36
01/07/16 : 143.39
01/08/16 : 143.62
01/11/16 : 143.14
01/12/16 : 143.71
01/13/16 : 144.34
01/14/16 : 143.76
01/15/16 : 144.54
01/19/16 : 144.34
01/20/16 : 146.04
01/21/16 : 145.24
01/22/16 : 143.05
01/25/16 : 144.76
01/26/16 : 143.34
01/27/16 : 144.35
01/28/16 : 143.99
01/29/16 : 142.45
02/01/16 : 142.25
02/02/16 : 144.81
02/03/16 : 143.72
02/04/16 : 143.92
02/05/16 : 145.81
02/08/16 : 148.28
02/09/16 : 148.24
02/10/16 : 148.69
02/11/16 : 150.24
02/12/16 : 147.47
02/16/16 : 145.51
02/17/16 : 144.99
02/18/16 : 145.51
02/19/16 : 145.56
02/22/16 : 145.47
02/23/16 : 145.94
02/24/16 : 145.77
02/25/16 : 145.97
02/26/16 : 145.5
02/29/16 : 145.34
03/01/16 : 144.28
03/02/16 : 144.37
03/03/16 : 144.23
03/04/16 : 143.69
03/07/16 : 144.11
03/08/16 : 144.58
03/09/16 : 144.1
03/10/16 : 143.89
03/11/16 : 143.58
03/14/16 : 143.52
03/15/16 : 142.74
03/16/16 : 142.89
03/17/16 : 142.61
03/18/16 : 142.82
03/21/16 : 143.55
03/22/16 : 144
03/23/16 : 143.21
03/24/16 : 143.15
03/28/16 : 143.01
03/29/16 : 143.75
03/30/16 : 143.93
03/31/16 : 143.78
04/01/16 : 144.27
04/04/16 : 144.11
04/05/16 : 143.92
04/06/16 : 143.97
04/07/16 : 143.89
04/08/16 : 143.91
04/11/16 : 143.88
04/12/16 : 143.98
04/13/16 : 143.97
04/14/16 : 143.97
04/15/16 : 143.93
04/18/16 : 143.95
04/19/16 : 143.99
04/20/16 : 144.05
04/21/16 : 143.91
04/22/16 : 143.9
04/25/16 : 143.98
04/26/16 : 143.91
04/27/16 : 143.92
04/28/16 : 144.03
04/29/16 : 143.95
05/02/16 : 143.87
05/03/16 : 143.94
05/04/16 : 143.91
05/05/16 : 143.99
05/06/16 : 143.95
05/09/16 : 143.92
05/10/16 : 142.71
05/11/16 : 143.65
05/12/16 : 143.57
05/13/16 : 144.56
05/16/16 : 143.44
05/17/16 : 143.37
05/18/16 : 142.94
05/19/16 : 143.01
05/20/16 : 143.01
05/23/16 : 143.12
05/24/16 : 142.98
05/25/16 : 142.98
05/26/16 : 143.17
05/27/16 : 143.08
Hi Geog,
Can you shed light on why the Sector model has stayed short the market since March 21 while the SPY-SH has gone long again as of May 16. It would seem that if the market is long as a whole, there would be at least one sector that merits investment as well.
Thanks,
John
On this combo strategy, does rebalancing of funds between the three individual strategies within the combo ever occur? Or is each strategy (the three parts of the combo) run separately within a portfolio for a total return from the three?
Thanks!
The 3 models in the combo get rebalanced when their weights drift apart. In the live combo the minimum transaction between the component models is set at $2,000, about 2% of the market value of the combo.
Regarding Fig 2 – Best (SSO_Bond) R1- Quick Stats as of 2-13-16. Since the Model was revised after Feb of 2016, could you provide a quick performance summary similar to Fig 2 using the new ETF`s from inception thru Feb 2016 for comparison. One would assume the total return would be lower since TLT has outperformed IEF and SHY in the approx. 16 year time period of the model.
Thank You and your mathematical models are superb.
We have updated the model description with Appendix-1 and posted performance for 3 models, SSO-IEF, SSO-SHY, and SSO-SHV. This shows the impact on the model’s historic performance from intermediate to short bond funds.
Are there any sell rules that should be implemented when buying the ETFs? As in, is there anything that would trigger a sell for one of the ETFs prior to the new holdings being released on Sunday?
Thanks!
The models are updated weekly at the end of the week. They are not rebalanced daily, and therefor can only respond to information that is available after Friday’s closing data is known.
Thanks for the quick reply! I just wanted to make sure there were no stop losses or anything else that could trigger sell orders prior to the weekend update.
Can you explain the apparent large gap in Combo3.R1 recent performance compared to the approximate return expected by averaging the 3 underlying Best.R1 models? Not sure if a spreadsheet formula is off in some way. Thanks.
Actually the average return of the three component models is almost the same as that for Combo3. Here is the recent performance from 5/162016 to 5/1/2017, so approx for 1 year.
Combo3.R1
Quick Stats as of 5/1/2017
Total Return 11.21%
Benchmark Return SPY 17.81%
Active Return -6.60%
Best(SPY-SH).R1
Total Return 17.92%
Benchmark Return 17.81%
Active Return 0.10%
Best(SSO-Bond).R1
Total Return 6.29%
Benchmark Return 17.81%
Active Return -11.52%
Best1(Sector SPDR).R1
Total Return 8.83%
Benchmark Return 17.81%
Active Return -8.98%
May want to double check SSO-Bond showing -5.05% for the week????
Performance is for week 3/12/2018 to 3/19/2018 and is correct.
So is it correct to hold 33.33% each of SPY, XLK, and cash right now?
I’m a little bit surprised that the sector hasn’t rotated from XLK. From what you can tell, are we close? In your estimation, which ETF would be the second choice at this point?
Tom C
I don’t know how close we are to a rotation.
Currently the highest ranked ETF would be XLE, Energy Select Sector SPDR Fund.
interesting. Thanks!
Hi,
could you please update the statistics (sharpe, minimum 1 yr rolling return, max drawdown…..) as well the year by year performance of this model?
Thank you very much.
Any reply on this?
Thank you.
still don’t understand why Combo3.R1 for purposes of the SuperTimer is at 50% instead of 75%.
Tom C
SPY-SH = 25%
SSO-Bond = 50%
Sector- SH = 0%
——
Stock Holding 75%
It is at 75% in the SuperTimer.
Here’s what I see on the SuperTimer chart on the home page as of 6/28:
weekly P123 2000 Best-Combo3.R1 1.0 50%
Tom C
as of today’s update (7/5) I still see on the second row of the SuperTimer table:
weekly P123 2000 Best-Combo3.R1 1.0 50%
Sector-SH is still the only model that is not long stocks…
Tom C
bump