
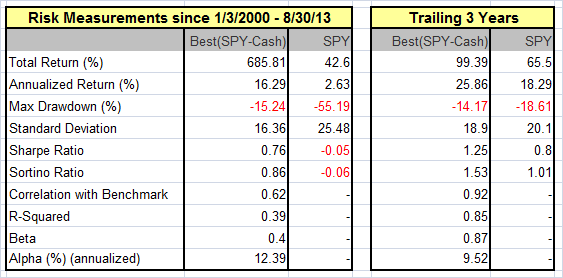
This binary model uses the signals from the iM-Best(SPY-SH) Market Timing System, and switches between SPY (SPDR® S&P 500® ETF) and Cash instead of SH. This model would have produced an average annual return of about 16.3% from January 2000 to the end of August 2013, versus 2.6% for a buy-and-hold investment of SPY over the same period, with maximum drawdowns of -15% and 55%, respectively. One would have been 66% of the time in SPY, which this model is holding at the time of writing.
Performance
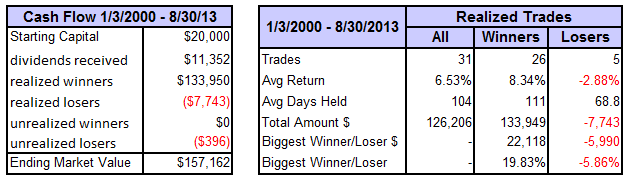
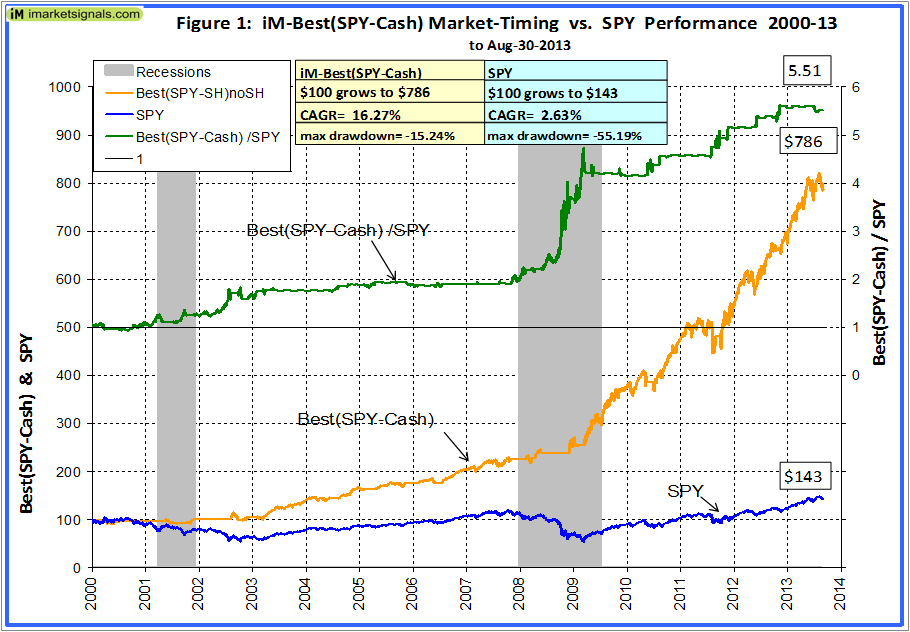
The trading performance of the system is shown in Figure 1 further down. The annualized return from January 2000 to end of August 2013 was a 16.3%; $100 grew to about $800 over this period. The maximum drawdown was -15.2% in October 2002. All values are with dividends reinvested. Slippage was assumed at 0.05% of the transaction amounts.
The model assumes an initial investment of $20,000 on Jan-2-2000. It either holds SPY or cash. To Aug-30-2013 there were 31 trades completed, 26 of these were winners and 5 losers, as summarized in the tables below, and listed in Table 3 in the Appendix. The amounts shown take account of transaction fees of $1,752 arising from brokerage fees and slippage.
 (Click to enlarge)
In above chart, the upper green graph is the ratio of the Best(SPY-Cash) to SPY, the general rising trend of that graph indicates that the Best(SPY-SH) continuously outperformed SPY; it produced 5.5 times the value which one would have had from a buy-and-hold investment in SPY over the same period. Even during the bull market periods from 2003-08 and 2009-13 did this model out-perform SPY.
Annual Returns
Annual performance from January to December ranged from a maximum of 38% for 2009 to a minimum of -3% for 2000, as can be seen in Figure 2.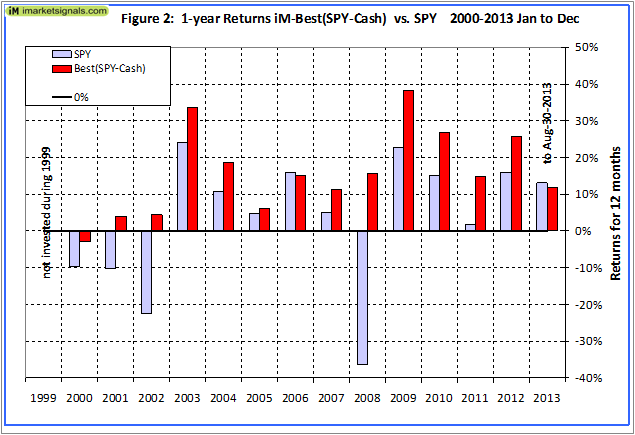
Figure 3 shows the rolling 1-year returns starting each trading day from 2000 to 2012. There was never a significant loss over any 1-year period. The minimum return over 12 months was -5% and the maximum was 56%.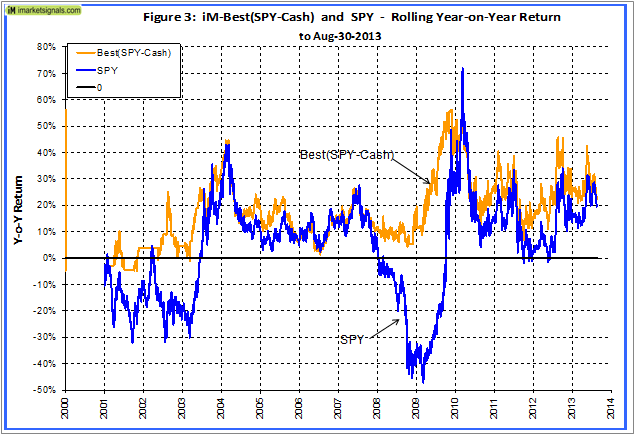
Terminal Values
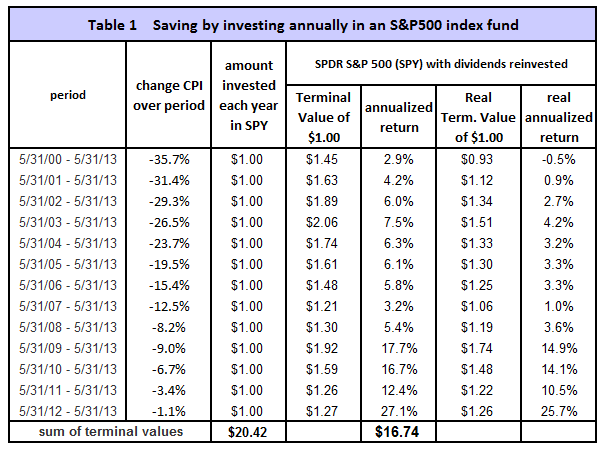
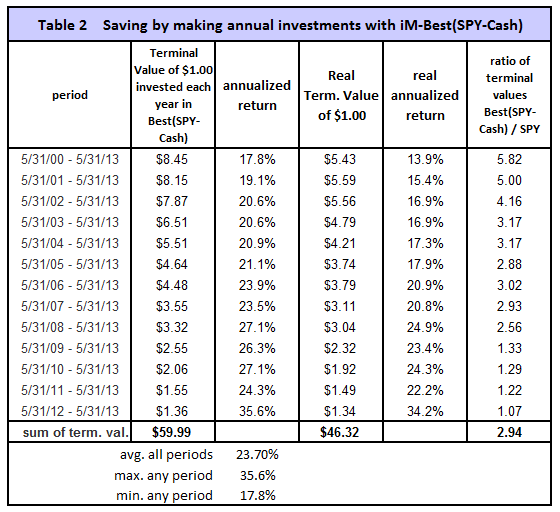
To simulate savings over time, terminal values were calculated to the end of May 2013 for annual hypothetical investments of $1. Starting with a dollar during each of the 13 years from 2000 to 2012, one would have invested a total of $13 cumulatively by the end. Summing the 13 terminal values, this strategy would have netted this dollar-per-year investor $60 at the end of 13 years.
Following a buy-and-hold strategy in SPY, one would have only $22, about one-third of what Best(SPY-Cash) provided. Furthermore, the lowest annualized return, for any of the 13 time periods was 17.8% and the average for all the periods was 23.7%. This is shown in Tables 1 and 2 in the Appendix.
Application to mutual funds
This market timing system could be used to time investments in stock index funds tracking the S&P 500. Table 3 in the appendix lists the investment periods when the model was in SPY, i.e. invested in the S&P 500, which was 66% of the total time from Jan-2000 to Aug-2013. For the remaining 34% of the time one would have had additional income from a bond fund or from cash in a money market account.
Appendix
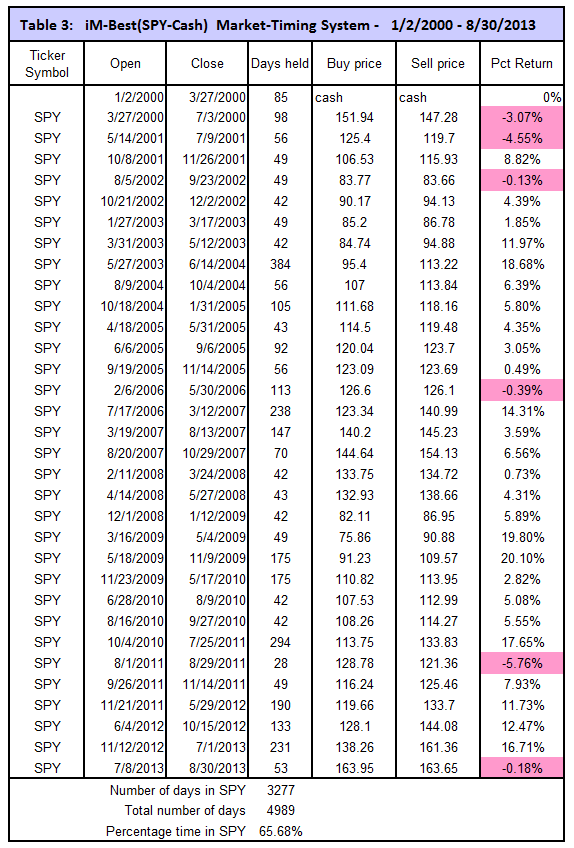
Note 1: In Table 3 the buy and sell prices are the closing prices of SPY. Compounding the Percentage Return results in the overall return without dividends and fees. Accordingly, over the time period 1/2/2000 to 8/30/213, $100 would have grown to $695. The actual growth as shown in Figure 1 was $786, the difference of $91 is from the compounded value of dividends received, less transaction costs.
Note 2: Table 3 above varies from Table 4 of iM-Best(SPY-SH) Market Timing System due to minor improvements to the model’s algorithm since publication:
- The price of the transaction is taken as the next day’s close instead of the average of next day’s Hi/Lo. This change reflects more accurately a 401(k) situation where the fund prices are calculated with the market’s closing prices.
- The new stop-loss provisions in the model, percentage from highest close since position started, has been set at -8% for SPY and SH.
iM-Best Systems
Quick Comparison
Quick Links to Model Descriptions
R2G & iM(Silver) iM-Best10(S&P 1500): A Portfolio Management System for High Returns from the S&P 1500
R2G iM-Best9(Russell 1000) – Large-Cap Portfolio Management System
R2G iM-Best8+ Portfolio Management System
iM(Gold) iM’s Best12(USMV)-Trader Minimum Volatility Stocks
iM(Gold) iM’s Best12(USMV)Q1..4-Investor Minimum Volatility Stocks (The Q3 model available to Silver)
iM(Silver) iM-Best10(VDIGX) Trading the Dividend Growth Stocks VDIGX
R2G & iM(Silver) iM-Best(SPY-SH) Market Timing System: Gains for Up and Down Markets
R2G & iM(Gold) iM-Best1(Sector SPDR) Rotation System
R2G & iM(Gold) iM-Best(SSO-TLT) Switching System
iM(Gold) iM-Best Combo3: Best(SPY-SH) + Best1(Sector SPDR) + Best(SSO-TLT)
iM-Best(SPY-Cash) Market Timing System
iM-Best(SSO-SDS): Beating the Market with Leveraged ETFs
Survivorship Bias: neither Myth nor Fact
Quick Links to Ready-2-Go Models
Best(SPY-SH) Gains for Up & Down Markets
When subscribing to P123 please use this link or enter token IMARKETSIGNALS when registering to obtain 30 days free membership.
Disclaimer: The opinions in this document are for informational and educational purposes only and are obtained from a mathematical algorithm and should not be construed as a recommendation to buy or sell the stocks mentioned. Past performance of the companies may not continue and the companies’ stock values may decline. The information in this document is believed to be accurate and represents the output of a mathematical algorithm, and under no circumstances should a person act upon the information contained within. We do not recommend that anyone act upon any investment information without first consulting an investment advisor as to the suitability of such investments for his specific situation. Also see our Terms of Use/Disclaimer.
Do you publish your signals – in mkt or go to cash – as they occur?
iM-Best(SPY-Cash) is derived from iM-Best(SPY-SH). We publish every Sunday, or early Monday mornings latest, the result of the iM-Best(SPY-SH) simulation for the coming week, and if you subscribe to iM-Best(SPY-SH) News you will also receive an email with this data.
If the model goes into SH, but you do not want to trade SH or not permitted as in 401(k) plans, you simply substitute SH with Cash.
Hi, Regarding iM-Best(SPY-Cash) system. I understand there are a set of rules that dictate in or out of the market. It would be helpful to see a chart of the S&P500 with a smoothed average of the rules under it. Cross the zero line going down (sell & Cash), cross zero line going up (buy S&P 500) similar to your MAC-US model. Like to get an idea of how close to sell we are today. Also where buy/sell signals fell on the S&P in the past..
Second, Where can I find the backtested performance of the MAC-US model?
Thanks !
Brandon. You can find the backtested performance of the MAC system at http://advisorperspectives.com/dshort/guest/Georg-Vrba-120910-The-Improved-MAC-System.php
We will have a look at the SPY-Cash system, and how to chart it.
Great, thank you, let us know—your back tested results are exceptional & model is easy to follow
Hi, I am confused as to what is the difference between the following two systems:
Best (SPY-Cash)
Best (SPY)
They seem identical to me other than start date (why is that?)
Performance is very similar.
Thank you
Brandon
Some investment periods are identical for the two models.
Best(SPY-Cash) uses the signals from the Best(SPY-SH) model, but instead of buying SH it goes to cash.
Best(SPY) uses market timing only to switch between SPY and cash. It is a different model.
George it looks like you took the backtested performance of this system off of the ‘quick comparison’ chart above…can you please add it back.
also in Sept i posted that it would be helpful to see a S&P chart with the buy/sell indicator overlaid…similar to what you do with the BCI chart.
Any thought on adding that?
Would make the system backtested performance that much easier to follow & understand. Also give us an idea how close we are to a ‘sell’ today.
Dear Mr verba
What moving averages you use in thi system to buy or sell.Plese clarify.
Thanks