
- For a detailed model description of the system please read the original description and previous update.
- To make this model more user-friendly we will be providing signals for three different version of this model, all updated weekly.
- The models’ holdings alternate between ETF (SPY) and ETF (IEF), being proxies for investments during up- and down stock market periods, respectively.
- The iM-1wk-SuperTimer (SPY-IEF) would have produced an annualized return of 19.9% with a max drawdown of about -10%.
- Appendix 2 shows that a (50%SPY+50%VCIT)-(IEF) strategy reduces drawdowns to -6.2% but would still have achieved an annualized return of 14%.
We provide three variants of the iM-SuperTimer that are triggered by the iM-SMC, an indication of the stock market confidence level, which we calculate on a weekly cycle. (See Appendix 1 or previous update.) The iM-1wk-SuperTimer is a fast response timer whereas for the iM-1mo-SuperTimer, and iM-3mo-SuperTimer, trade only in the relevant first week of the month. The strategy was modeled in excel with weekly data, and performance includes trading costs of 0.1% of the total switch trade amounts.
1. iM-1wk-SuperTimer (SPY-IEF)
This model reconstitutes weekly and has a specified minimum 5 weeks holding period of a position. This facilitates a holding period greater than 30 days, which in many instances is the required holding period of mutual funds. All trades are assumed on the first trading day of the week.
Simulated past performance, maximum drawdown, and number of trades, as well as current holding are shown in Figure-1.
For the period 1/3/2000 to 3/18/2019 the model would have produced an annualized return of 19.9% with a max drawdown of about -10%. A buy-and-hold strategy of SPY had an annualized return of only 5.4% with a maximum drawdown of -55% over the same period.
Since the iM-SMC level is available on Sundays, trading is assumed to occur on the first trading day of the week thereafter, usually a Monday. Trading should not be delayed by more than two days as the model’s annualized return diminishes then.
| Trading Day | Annualized Return |
| 1st | 19.9% |
| 2nd | 18.1% |
| 3rd | 16.5% |
| 4th | 16.6% |
| 5th | 16.0% |

2. iM-1mo-SuperTimer (SPY-IEF)
This model reconstitutes monthly. All trades are assumed on the first trading day of the week in the first week of the month. This should be more convenient to follow than a model which reconstitutes every four weeks.
Simulated past performance, maximum drawdown, and number of trades, as well as current holding are shown in Figure-2.
For the period 1/3/2000 to 3/18/2019 the model would have produced an annualized return of 16.7% with a max drawdown of about -19%. A buy-and-hold strategy of SPY had an annualized return of only 5.4% with a maximum drawdown of -55% over the same period.
The return is lower than for the model reconstituted weekly, but trading effort is reduced by approximately half from that of the 1-week model. Trading can be delayed as the model’s annualized return is not too much affected by trading a few days late from the first trading day of the week.
| Trading Day | Annualized Return |
| 1st | 16.7% |
| 2nd | 16.4% |
| 3rd | 16.3% |
| 4th | 15.4% |
| 5th | 15.2% |

3. iM-3mo-SuperTimer (SPY-IEF)
This model reconstitutes every three month. All trades are assumed on the first trading day of the week in the first week of the month. This model may be of interest to participants in retirement savings plans and education savings plans where the number of asset allocation switches per year is limited. This model shows only 16 switch trades over the 19 year backtest period, with a maximum of two switches in a calendar year.
Simulated past performance, maximum drawdown, and number of trades, as well as current holding are shown in Figure-3.
For the period 1/3/2000 to 3/18/2019 the model would have produced an annualized return of 14.1% with a max drawdown of about -19%. A buy-and-hold strategy of SPY had an annualized return of only 5.4% with a maximum drawdown of -55% over the same period.
The return is lower than for the models reconstituted weekly and every month, but trading effort is only about one third of the 1-week model. It only produced 16 switch-trades during the 19-year backtest period.
Trading can be delayed by up to 10 days as the model’s annualized return is hardly affected by trading a few days late from the first trading day of the week.
| Trading Day | Annualized Return |
| 1st | 14.1% |
| 2nd | 14.3% |
| 3rd | 14.5% |
| 4th | 14.1% |
| 5th | 14.1% |
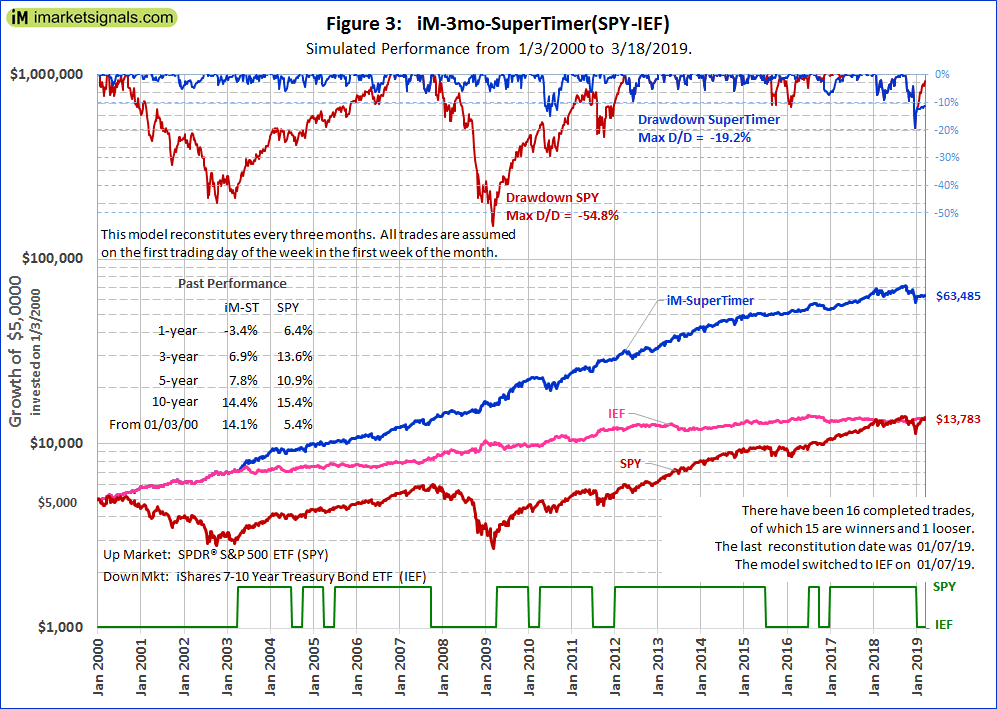
Despite this low trading frequency the model’s initial Jan-2000 investment would have grown from $5,000 to about $63,000 in 2019, for a total return of $58,000. This is an impressive performance. A buy-and-hold investment of $5,000 in SPY or IEF would have only grown to about $13,800 for a total return of $8,800 over the same period. So, following the few signals from the iM-3mo-SuperTimer one would have added more than 6-times as much to one’s savings as one would have had from holding either SPY or IEF.
Conclusion
The backtests suggest that the iM-SuperTimer based on the Stock Market Confidence Level Strategy could provide useful trading signals for investors and savers.
At iMarketSignals we have provided weekly updates of the iM-Stock Market Confidence Level for longer than two year now. We are currently providing updates for the weekly reconstituted iM-SuperTimer model. We will also provide weekly updates for the iM-SuperTimer models which are reconstituted monthly and every three months. Figures 1, 2, and 3 will be updated monthly.
| Subscription Requirement | |||
| Model | Gold | Silver | Bronze |
| iM-SMC Level | yes | — | — |
| iM-1wk-SuperTimer | yes | — | — |
| iM-1mo-SuperTimer | yes | yes | — |
| iM-3mo-SuperTimer | yes | yes | yes |
Disclaimer
The performance data shown represent past performance, which is not a guarantee of future results. Investment returns and portfolio value will fluctuate, and future signals from these models may not be as efficient as they were in the past.
Appendix 1
The stock market confidence level is recalculated on a weekly cycle from the stock holding percentages and importance factors of 15 models rounded to the lowest number that is divisible by 5.
| Table-1 iM-Stock Market Confidence Level iM-SMC = 50% ( 3/11/2019 ) | |||||
| Update Frequency | Calculation Platform | Backtest from | iM-Market Timer Model | Model Importance Factor | Stock Holding |
| weekly | P123 | 2000 | Best(SPY-IEF) Market Timer Combo | 0.5 | 25% |
| weekly | P123 | 2000 | Best-Combo3.R1 | 1 | 50% |
| weekly | P123 | 2000 | Composite (SPY-IEF) Timer | 2.5 | 0% |
| weekly | P123 | 2000 | Composite (SH-RSP) Timer | 1 | 100% |
| weekly | P123 | 2000 | Standard Market Timer | 1 | 100% |
| monthly | Excel/P123 | 1953 | Inflation Timer | 1 | 100% |
| weekly | P123 | 2000 | 3-mo Hi-Lo Index Timer | 1 | 100% |
| weekly | P123 | 2000 | Low Frequency Timer | 0.5 | 100% |
| weekly | P123 | 2000 | Market Climate Grader | 1 | 50% |
| weekly | Excel | 1965 | MAC-US Timer | 1 | 100% |
| monthly | Excel | 1965 | Coppock Indicator for the S&P500 | 1 | 0% |
| monthly | Excel | 1950 | CAPE-Cycle-ID | 0.5 | 100% |
| monthly | Excel | 1979 | CAPE-MA35 Ratio | 0.5 | 0% |
| monthly | Excel/P123 | 1950 | Seasonal Strategy | 0.5 | 100% |
| monthly | excel | 2004 | iM-Google Trends | 1 | 0% |
Historic weekly levels and holding periods can be download here: im-smc_to_3-18-2019.xlsx
Appendix 2
iM-1wk-SuperTimer: Up-Market 50%SPY+50%VCIT / Down-Market 100%IEF
We received the following question from one of our members which we believe to be of general interest to the iM community:
Could I accomplish a max drawdown of 5% or less using the 1wk Super Timer and using for the up market condition 50% SPY, 50% VFDIX (intermediate corp Bond) and 100% IEF for down condition? And if not, is there any combination of SPY and an intermediate corp bond in the up condition that would accomplish this with the lowest standard deviation possible.
We can model the 1-wk-SuperTimer on P123 since the recent ability to upload series data into P123. Therefore we can now quickly test different allocation models easily.
- Up-market allocation: 50% SPY + 50% VCIT
VCIT is the Vanguard Intermediate-Term Corporate Bond ETF current yield= 3.3%. - Down-market allocation: 100% IEF
We were not able to get a better drawdown than -6.2%, which is close enough to what is desired. Annualized return is still a high 14.0%. An initial investment of $5,000 would have grown to almost $70,000, with slippage of 0.1% of the trade amounts taken into account.
Risk statistics show a Standard Deviation of the monthly returns = 6.6% versus 14.4% for SPY. This would appear to be a very low risk model, according to the backtest, with a maximum exposure to equities of 50%.

Didn’t super timer ( old-1 week) buy spy on 3/18/19?
Thank You,
Mark
The new 1wk SuperTimer holds a position for a min period of 5 weeks to avoid weekly back and forth trading. This eliminates the annoying short holding periods which a weekly timer can have and also improves returns.
If you want to trade according to the old timer on a weekly basis, there is nothing stopping you from following the weekly iM-Stock Market Confidence Level which signals up-market conditions when iM-SMC > 50%.
Can you explain the 5 week feature a little more. Last week the 1 week timer went to SPY. Today it is shown as in IEF. So the model will hold SPY for 4 more weeks and in addition tomorrow go into IEF for a minimum of 5 weeks?
No, it does not work the way you say.
If you ignore the 5-week holding period then you just follow the weekly iM-SMC level, currently at 75%, indicating up-market conditions, and you would be in SPY.
The new 1wk-SuperTimer is reconstituted weekly, but holds a position for at least 5 weeks. It switched to IEF on 2/25/2019 and the 5 week holding period is not up yet. So, it is still in IEF. If by April-1 the iM-SMC level is still higher than 50% it will switch to SPY then.
Your email sent yesterday shows your iM Stock Market Confidence Level at 75% and the Web Site has not been updated still showing 85%. Maybe there is a reason but I thought I would point it out. Thanks.
As of Jan-12-2020 the iM Stock Market Confidence Level is at 85% not 75%. Apologies for the error in the email. The website is correct.
As long as the Stock Market Confidence Level is higher than 50% it signals investment in equities.
Georg,
I only see this error now, 2 months late! How come you don’t send out a corrected email after finding an error in your signals? Do you expect your subscribers to check all emailed signals with the signals as published on the website? That would mean the email has become completely redundant. I would absolutely vote for receiving a correction by email.
Mistakes can happen and are no problem at all. But at least they should be corrected once you find out. Luckily this error had no impact for me but it would have been very different in the 50-60 range.
Thanks for your understanding and I hope you can find a good way to deal with this as I think this is of tremendous importance.
drftr
I am having difficulty understanding all this. We now have 3 Supertimers whereas before there was one. The new one week Supertimer is now in IEF whereas before it was in SPY…why? Is this because of the (new?) 5 week holding rule?
Gold subscription members can follow any of the three models, depending on their needs.
Yes, the new 1-wk SuperTimer is in IEF because it switched to it on 2/25/2019 and the 5 week holding period is not up yet.
Please also see my other comment above.
Georg,
thank you for another great modification of the model.
This looks very appealing.
Can you please provide the trade dates for the 1-week (5 weeks holding) model?
Re: 1 wk Super Timer
The reason you reconstitute weekly is for those that want to trade weekly? But, for those that follow the recommended holding period, what happens in weeks 2-4 is noise and the next trade relies on what the IM SMC level is in week 5? For example next Monday we hold IEF. During next 2-4 weeks the IM-SMC stays above 50% but, in week 5 IM-SMC comes in less than 50%. The model would call for staying in IEF, correct?
The iM-SMC level>50% (or the old iM-SuperTimer) reconstitutes weekly, but holds a position for min period of 1 week.
The new 1-wk SuperTimer reconstitutes weekly, but holds a position for min 5 weeks.
You are correct in your assessment that the new 1-wk SuperTimer does not respond to changes in the iM-SMC level during the 5-week min holding period after a position change.
The link in the grid on the weekly updates page points to “Seasonal Switching Strategy” (your modified strategy that uses cyclicals and defensives) instead of “Seasonal Strategy” that you use on this page. I’m assuming you want the one on this page.
Tom C
“Seasonal Strategy” is the correct link.
Below a summary of the performances of the iM-SMC level>50% (or the old iM-SuperTimer) compared to the three new models. The iM-SMC level>50, which reconstitutes weekly with no hold period has a third more trades than the iM-1wk-SuperTrader and also under performs it. Note the 1wk model outperforms SPY in the upmarket period of the last 10 years, and the 1mo model equals it.
May I ask how much difference there was in thee draw down between the iM-SMC level > 50 and the iM-1wk-Supertrader? Thanks for an excellent set of strategies.
The max D/D is the same, -9.7%.
Hi Georg,
great work again !
Can you give us a list of the dates 45 trades for the weekly 5 model?
Thank you.
Can we have the list of trade for iM-1wk-SuperTimer (SPY-IEF)? thank you!
Below tables list all trades for the three models
(Note: Figure 1 erroneously reported 45 completed trades instead of 44)
hello Georg,
I am really impressed with these super timer models but a few questions:
1. based on the table, it seems the super timer model stayed in SPY during most of 2018 volatility, feb 2018 drops, oct 2018 drops, etc. Yes, the weekly model did get us out before dec 24th 2018 crash. The table is for list of trades and not the signals so I am wondering, would the weekly holding version ( not the 5 week holding period version) done better in getting us out during some of 2018 since it would have had 59 trades ?
2. For SSO, you said DD is -20%, is that monthly, so what would it be daily since that could be double or more isn’t it ?
thank you very much for really excellent models…. Rob
With weekly signals:
in ……………..out
10/31/16…………… 12/10/18
1/22/19 …………. 2/4/19
3/4/19……………..
Drawdowns are calculated from weekly data – 1st trading day of week.
Hello Georg,
Thank you very much. This is great. This is really impressive work.
1. One thing that I still am worried about is what the maxDD for DAILY would be over the 19 years that you show data for,just to get an idea if I could stomach it.
a. iM-1wk-SuperTimer (SPY-IEF)
b. iM-1wk-SuperTimer (SSO-UST)
2. Is it possible to go farther back for simulated backtest data, maybe back to 1970s to see results in multiple cycles
3. and what does simulated mean, I assume you are using real data from spy and vfinx to go further back.
best regards, Rob
Is it possible to update the table above to the current date?
Here is the update to the table posted by Anton on March 25, 2019 for the 1-wk model:
SPY 01/22/19 – 02/25/19
IEF 02/25/19 – 04/01/19
SPY 04/01/19 – 03/23/20
IEF 03/23/20 – 06/15/20
SPY 06/15/20 –
Hi Anton and Georg
Like this strategy. Can the 1 week model(s) be run using SH (1x inverse SPY) instead of IEF please?
Are buys made at the open or close on Monday??
Thanks
VMan
The simulation for 1wk-SuperTimer(SPY-SH) from 1/3/2000 to 3/22/2019:
CAGR= 22.0%, max D/D= -19%
Trade is always on close.
That one is strong also. Seems like there are several variations of this that could be strong, I am already starting to run them all in different portfolios:
100% SPY or IEF (your method)
100% SPY or SH
combo variable SPY/IEF based on SMC: %SPY = SMC%, %IEF = (1-SMC%)
variable SPY-SH: allocation = (SMC% – 50) * 2;
if positive SPY, if negative SH,
remainder in IEF or cash
Also could look at substituting gold as the non-stock asset if the im-Gold timer signals Gold
Tom C
Looks interesting. Let the community know if you find something that is easy to implement.
Thanks
Tom
My guess – just a guess – is that the performance of the 1-week SuperTimer using SPY-SH version – that doesn’t require a 5 week hold – has better (maybe much better) performance that the 22%CAGR/ -19% max DD stated above by Georg
Man
Man – I agree, but think it will be slightly better (similar to the SPY-IEF results compared 1 wk to 5 wk).
Tom C
I like your idea re: gold. Taking it a step further, perhaps the “out of market asset”, be it IEF or gold, can be determined by a separate indicator, perhaps based on inflation level or trend.
Looking back at 2009, a gold trend indicator could have been extremely lucrative as the out of market asset in the uptrend.
Also, as we don’t know what the next crash holds, gold could be the safe asset, who knows?
I agree. We know that the iM Gold Timer(rev1) uses Federal Funds Rate, 10-year Treasury Note yield, S&P500 Estimated Earnings Yield, and Gold Price. And it’s either in gold or it’s not. So it could be used as an on-off switch to either be in gold or in bonds. Or all bonds vs 1/2 gold 1/2 bonds given gold is a lot more volatile. Another useful on-off switch could be the BVR model that is used in the SSO-Bond timer. You could use that to choose your bond ETF — IEF or TLT.
Tom C
Hi Georg
Many thanks. Could the 1wk-SuperTimer(SPY-SH) backtest be run using the ‘NO 5-week hold’ condition please?
Thanks
Man
1, If the new 1 week supertimer holds for 5 weeks, why not call it the 5 week supertimer? 2, What does reconstitutes 1 week exactly mean in this new 5 week holding timer? And 3, will you still be tracking performance of the original 1 week supertimer? Thanks
1, The 1-wk SuperTimer is reconstituted weekly. That is what the 1-wk means. i.e it checks the iM-SMC Level every week.
2, When the 1-wk SuperTimer generates a signal for a position change it holds the position for at least 5 weeks, but it looks at the iM-SMC Level every week, and not every 5 weeks. The 1-mo and 3-mo models check the iM-SMC Level every 1- or 3 months only, meaning they are reconstituted every 1- or 3 months, respectively.
3, We will not be tracking the old model which had a min holding period of 1 week, but if you want to follow it just check the iM-SMC Level every week and trade accordingly.
Georg,
Regarding #2:
What is the point of checking/ reconstituting the iM-SMC level every week if the hold period is a minimum of 5 weeks? It does not appear from your description that any of the iM-SMC data from weeks 1-4 are used in the calculation to exit/enter a position, just the data from thee iM-SMC level of week 5. Am I misunderstanding you?
Thanks
You have to check the iM-SMC level every week. Assume after the 5-week hold, week-6 is still a hold, but week-7 is a switch signal. If you didn’t check every week you would not know this.
You are correct that during the 5-week hold period the check is ineffective, i.e. the model does not respond to it.
If one were to implement a ‘pure’ one month model, I’m assuming that the results would still be strong if one were to simply on the first day of the each month, simply use whatever the current iM Super Timer would suggest, regardless of the day of the week? It seems pretty clear given what all the other iterations have produced, but wondering if I’m missing something.
Tom C
The ‘pure’ one month model is the iM-1mo-SuperTimer model. This model only looks at the iM-SMC level on the first trading day of the week in the first week of the month, as per model description.
Right. In general that would trade every month plus or minus five days or so the way I am reading it. I trade on the first trading day of the month in my retirement plan. I was thinking that if I followed the current state of the Super Timer, that I wouldn’t lose much (if anything) in performance compared to your timing.
Tom C
Our models can only provide signals on a weekly basis, and trade on Mondays, if it is not a Holiday. Otherwise on Tuesday.
Georg,
Do I recall correctly that substituting RSP, the equal weight S&P Index, for SPY results in better returns than just using SPY when the timing signal says to be long the US market? What’s the performance difference?
I get that it’s a lot easier to just use the well know S&P 500 ETF or mutual fund (equal weight funds access are a problem with many retirement accounts) rather than RSP, since most investors are more comfortable with that index and it is more easily compared. Is there a downside, i.e., volatility, rather than just being relatively less well know, and in some cases less available as an investment option?
The three SuperTimer models use SPY and IEF to signal upmarket and downmarket conditions, respectively.
One can substitute combination models that hold more equity than fixed income for upmarket, and the reverse for downmarket conditions.
We are not looking for highest returns, otherwise one could use the double leveraged ETFs SSO and UST for huge simulated returns.
Hi Georg/Anton,
I like these strategies especially for 529 Education Accounts where you can only have 2 switches/year. Can one switch out the SPY and IEF for Total Stock Market Indexes and Total Bond Market Indexes? Some retirement plans and 529 accounts don’t offer SPY and IEF like intermediate bond funds, some do.
Thanks.
Eric
For the simulation using Total Stock Market Index ETF (VTI) and Total Bond Market Index ETF (BND) the total return is about 15% lower than for the SPY and IEF model.
For the 3-mo SuperTimer the terminal value of $5,000 growth from Jan-2000 to Apr-2019 with VTI and BND is $57,000 instead of $64,000 with a max D/D of -20%. CAGR=13.4% instead of 14.2% for the SPY and IEF model.
Many thanks for the simulation and re-running the numbers.
Have you looked at how a QQQ/IEF model would perform?
Are the above charts and list of trades going to be updated (maybe monthly)?
The Figures-1,-2,-3 are updated monthly.
Click on “iM System Performance” top RH of home page to see them.
Hi Georg
Hey, you mentioned above that using SSO/UST would generate ‘huge simulated returns’. Could
you please run a quick performance test…most interested in what happens to the MaxDD.
Thank you
Vman
Someone else wanted to know the same.
1wk-SuperTimer SSO-IEF
The backtest from 2000-2019 shows $5,000 growing to $1.3 million. The annualized return would have been 33.5% and max D/D= -20%.
If you really want more use UST (the 2x leveraged IEF) instead of IEF. That doubles the total return to $2.4 million and the annualized return would have been 37.9% and max D/D= -20%.
Georg
Many thanks! Very good results…Are the results above for the 5-Week Minimum Hold version??
Thx
Man
Yes, the 1wk-SuperTimer holds position for a min period of 5 weeks; it is updated weekly.
New here and a few questions before purchasing gold membership.
Can these strategies be implemented on different platforms and use free ETFs like IVV and VOO? And free bond funds like IEF and a Vanguard equivalent? Do the performances change much? For the trading on a Monday I read you always trade in close. Does that mean sell your positions at the open and then buy the recommended positions on the close?
Also are we given more insight into the strategy calculations once we are members. Wondering if we can have source code for manipulating or excel sheets for updating? If no, I understand.
Historic weekly levels of Stock Market Confidence Level from 1/3/2000 to 3/18/2019 can be download here:
im-smc_to_3-18-2019.xlsx – iMarketSignals
With this information you can design your own strategy with any funds you may want to use.
IVV and VOO will provide the same performance as SPY.
IEF can be replaced with any equivalent Treasury ETF from another fund provider.
This model is not limited to SPY-IEF trading. We use this as the standard allocations for most of the market timers.
For the simulation we assume buy and sell at closing prices on the first trading day of the week
Georg,
Could you post the CAGR/DD stats by year for each of the three versions?
Thanks
Georg and Anton,
I ask this question because I assume that some of your subscribers, myself included, are using this in non taxable IRA/401k accounts. I thought there might be value in combining the 3 versions based on 1/3 to get time diversification, and a smoother equity curve. Can you possibly run this as a model simulation and show the results?
Thanks
Hello Georg and Anton,
Thank you very much. This is great. This is really impressive work.
1. One thing that I still am worried about is what the maxDD for DAILY would be over the 19 years that you show data for,just to get an idea if I could stomach it.
a. iM-1wk-SuperTimer (SPY-IEF)
b. iM-1wk-SuperTimer (SSO-UST)
2. Is it possible to go farther back for simulated backtest data, maybe back to 1970s to see results in multiple cycles
3. and what does simulated mean, I assume you are using real data from spy and vfinx to go further back.
best regards, Rob
1. We use weekly data not daily. Therefore max D/D is for weekly.
2. no
3. Simulation means simulation. This is not historic out-of-sample performance.
hello, thank you for the answers and I am sorry to rant, but I know you show weekly data BUT I need daily maxdd to understand worse case situation.
As to simulation results, how do I use it? how much confidence do you have in those? Are they just experiments or based on reality.
Also, If you don’t go back far enough in time. Would/should that be a concern for investors
thank a lot for some really intriguing results but kindly help with some guidance on my questions
Max D/D for weekly data is similar to daily data. Look at the D/D graph for SPY. Max is shown as -54.8%, for daily data it was -55.2%.
We only introduced the SuperTimer in Jan-2019. However, the component market timers have been live for much longer. For example the Composite Market Timer went live in Sep-2016, and the MAC-US has been around for years. There is no guarantee that the SuperTimer will provide reliable signals in the future, as per the usual disclaimer: “Past performance does not guarantee future performance….”
Agree that it would be better to have longer historic data, but most of the models run on Portfolio 123 which limits the backtest period.
Hi Georg. I know its a limited window but could you tell me how the 3 flavors of SuperTimer would have performed substituting USMV for SPY from 10/18/2011 (USMV inception)to date, and how those stats compare with SPY during this same period? Many thanks.
We use P123 data for USMV, which has been extended by P123 back to 12/31/1998.
The SuperTimer with USMV instead of SPY provides lower returns because USMV’s beta= 0.72. That means it does not perform as well as SPY during upmarket periods which the SuperTimer seeks to identify.
SuperTim … YTD … 1-year … 3-year … 5-year … 10-year … Sim. Start
1wk … 8.6% … 16.9% … 15.2% … 12.7% … 18.1% … 18.2%
1mo … 4.5% … 5.8% … 10.0% … 10.0% … 16.7% … 15.1%
3mo … 3.4% … 4.6% … 6.0% … 7.6% … 13.0% … 13.3%
Understood. Thank you.
Hello. I want to become paid subscriber but kindly answer my questions so I feel a little comfortable with these models
Hi,
one clarification:
why this model has a better performance than the week before but the IM Composite Timer SPY-IEF has a lower performance than the week before?
Both the timers have SPY, so why this difference?
We do not publish the weekly performance (past 7 days) of the iM-Supertimers. However, we do show the YTD, 1, 3, 5 and 10 year returns on a weekly basis.
hello mr Vrba, can you kindly comment on super timer( iM-1wk-SuperTimer) keeping us in “spy” when there is so much downward pressure in the ETF. And since you switch every 5 weeks, where is that calender shown
thanks
Robin, mathematical models unfortunately cannot predict geo-political interferences in the free markets
Thank you sir, I understand now. Separately, since Feb,Mar 2018 and especially Oct 2018 and now May 2019 had significant drops, I am wondering if any technical analysis tool could be added to the indicators to catch these types of drops.
Hi,
regarding my question: “ why this midel has a better beformance than the week before but the IM Composite Timer IEF-SPY has a lower performance than the week before”
I made this calculation using your table, out of sample performance summary (YTD).
If you compare your table of the last week whit the one of the week before you will see this difference of performance between the 2 model, that’s why I asked this.
Could you explain this?
Thank you for your work.
When comparing the performance records of 5/13, 5/20 and 5/28 it becomes clear that the May 20 record was not correctly updated as it shows the May 13 performance of the iM-SuperTimers
Can we have the updated list of trade for iM-1wk-SuperTimer(SPY-IEF)?
Ok.
Then I don’t understand at all why on 13/05 there was a difference of 0,06% and on 28/05 the difference between the 2 models is 1,05%…….
It is strange. Could you explain also this?
Thank you.
Thanks for pointing this out. Our Excel calculation for the SuperTimer did not take into account that Monday 5/27 was a Holiday and erroneously picked Friday’s 5/24 prices. We corrected this and the revised figures are 5.34%, 5.84% and 15.42% for YTD, 1-yr and 3-yr returns.
I’m not able to find the SuperTimer performance chart updated for May. Has it been posted?
Thanks
These models are updated on the first Friday of each month.
Select “Monthly Update”, top RH corner of Home page.
Georg, Anton,
Are you using a (trailing) stop or anything similar on SuperTimer level? Or only on selected underlying timers?
Tnx…
drftr
There are no trailing stops in the SuperTmer.
Sorry-But still confused about the 5 week holding period. You may “look” at it each week BUT there can only be a change every 5 weeks at most . correct?The holding period is a minimum of 5 weeks so no change can be made until after completion of this 5 week period. And the timer is 100% in IEF or 100% in SPY…correct ?
thanks
mets1, you have correctly interpreted the meaning of the 5 week holding period.
The Stock Market Confidence Level is calculated weekly, but the 1-wk SuperTimer can only change from one ETF to the other ETF at most every 5 weeks.
Can you provide annual returns(each year) using the 1 week timer from 2000-2018 please ?
Thanks
They are in this post:
https://imarketsignals.com/2019/im-supertimer-simulated-portfolio-123/
There must be errors in how you calculate the performances of the SuperTimers respect the others instruments in the weekly tables.
If you look for example 1week Supertimer on the table, at 19 and 26 August there is the same value, 10,46%, and this is not possible.
Obviously the 26 August update had a glitch, will investigate with the 9/4 update.
Another glitch on 9/4?
Ok. Isee now you corrected it.
I am having trouble finding the updated graph for the SuperTimer. Could you direct me to the right place?
The SuperTimer graphs get updated monthly.
Top RH on the Home page link is “iM System Performance”
Hi Georg,
Could you pull up the leveraged iM-1wk-SuperTimer (SSO-UST) Sortino ratio for me for the entire back-test period to present day? Thanks in advance. Love your work.
We only have statistics for
Monthly Jan-2000 to Dec-2018
iM-1wk-SuperTimer(SSO-UST)
(based on weekly performance using value of first trading day)
Basic Statistics
CAGR= 37.40%
Max D/D = -19.49%
Annualized Standard Deviation = 20.30%
Sharpe Ratio = 1.63
Sortino Ratio = 2.38
Hi Georg,
Could you pull up the leveraged iM-1wk-SuperTimer (QLD-UST) for the entire back-test period to present day? Thanks in advance. Love your work.
Period … iM-ST … QLD … UST
YTD … 39.3% … 65.0% … 14.6%
1-year … 27.7% … 31.2% … 20.3%
3-year … 37.7% … 38.9% … 5.3%
5-year … 32.0% … 25.9% … 3.8%
10-year … 45.6% … 32.3% … 6.9%
1/3/2000 … 45.7% … -1.3% … 8.2%
max D/D = -32.0%
Hi Georg,
Can you post all trades for the “iM-1wk-SuperTimer”. (Performance for all trades)
Thanks!
Werner
Symbol …. Open …. Close …. Days …. Pct
IEF …. 02/25/2019 …. 04/01/2019 …. 35 …. 1.00%
SPY …. 01/22/2019 …. 02/25/2019 …. 34 …. 6.10%
IEF …. 12/10/2018 …. 01/22/2019 …. 43 …. 0.70%
SPY …. 10/31/2016 …. 12/10/2018 …. 770 …. 23.10%
IEF …. 09/06/2016 …. 10/31/2016 …. 55 …. -1.90%
SPY …. 06/27/2016 …. 09/06/2016 …. 71 …. 9.50%
IEF …. 09/28/2015 …. 06/27/2016 …. 273 …. 5.10%
SPY …. 08/24/2015 …. 09/28/2015 …. 35 …. -1.00%
IEF …. 07/06/2015 …. 08/24/2015 …. 49 …. 2.10%
SPY …. 06/01/2015 …. 07/06/2015 …. 35 …. -2.50%
IEF …. 04/27/2015 …. 06/01/2015 …. 35 …. -2.20%
SPY …. 01/03/2012 …. 04/27/2015 …. 1210 …. 61.70%
IEF …. 09/12/2011 …. 01/03/2012 …. 113 …. -0.10%
SPY …. 08/08/2011 …. 09/12/2011 …. 35 …. 3.70%
IEF …. 06/13/2011 …. 08/08/2011 …. 56 …. 4.50%
SPY …. 06/07/2010 …. 06/13/2011 …. 371 …. 20.40%
IEF …. 05/03/2010 …. 06/07/2010 …. 35 …. 3.90%
SPY …. 02/08/2010 …. 05/03/2010 …. 84 …. 13.40%
IEF …. 01/04/2010 …. 02/08/2010 …. 35 …. 2.00%
SPY …. 03/30/2009 …. 01/04/2010 …. 280 …. 43.10%
IEF …. 10/15/2007 …. 03/30/2009 …. 532 …. 15.20%
SPY …. 09/10/2007 …. 10/15/2007 …. 35 …. 6.10%
IEF …. 07/23/2007 …. 09/10/2007 …. 49 …. 4.40%
SPY …. 10/09/2006 …. 07/23/2007 …. 287 …. 13.70%
IEF …. 09/05/2006 …. 10/09/2006 …. 34 …. 0.80%
SPY …. 07/03/2006 …. 09/05/2006 …. 64 …. 2.80%
IEF …. 05/22/2006 …. 07/03/2006 …. 42 …. -1.10%
SPY …. 04/18/2005 …. 05/22/2006 …. 399 …. 9.80%
IEF …. 02/28/2005 …. 04/18/2005 …. 49 …. 0.50%
SPY …. 10/25/2004 …. 02/28/2005 …. 126 …. 9.60%
IEF …. 09/13/2004 …. 10/25/2004 …. 42 …. 1.10%
SPY …. 08/09/2004 …. 09/13/2004 …. 35 …. 5.80%
IEF …. 06/28/2004 …. 08/09/2004 …. 42 …. 3.10%
SPY …. 05/24/2004 …. 06/28/2004 …. 35 …. 2.70%
IEF …. 04/19/2004 …. 05/24/2004 …. 35 …. -2.60%
SPY …. 09/22/2003 …. 04/19/2004 …. 210 …. 10.70%
IEF …. 08/18/2003 …. 09/22/2003 …. 35 …. 1.70%
SPY …. 06/09/2003 …. 08/18/2003 …. 70 …. 2.10%
IEF …. 05/05/2003 …. 06/09/2003 …. 35 …. 4.10%
SPY …. 03/31/2003 …. 05/05/2003 …. 35 …. 9.60%
IEF …. 11/25/2002 …. 03/31/2003 …. 126 …. 2.50%
SPY …. 10/21/2002 …. 11/25/2002 …. 35 …. 3.50%
IEF …. 06/19/2000 …. 10/21/2002 …. 854 …. 26.60%
SPY …. 04/17/2000 …. 06/19/2000 …. 63 …. 5.30%
IEF …. 01/03/2000 …. 04/17/2000 …. 105 …. 4.00%
it would be interesting to see some modelling that decreased reliance on bonds for bear market condition. a couple of ideas:
A) 1/3 IEF, 1/3 SH, 1/3 GLD
B) 1/4 IEF, 1/4 SH, 1/4 GLD, 1/4 SHY
wondering how that might impact bear market drawdowns.
Tom C
The Vanguard Variable Annuity I have has limited choices. One choice would be the equivalent of Vanguard Wellington (VWELX) for bull mkt, and a bear choice would be the equivalent of Vanguard Total Bond Market Index (BND or VBTLX). Would this produce a reasonable drawdown under this model?
Thanks.
Tom C
to 2/10/20 … iM-ST … VWELX … BND
YTD … 2.7% … 2.7% … 1.9%
1-year … 19.6% … 20.2% … 9.8%
3-year … 10.9% … 10.9% … 4.6%
5-year … 9.8% … 9.1% … 3.2%
10-year … 12.0% … 10.3% … 3.7%
1/3/2000 … 13.9% … 8.1% … 5.0%
Drawdown for this combination is -6.7% with the 1-wk-SuperTimer.
Thanks, that turns out to be a very reasonable combination.
Tom C
Hello,
Do you have an excel sheet available with the Super Timer SMC levels by week?
Thanks,
Tom C
The weekly data can be downloaded here: iM-SMC-weekly
The link doesn’t work anymore. Thank you.
Thanks, link is restored
Can you update the SMC-weekly spreadsheet above to reflect trades in 2020?
Thanks,
Tom C
Download file updated: iM-SMC-weekly
Have you tried the same strategy with qqq?
Thank you
S/
PLEASE updated the MaxDrawdown in https://imarketsignals.com/wp-content/uploads/2020/03/im1wk-st-o210.png. it’s incorrect
Please note the date of the update, Mar-2-2020. The D/D on that date was -8.4%.
The D/D one week later on Mar-9-2020 was -18.8%. This is probably what you are referencing.
Ok i note the date sorry, Can you update the chart with the new MaxDD . Thanks
In trying to minimize drawdowns during blackswan events such as this Coronavirus panic, what would returns and drawdowns look like if you used USMV split 50/50 with a broad Corporate Bond ETF like USIG during risk on periods?
Thanks!
Hello can you post the Max Drawdown updated on Mars 17 for standard iM-1wk-SuperTimer and for 1-wk-SuperTimer 50% SPY + 50% VCIT . Many thanks
For Mar-16: Max D/D
standard iM-1wk-SuperTimer = 29.0%
1-wk-SuperTimer with (50% SPY + 50% VCIT) = 17.2%
Guess the model should have stayed with confidence level of 60% for trigger, would have exited on 3/9.
Hi Anton and Georg,
I just noticed that there was an Appendix 2 on the Super Timer strategy that incorporates this:
Appendix 2 shows that a (50%SPY+50%VCIT)-(IEF) strategy
I was curious how that would pan our for the 3 month Super Timer Strategy in terms of these additional strategies:
50/50 SPY/VCIT – IEF
60/40 SPY/VCIT – IEF
80/20 SPY/VCIT – IEF
Some people like to look at different weighting levels. I wanted to see what the return, risk and draw downs were with doing these approaches on the 3 month super timer.
Thanks.
Bump…
Can you provide historical weekly iM-SMC Level to members?
Please see 12 comments above for the link.
Should the iM-SMC level for 5/11 be 40%? Here’s what I’m seeing:
100% * 1 SH-RSP
100% * 1 Std Mkt
100% * 1 Inflation
100% * 1 Coppock
100% * 0.5 MC-Grader
100% * 0.5 CAPE-Cycle
25% * 1 Combo 3
75% * 0.5 SPY-IEF Mkt Timer Combo
equals 5.625 / 14 = 0.4018
Let me know if I’m missing something. Thanks.
Tom C
Georg and Anton:
Can you share how the performance ytd 6-2-20 for the 1wk model is only down 4.13%? (per performance report)
Your updated graph shows it being down a little more than 30% ytd, which makes sense with the exit on 3/23/20.
thanks
Jeff
Hi Georg and Anton, I just read something interesting on the IEF. “Morningstar will cease qualitative research coverage of iShares 7-10 Year Treasury Bond ETF on or about Jan. 30, 2021, to reallocate our analysts to research other strategies. At that time, the last Morningstar Analyst Rating and this research will be removed. After that date, please discontinue using the research report or former research reports issued by Morningstar on this fund. We recommend users form their own views on this fund or obtain financial advice”
Perhaps the VOO and VGIT would be good alternatives for the SPY and IEF.
In light of your new Yield Curve model, it would be really interesting to see how SuperTimer results would be hedged if you hedged S-T in a way similar to the way you hedged the new Modsum model, esp. in 2020.
Thanks,
Tom C
It is difficult to model the Supertimer with the YieldCurve Timer.
The Timer sold SPY on 9/9/19 and held GLD to 6/29/20 for a gain of 15.6%.
hi George,
could you run the weekly supertimer with 3x leveraged UPRO and TYD please?
thanks
I.