
- Past research suggests that the relative change in the volume of Google searches for financial terms such as “debt” or “stocks” can be used to anticipate stock market trends.
- In this analysis the search term “debt” was used to obtain monthly search volume data from Google Trends.
- The analysis shows, that a decrease in search volume typically preceded price increases of the S&P 500 index, and vice versa.
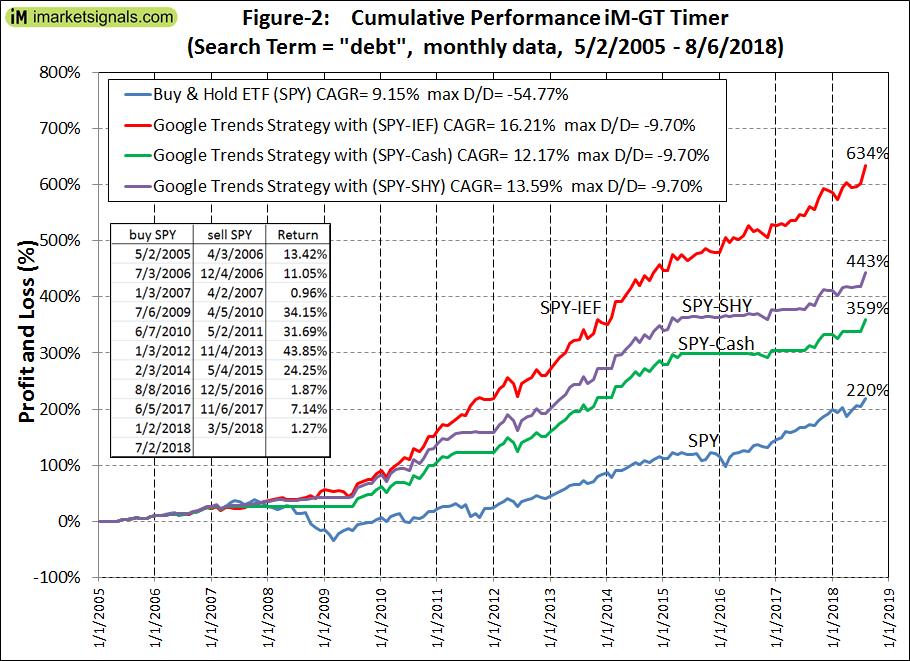
- Switching between ETF (SPY) and ETF (IEF) based on monthly search volume data from 2005 to 2018, would have made a profit of 634% versus 220% for buy-and-hold SPY.
An analysis using the search term “debt” in Google Trends to predict stock market direction was published April 2013 in Scientific Reports. The researchers, by analyzing changes in Google query volumes for search terms related to finance, found patterns that may be interpreted as “early warning signs” of stock market moves. An investment strategy being long or short the Dow Jones Industrial Average based on weekly search volume data for “debt” between 2004 and 2011 would have made a profit of about 326% versus 16% for a buy-and-hold strategy, according to the authors.
Data retrival
Search volume data time series can be downloaded by accessing the Google Trends website as shown in Figure-1. Search volume data change slightly over time, and therefore the average over three search volume time series, based on three data requests in consecutive month, was used.
Figure-1 shows the normalized monthly data from 2004 to 2018.

Method for monthly data
Our analysis is for the period 2005 to 2018 using monthly volume data for the search term “debt” that can be downloaded from Jan-2004 to Aug-2018. We obtain trend changes of the monthly volume data for the search term “debt” by using a moving average cross-over system, a different methodology than that of the researchers of the referenced article who used weekly data.
For falling search volume we buy the stock market using the SPDR S&P 500 ETF (SPY), and for rising search volume we exit the market and go to Cash or buy the iShares 7-10 Year Treasury Bond ETF (IEF).
Google Trends reports monthly volume data “n”at the end of a month (t-1). Therfore this data is available for trading decisions at the beginning of the following month, which is month (t).
- We calculate a moving average of the last three monthly data volumes: MA3= (n(t-1) + n(t-2) ) + n(t-3))/3, where n(t-1) is the volume for the last available month, and n(t-2) is the volume for the second last available month, and n(t-3) is the volume for the third last available month.
- We calculate a moving average MA18 of the data volumes over the last 18 months: MA18= (n(t-1) + n(t-2) + ……… + n(t-18))/18
- For falling search volume MA3 < MA18, we buy the ETF (SPY) at the closing price p(t) on the first trading day of the first week of month (t) and subsequently sell SPY at the closing price p(t+1) on the first trading day of the first week of the next month (t+1).
- For rising search volume MA3 > MA18, we buy ETF (IEF) at the closing price p(t) on the first trading day of the first week of month (t) and subsequently sell ETF(IEF) at the closing price p(t+1) on the first trading day of the first week of the next month (t+1).
If the condition MA3 < MA18, or MA3 > MA18, exists for several successive months then the above method ensures that ETFs (SPY) or (IEF) are held for several months, since the method would sell and buy the same ETF simultaneously if conditions do not change. Our analysis from beginning of May-2005 to beginning of Aug-2018 shows 11 periods holding ETF (SPY) and 10 periods holding ETF (IEF), resulting in very few trades per year.
Performance using monthly data
Figure-2, the iM-GT Timer, shows the model’s profit from 2005 to 2018 for various investment strategies. Over this period the SPY-IEF strategy would have realized a 634% profit, eqivalent to an annualized return of 16.2% with a maximum drawdown of -10% in Jun-2012. Over the same period buy-and-hold ETF (SPY) showed a profit of 220%, which is an annualized return of about 9.2%, and a maximum drawdown of -55%. The SPY-Cash strategy performed better than buy-and-hold ETF (SPY) showing a 359% profit with a maximum drawdown of -10%. Trading costs of 0.05% for each buy- and sell transaction was assumed.
Over the bull-market period Mar-2009 to Aug-2018 the model’s performance closely matched that of buy-and-hold ETF (SPY). The SPY-IEF model’s annualized return would have been 18.0% versus 18.3% for ETF (SPY). For this period the SPY-Cash strategy underperformed ETF(SPY), showing an annualized return of 14.6%.
Conclusion
The backtests suggest that a model based on monthly Google Trends data for the search term “debt” may be usefull to identify weak stock market periods. However, it is unlikely that the model will outperform buy-and-hold during bull-market periods. Currently (end of August 2018) the model holds ETF (SPY) since beginning of July 2018.
It is not suggested that one should trade ETF (SPY) and ETF (IEF) according to this model, however this model may provide early warnings of stock market moves. At iMarketSignals we will provide monthly updates for the SPY-Cash model, which may in conjunction with our other market timing models provide usefull advance information on possible market down-turns.
Hi Georg,
Do you think this measure could be used as a measure of the IMS Composite Timer?
Sorry, please disregard my last – got so exited about it that I didn’t bother reading to the end of the article.
Where can this model be found on iM?
You find it under “Monthly Update”, Figure-9b.
Great strategy! You should also look at “recession”
I really like the SPY-IEF strategy. I’ve spreadsheeted the indicator to take a closer look at the week-by-week gains and drawdowns vs BuyAndHold(SPY). Results look awesome. But, what puzzles me is the way the historical monthly search numbers for DEBT vary from day to day on the 2004-Present results. I had expected the number for past months, like 2018-01, to be fixed. Which day of the month do you capture the GoogleTrends(DEBT) to make your monthly SPY-IEF call?
Thanks for all the great strategies and insights.
We get the search numbers for “debt” at the end of each month. As per model description, the search volume data change slightly over time, and therefore the average over three search volume time series, based on three data requests in consecutive months is used.
Is that mean, for example, at coming 8/31, get the result of google trend (date range :2004 – present). Perform this search 3 times and then average them (e.g. 2018-08 = avg (2018-08 in 1st search , 2018-08 in 2nd search , 2018-08 in 3rd search ). After that, get the SMA3 and SMA18 ?