
- We now simulated the iM-SuperTimer on Portfolio 123 to obtain detailed performance statistics, which we report here.
- For a detailed model description of the system please read the original description, update No.1 and update No.2
- We have transferred the excel data onto Portfolio 123 and will in future be providing signals and performance for the weekly, monthly and 3-month models running on Portfolio 123, all updated weekly.
- The models’ holdings alternate between ETF (SPY) and ETF (IEF), being proxies for investments during up- and down stock market periods.
iM-1wk-SuperTimer (SPY-IEF)
This model reconstitutes weekly and has a specified minimum 5-week holding period of a position. All trades are assumed on the first trading day of the week. All figures are extracted from the Portfolio 123 model and provide simulated data from Jan-2000 to Jun-2019.
Note: There may be a small difference in the generated total return of the excel and P123 model. This is due to the way dividends and trading costs are handled in the calculations.
Figure-1: Simulated past performance.
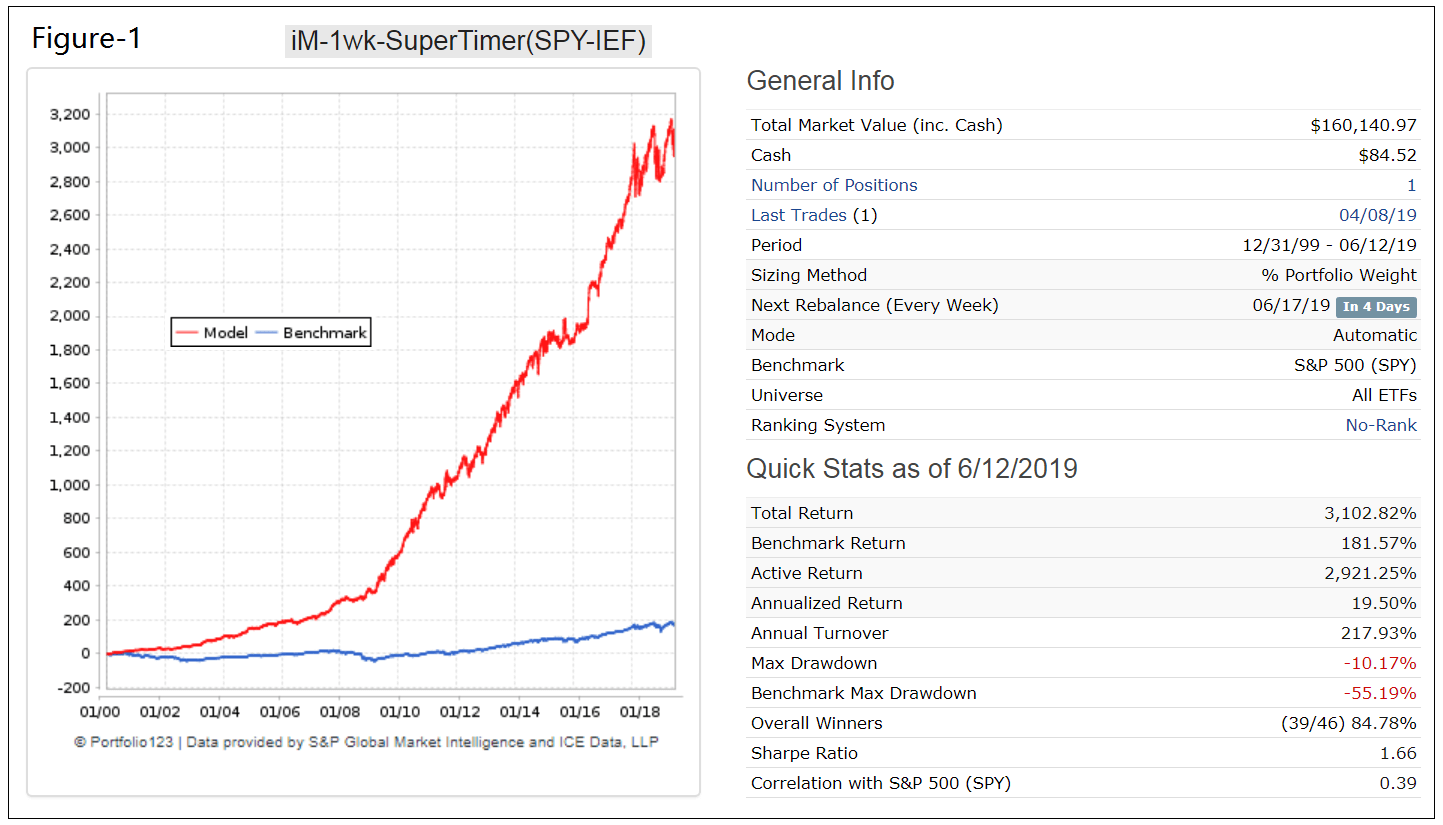
Figure-2: Performance Statistics.
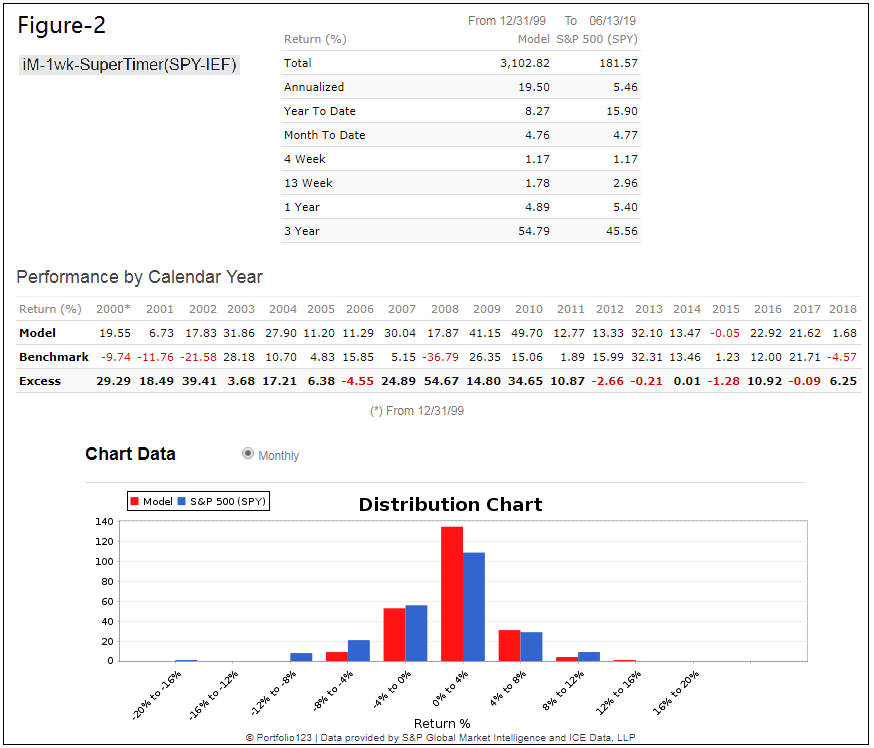
Figure-3: Trading Statistics.
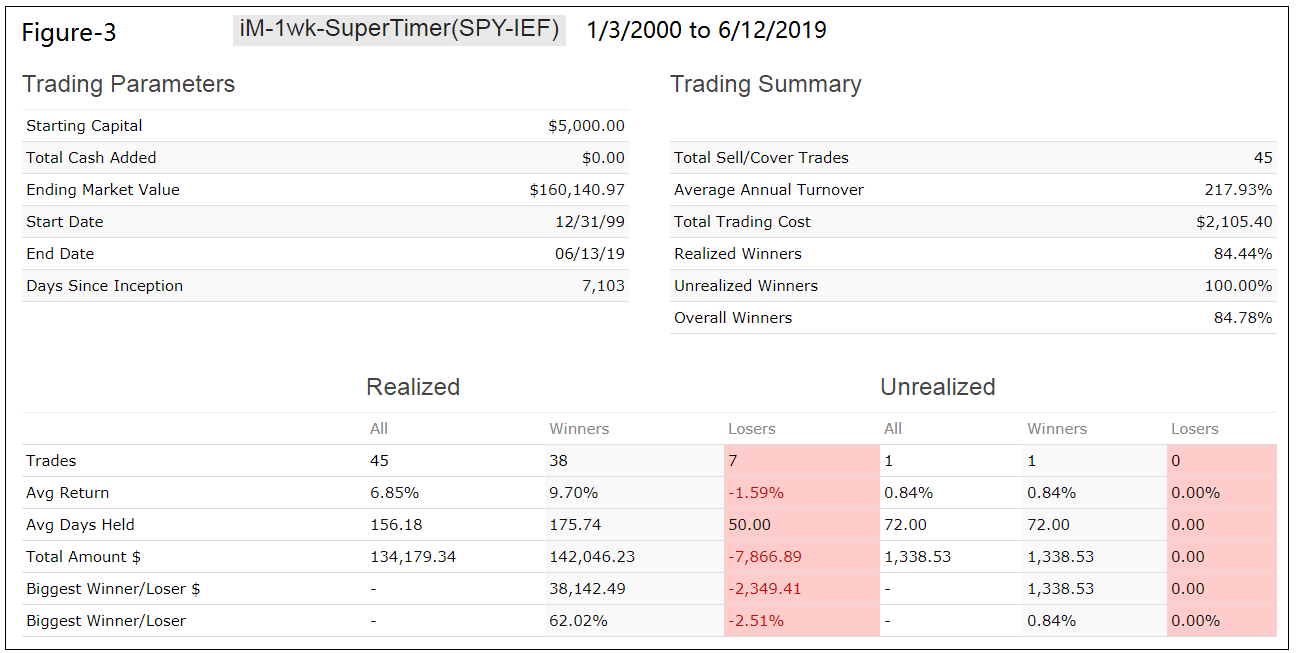
Figure-4: Risk Measurements.
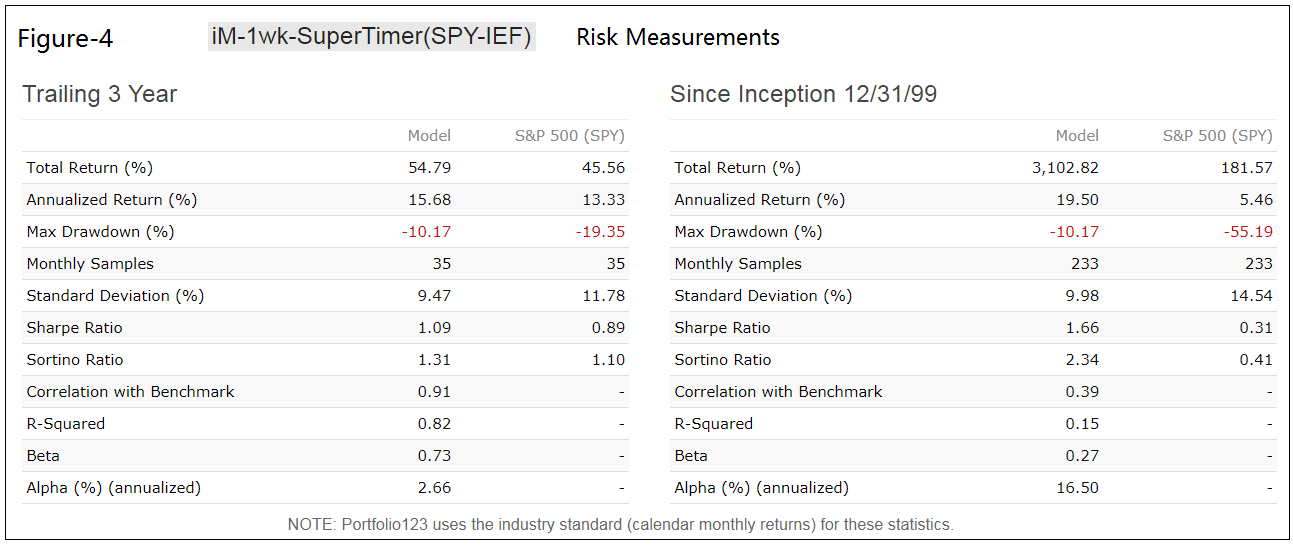
Table-1: Realized Trades,
| Symbol | Open | Close | Days | Pct |
| IEF | 1/3/2000 | 4/17/2000 | 105 | 4.10% |
| SPY | 4/17/2000 | 6/19/2000 | 63 | 5.40% |
| IEF | 6/19/2000 | 10/21/2002 | 854 | 27.10% |
| SPY | 10/21/2002 | 11/25/2002 | 35 | 3.60% |
| IEF | 11/25/2002 | 3/31/2003 | 126 | 2.60% |
| SPY | 3/31/2003 | 5/5/2003 | 35 | 9.70% |
| IEF | 5/5/2003 | 6/9/2003 | 35 | 4.20% |
| SPY | 6/9/2003 | 8/18/2003 | 70 | 2.20% |
| IEF | 8/18/2003 | 9/22/2003 | 35 | 1.80% |
| SPY | 9/22/2003 | 4/19/2004 | 210 | 10.80% |
| IEF | 4/19/2004 | 5/24/2004 | 35 | -2.50% |
| SPY | 5/24/2004 | 6/28/2004 | 35 | 2.80% |
| IEF | 6/28/2004 | 8/9/2004 | 42 | 3.20% |
| SPY | 8/9/2004 | 9/13/2004 | 35 | 5.90% |
| IEF | 9/13/2004 | 10/25/2004 | 42 | 1.20% |
| SPY | 10/25/2004 | 2/28/2005 | 126 | 9.70% |
| IEF | 2/28/2005 | 4/18/2005 | 49 | 0.60% |
| SPY | 4/18/2005 | 5/22/2006 | 399 | 9.90% |
| IEF | 5/22/2006 | 7/3/2006 | 42 | -1.00% |
| SPY | 7/3/2006 | 9/5/2006 | 64 | 2.90% |
| IEF | 9/5/2006 | 10/9/2006 | 34 | 0.90% |
| SPY | 10/9/2006 | 7/23/2007 | 287 | 13.80% |
| IEF | 7/23/2007 | 9/10/2007 | 49 | 4.50% |
| SPY | 9/10/2007 | 10/15/2007 | 35 | 6.20% |
| IEF | 10/15/2007 | 3/30/2009 | 532 | 15.30% |
| SPY | 3/30/2009 | 1/4/2010 | 280 | 43.30% |
| IEF | 1/4/2010 | 2/8/2010 | 35 | 2.10% |
| SPY | 2/8/2010 | 5/3/2010 | 84 | 13.50% |
| IEF | 5/3/2010 | 6/7/2010 | 35 | 4.10% |
| SPY | 6/7/2010 | 6/13/2011 | 371 | 20.60% |
| IEF | 6/13/2011 | 8/8/2011 | 56 | 4.60% |
| SPY | 8/8/2011 | 9/12/2011 | 35 | 3.80% |
| IEF | 9/12/2011 | 1/3/2012 | 113 | 0.00% |
| SPY | 1/3/2012 | 4/27/2015 | 1210 | 62.00% |
| IEF | 4/27/2015 | 6/1/2015 | 35 | -2.10% |
| SPY | 6/1/2015 | 7/6/2015 | 35 | -2.40% |
| IEF | 7/6/2015 | 8/24/2015 | 49 | 2.20% |
| SPY | 8/24/2015 | 9/28/2015 | 35 | -0.90% |
| IEF | 9/28/2015 | 6/27/2016 | 273 | 5.20% |
| SPY | 6/27/2016 | 9/6/2016 | 71 | 9.60% |
| IEF | 9/6/2016 | 10/31/2016 | 55 | -1.80% |
| SPY | 10/31/2016 | 12/10/2018 | 770 | 23.10% |
| IEF | 12/10/2018 | 1/22/2019 | 43 | 0.80% |
| SPY | 1/22/2019 | 2/25/2019 | 34 | 6.20% |
| IEF | 2/25/2019 | 4/1/2019 | 35 | 1.10% |
Disclaimer
The performance data shown represent past performance, which is not a guarantee of future results. Investment returns and portfolio value will fluctuate, and future signals from this model may not be as efficient as they were in the past.
how does this affect iMarketSignal subscribers?
It is a private model, it is not visible to others. We used P123 because it provides good reporting statistics, better than what we can do in excel. It is not available for subscription on P123; only available at iMarketSignals.
oh, i misunderstood. so this is a new simulation of the existing model, you didn’t move the model there. got it, thanks.
Can we access the models on P123 to combine in a book?
We will have to review P123 conditions first.
However, there is nothing preventing you to set up this model yourself on P123. All the trade dates are listed above.
George-How did you come up with a 5 week holding period ? Is this measurement just a result of back testing different time periods(weeks) ?
This facilitates a holding period greater than 30 days, which in many instances is the required holding period of mutual funds. You can follow the Stock Market Confidence Level > 50% as well which results in a min holding period of 1 week.