
- The system uses a composite model consisting of several market timers. It should deliver more reliable signals for profitable stock market investment than single market timing models.
- Component timers are allocated a 100% stock holding percentage when the timer signals investment in the stock market, or 0% when the timer it is out of the stock market.
- A weekly Stock Market Confidence Level (SMC level), which can range from 0% to 100%, is obtained by considering the percentage allocated to each component timer and the timer’s weight in the system.
- The optimal SMC level for stock market investment is found by optimizing a stock-bond model for various SMC levels considering returns and drawdowns relative to buy-and-hold the S&P 500 index.
- A backtest of a combination model of thirteen iMarketSignals timers signaled avoidance of the stock market for SMC levels <=50%, while SMC levels >50% suggest better stock market investment climates.
The Component Market Timing Models
The component market timing models used are shown in Table-1. The table, updated every Sunday at iMarketSignals.com, shows which of the models are invested in stocks or not. Those invested in stocks have a stock holding percentage of 100%, and those out of the stock market of 0%. Combination models are given a holding percentage proportional to their current stock market investments.
An Importance Factor related to the performance of a model is also assigned. The iM-Stock Market Confidence Level (iM-SMC level) is calculated from the stock holding percentages and importance Factors of the 13 models, rounded to the lowest number which is divisible by 5.
| Table-1 iM-Stock Market Confidence Level iM-SMC = 60% . (updated to 1/22/2019) |
|||||
| Update Frequency | Calculation Platform | Backtest from |
iM-Market Timer Model | Model Importance Factor | Stock Holding |
| weekly | P123 | 2000 | Best(SPY-IEF) Market Timer Combo | 0.5 | 50% |
| weekly | P123 | 2000 | Best-Combo3.R1 | 1.0 | 0% |
| weekly | P123 | 2000 | Composite (SPY-IEF) Timer | 2.5 | 100% |
| weekly | P123 | 2000 | Composite (SH-RSP) Timer | 1.0 | 100% |
| weekly | P123 | 2000 | Standard Market Timer | 1.0 | 100% |
| monthly | excel/P123 | 1953 | Inflation Timer | 1.0 | 100% |
| weekly | P123 | 2000 | 3-mo Hi-Lo Index Timer | 1.0 | 0% |
| weekly | P123 | 2000 | Low Frequency Timer | 0.5 | 100% |
| weekly | P123 | 2000 | Market Climate Grader | 1.0 | 25% |
| weekly | excel | 1965 | MAC-US Timer | 1.0 | 0% |
| monthly | excel | 1965 | Coppock Indicator for the S&P500 | 1.0 | 100% |
| monthly | excel | 1950 | CAPE-Cycle-ID | 0.5 | 100% |
| monthly | excel | 2004 | iM-Google Trends | 1.0 | 0% |
The iM-SMC Level and Stock Market Exposure
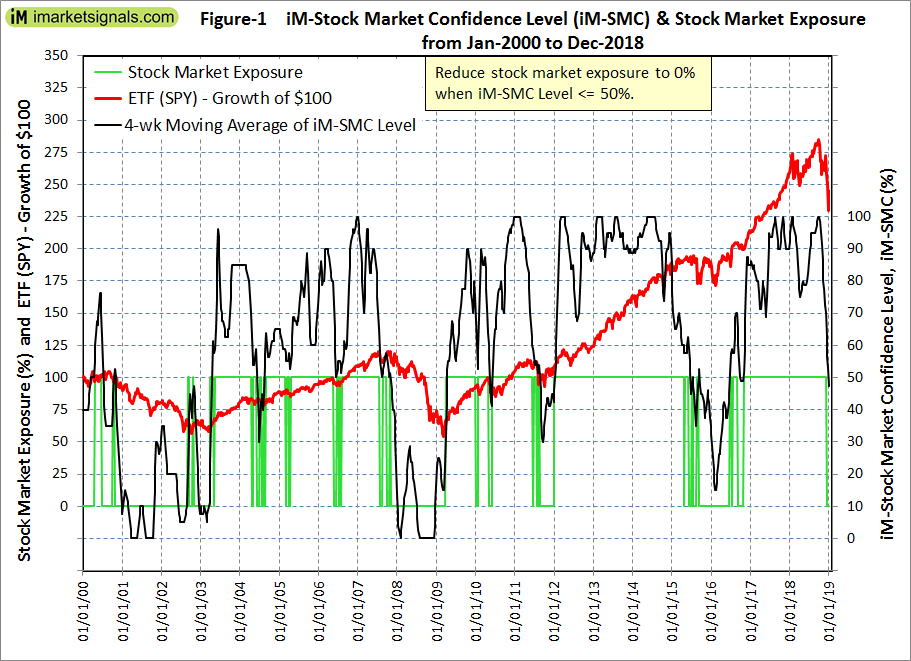
In Figure-1 below the black graph shows a 4-week moving average of the iM-SMC level over the last 19 years, from Jan-2000 to Dec-2018. The red graph depicts performance of the SPDR S&P 500 ETF Trust (SPY). From inspection of Figure-1 it is evident that during down-market periods the iM-SMC level was lower than during up-market periods, reaching 0% in years 2001 and 1998.
The highest optimized return was obtained for a model that holds the stock ETF (SPY) for periods when the iM-SMC level was higher than 50% and invested in the Treasury Bond ETF (IEF) during periods when the iM-SMC level was equal to or less than 50%, the stock market exposure (100% or 0%) being shown by the green graph.
Performance of the iM-SuperTimer
The performance of a SPY-IEF switching strategy which reduces stock market exposure to 0% and switches to bond ETF (IEF) when iM-SMC <=50% is shown in Figure-2. This was modelled in excel and performance includes trading costs of 0.05% of each trade amount.
For the period 1/3/2000 to 1/22/2019 the SPY-IEF model would have produced an annualized return of 18.7% with a max drawdown of about -10%, while the SPY-Cash model would have provided a 14.0% return with the same drawdown. A buy-and-hold strategy of ETF (SPY) had an annualized return of only 5.2% with a maximum drawdown of -55% over the same period.
Since the iM-SMC level is available on Sundays, trading is assumed to occur thereafter on the first trading day of the week, usually a Monday. Trading should not be delayed for more than two days as the model’s annualized return diminishes then.
Trading Day Annualized Return
1st 18.72%
2nd 17.71%
3rd 17.16%
4th 14.98%
5th 14.76%
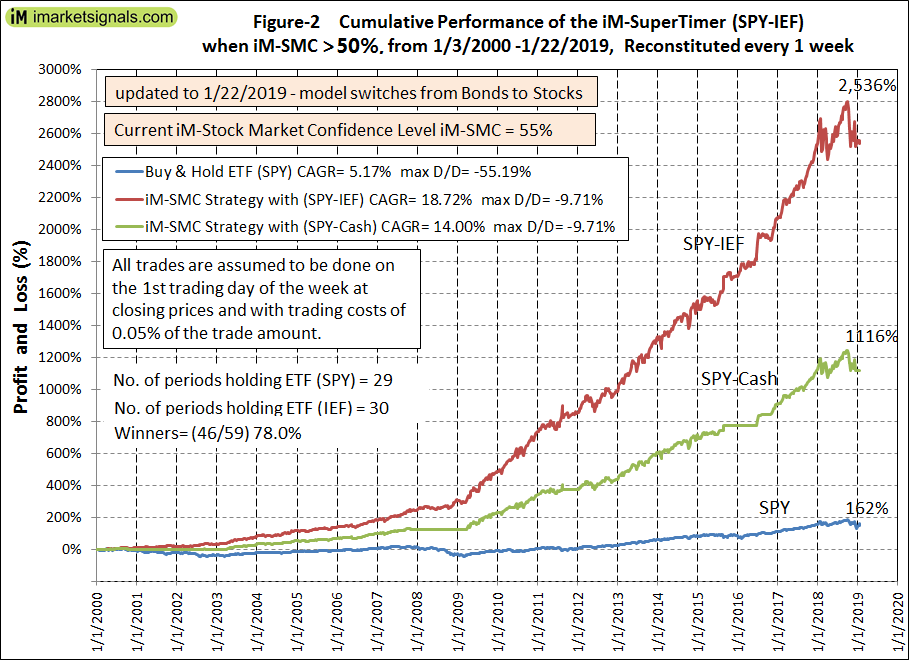
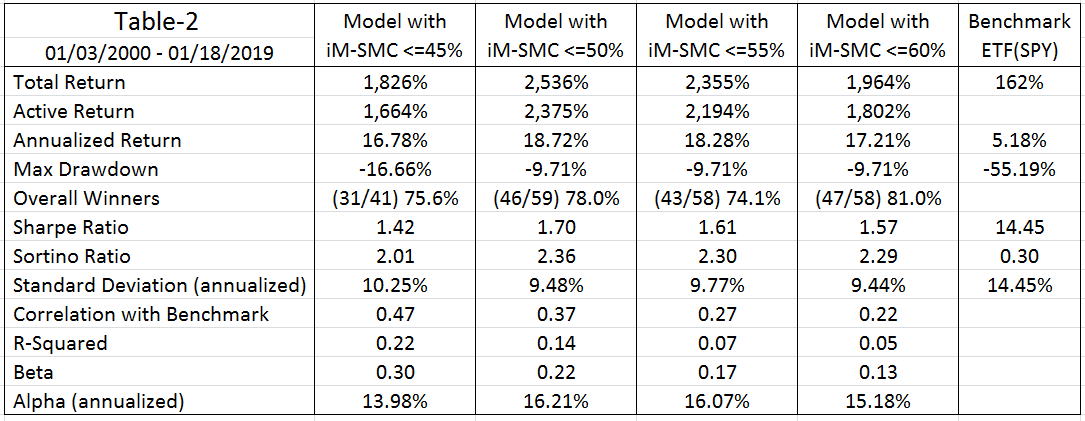
Table-2 lists returns and risk measurement for SPY-IEF models with iM-SMC level criteria ranging from 45% to 60%. All models show annualized returns higher than 16.0%, with the iM-SMC level<=50% producing the best performance.
Trading Frequency
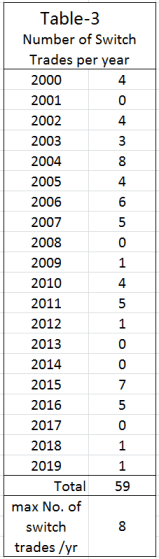
The backtest shows only 59 switch trades. The number of switch trades per calendar year is listed in Table-3 which shows a maximum of eight trades occurring in year 2004.
Holding History can be downloaded here: Super Timer Holding Periods (updated to October 2020)
Conclusion
The backtests suggest that the iM-SuperTimer based on the Stock Market Confidence Level Strategy could provide useful trading signals for stock market investors. Allocation changes are infrequent, with the average holding period of ETF (SPY) and (IEF) being about 22 weeks and 12 weeks, respectively. However, since this model provides weekly signals holding periods can be as short as one week.
At iMarketSignals we have provided weekly updates of the iM-Stock Market Confidence Level for longer than one year now. Also weekly updates of the iM-SuperTimer will be available to Gold members.
Disclaimer
The performance data shown represent past performance, which is not a guarantee of future results. Investment returns and portfolio value will fluctuate, and future signals from this model may not be as efficient as they were in the past.
Appendix
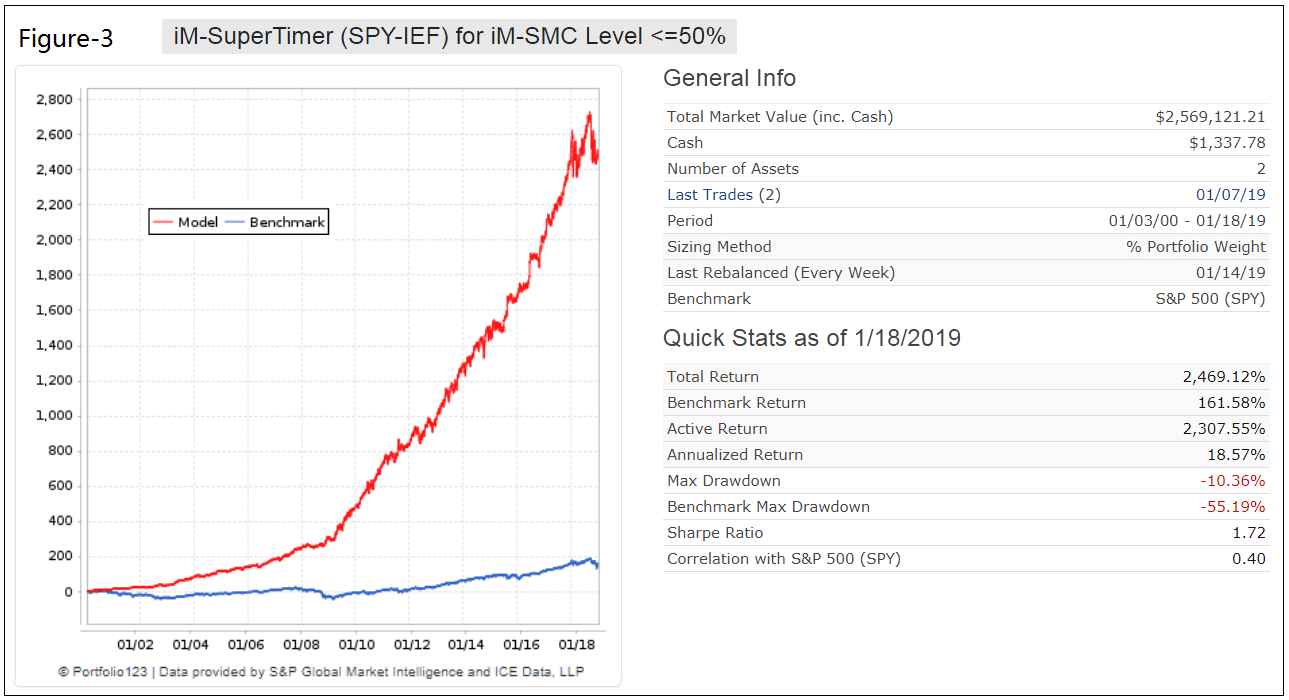
The performance of the iM-SuperTimer (SPY-IEF) can also be modelled on the on-line simulation platform Portfolio 123 using the trading dates from the excel model, and is shown in Figure-3 below. Performance statistics are almost identical to those calculated in excel (Figure-2).
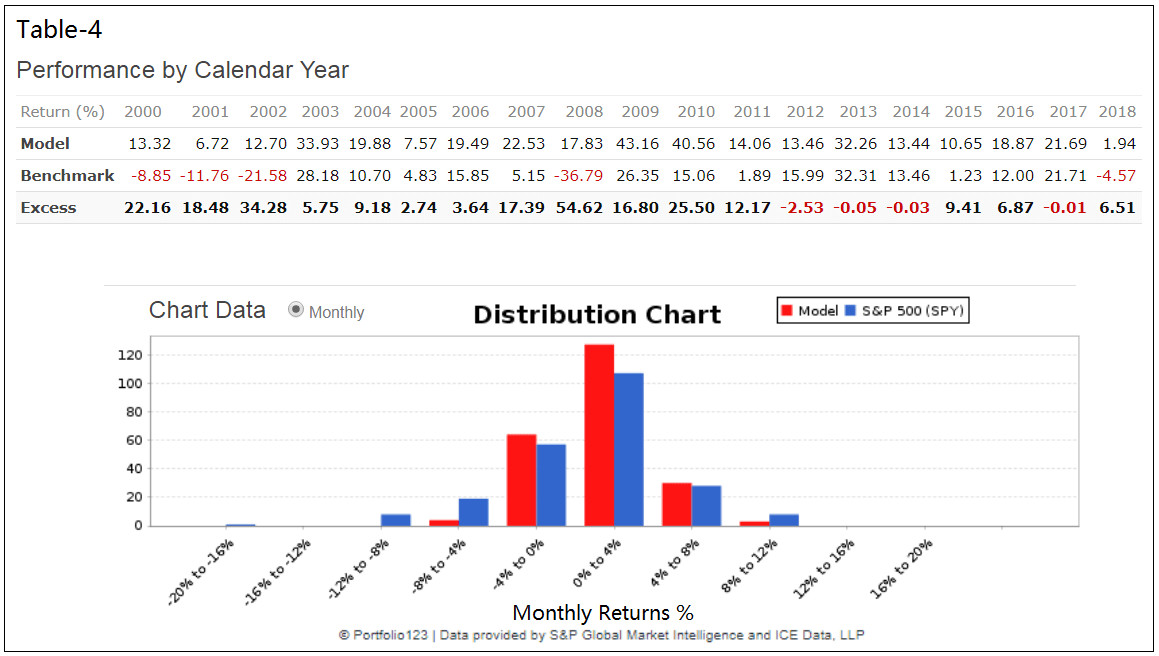
Table-4, extracted from the Portfolio 123 website, shows performance by calendar year and distribution of the monthly returns for the model and benchmark ETF (SPY). The model had no losses for any of the 19 calendar years and only a small under performance for 2012 relative to the benchmark.
It looks great. I imagine it’s not as good with SH instead of IEF?
No, don’t use it with SH, but RSP instead of SPY produces higher returns.
What are the stats for RSP?
With RSP instead of SPY
Total Return …. 3,568%
Active Return …. 3,200%
Annualized Return …. 20.80%
Max Drawdown …. -11.24%
Overall Winners …. (46/59) 78.0%
Sharpe Ratio …. 1.67
Sortino Ratio …. 2.41
Standard Deviation (annualized) …. 10.75%
Correlation with Benchmark …. 0.44
R-Squared …. 0.19
Beta …. 0.26
Alpha (annualized) …. 17.13%
bonjour
et si on prend SLY au lieu de RSP?
They don’t speak French (I do though :-)). This gentleman asked what would be the return with SLY instead of RSP.
Reminds me of
https://www.simplestockmodel.com/composite/
The referenced “simple stock model” uses a similar methodology to our model and is directly comparable with the SuperTimer (SPY-Cash) version.
From beginning of Jan-2000 to end of Dec-2018 he shows a profit of 380% versus our SPY-Cash of 1,117%, or a CAGR of 8.6% versus 14.0%, respectively.
When his composite score is greater than 0.6, the model is invested in SPY. Currently his score is at 0.67, so his model is in SPY.
How does this compare head to head -vs- iM Composite Market Timer (SPY/IEF) ? Especially since it gets a larger percentage in the model.
This model has fewer trades than the iM Composite Market Timer (SPY-IEF). We believe it to be a more robust model.
Can you provide a list of the trades? Thank you!
The link is under Table-3.
Also how come the drawdown is -10% while in 2017 and 2018 Spy dd was -13.52. There was no trade in 2017 and 2018.
Drawdowns are calculated from weekly data, not daily.
Thanks for this.
Question: Is there a SMC level such that if you only invested in SPY when SMC <= x%, CAGR would be negative? (assuming cash otherwise) so in other words a level there would be positive expectancy in an investment in SH (ignoring drawdown).
Thanks.
Tom C
Yes.
Investing in SPY when the SMC level is less than 50% and otherwise in IEF shows negative returns.
for the SPY-Cash model: CAGR= -7.4% with a max D/D of -83.3%,
for the SPY-IEF model: CAGR= -8.1% with a max D/D of -80.5%.
The higher negative return for the SPY-IEF model indicates that IEF does not perform particularly well during stock up-market periods.
Makes sense.
When researching, did you ever attempt to model a variable approach to allocation?
Such as at SMC 100% –> 100% SPY
SMC 90% –> 80% SPY
SMC 80% –> 60% SPY
SMC 70% –> 40% SPY
SMC 60% –> 20% SPY
SMC 50% –> All Cash
SMC 40% –> 20% SH
SMC 30% –> 40% SH
SMC 20% –> 60% SH
SMC 10% –> 80% SH
SMC 0% –> 100% SH
or something like that?
Tom C
Good suggestion, but this is a binary model.
Table 3 shows no trades in 2018, but on excel sheet you show trades for 2018, Why not on table 3?
Thank you for reporting this. Table-3 has now been corrected.
Looks like a typo in Table-1. It says (updated to 1/22/2018). I think this should be 1/22/2019.
“Also weekly updates of the iM-SuperTimer will be available to Gold members.” I am interested. When do you expect this to be available?
As of today, Sunday 1/27/2019, you can see the Stock Market Confidence level using all the 13 component models. Down-market conditions and investment in IEF are signaled when the Stock Market Confidence level is equal to or less than 50%.
Just subscribed to the Gold membership but I can’t find Stock Market Confidence level on the website anywhere. Can you point me to where it is located?
Never mind I found it.
Since data for the standard composite timer only goes to 2016, can you update that and compare to the new super timer??? Which one produces the highest returns and lowest drawdowns as of today??? Thanks!
if you go the standard composite page you can see the results before 2016…
https://imarketsignals.com/2016/composite-market-timing-increases-returns-and-reduces-drawdown/
I actually meant AFTER 2016! (for the composite timer)
this? https://imarketsignals.com/wp-content/uploads/2019/01/fig21-imc-sh-rsp-1-29-2019.png
In the link under table 3 it shows stock market conditions.
what are the actual dates of the trade or how does one figure trade dates?
Thank You
The actual trade dates are the beginning and end of the period dates.
Can you update table 3 to show the results for each holding period please.
would also be interesting to see the simulation results of replacing IEF with whatever the current bond choice would be in the SSO-Bond model.
Tom C
Is the price data for IEF prior to 7/30/02 simulated? If so how?
Yes. We use Portfolio 123 data which reconstructs daily prices for IEF prior to its inception date from its proxy, BofA Merrill Lynch 7-10 years US Treasury Index, back to 12/28/1994.
Will you add this model to the “Out of sample performance summary”?
The math is terribly wrong…the composite timer is at 50 and should be 100 % in the market..this changes everything !!!
Please be more specific. The composite timer will be at 37.5 on Monday, and the Coppock is out of the market.
the composite timer in e-mail shows TED OUT i.e. stock holding 0 comp timer sells spy/ buys ief
on website comp timer shows TED IN but is showing stock holding 0 sell spy and buy ief. shouldn’t the model be 100% stock holding if the TED is IN ?
Is comp timer 100% stock with TED IN
or comp timer 0% stock with TED OUT?
concerning Stock Market Confidence Level
e-mail is showing =30% buys ief
SMC sell signal with the 0% composite stock holding
website shows SMC = 35% buys ief
SMC sell signal with 0% composite stock holding
but wouldn’t the SMC be in a buy signal with 100% comp stock holding if the TED was in?
thank you
On Feb 3, 2019 the iM-Composite Timer signaled sell SPY buy IEF as the TED component timer switched to out-of-market. This was communicated in our Sunday email. On the website the iM-Composite Timer’s transaction SPY-IEF was signaled correctly but the component timer TED signaled the switch, but incorrectly remained in-market. The website is now corrected and shows TED as out-of-market.
You guys do brilliant work and I’ve been a satisfied customer for a number of years, but the discrepancies between the emails and the web page can be disconcerting when real money is involved. I think this is especially true lately as the modeling has become more sophisticated.
Georg,
we appreciate you clarifying the conflict between email and website
also since the iM-SuperTimer has fewer trades and is a more robust model than Composite Timer (SPY-IEF),
will you be adding this model to the “Out of sample performance summary”?
thanks
Yes, we will be reporting performance. Since this model is not fully automated we will post end of month reports, not weekly.
Hi there,
I don’t see the end of month reports for the super timer. Where is it?
Thank you!
We are still deciding on the best presentation of the SuperTimer’s performance.
So can we expect a performance report at the end of March?
Bonjour et si on prend un QLD ou DDm a la place de SPY
on double la perf et la perte?
ou resultat différant?
merci
Non le résultat sera différent. Tu doubles la perf si tu prends SSO. QLD et DDM sont plus volatiles donc tu peux avoir de meilleurs résultats à certain moment mais tu vas avoir de grosses oscillations. Je suis conseiller financier à SF et j’utilise leur modeles pour mon business.
SF=San Francisco
Georg and Anton,
For those of us trading in tax deferred accounts, could you run the 60:40/20:80 Flip Saver using the holding periods from the Super Timer?
Thanks for your help,
Jon
To clarify, is the Super Timer only available to Gold? I see it has been published through Feb 10th to other subscribers as well?
Thank you for the comment. There was a code error which will be fixed.
Hello George,
Interested to understand a bit better what you see driving the signals recently, most market timing models are exiting stocks. Risk Premium is high, Vix is moderate-to-low, so that leaves S&P Price and Current Earnings estimates as the drivers. Current Earnings estimates have fallen over 5% from the high at end of Q2 2018. Is that the primary reason for the shift to SH or cash or IEF in the models? Any added insight you can provide is much appreciated.
John
John,
There are 23 component models (including combo models and sub-models in the Composite Market Timer) which contribute to the SMC-Level. Each of these models perform better than buy-and-hold stocks.
To answer your question we would have to analyze each of these models and prepare a report for each of them to explain why they are either in- or out of the stock market.
So we don’t have an informed opinion why the SuperTimer is out of the market.
Thank you Georg,
Would you be able to expand a bit about your opinions on SPY-SH.R1 and/or SSO-Bond.R1?
Many thanks!
John
Hi George,
Nice work. Have you tested how the Super Timer would work on either a weekly or monthly basis by adjusting the percentage to be invested in SPY vs. IEF by adjusting the amount invested in SPY = to the same iM-SMC percentage score? For example, if the SMC is 65%, then 65% of the account would be invested in SPY and 35% in IEF or similar bond fund. If the SMC would change to 55%, then the SPY allocation would be reduced to 55% and IEF increased to 45%, etc. At first blush, this would seem to smooth the volatility and would be suitable for those with a conservative account.
No, we have not tested this. The method you propose would lead to an enormous amount of trading, because one would have to adjust holdings whenever the SMC-level changes.
We will soon post a retirement fund model for conservative accounts which holds stocks and bonds in different proportions for up- and down-market periods, and only looks at the SMC-level every 4 weeks, or 13 weeks, or 26 weeks for very little trading.
Re. Super Timer: any reason that Combo3 and MC Grader are not at 33% instead of 25%? Looks like there are 4 posssible outcomes for both, so the outcomes would be 0 / 33 / 67 / 100.
Tom C
In Combo3 the SSO-TLT model has a weight of 50%, and the other two have a weight of 25% each.
The MC Grader has 4 component models, so percentage in stocks could be 0%, 25%, 50%, 75% and 100%. Zone-1 includes 75% and 100%, Zone-2 is for 50%, Zone-3 is for 25% and Zone-4 is for 0% in stocks.
So if Zone 1 includes 75% and 100%, how do you decide whether Super timer weight will be 75 or 100% when you’re in Zone 1?
Tom C
When Grader is in Zone-1, then its weight is 100% in the SuperTimer.
So, shouldn’t that be the case today (Sunday 3/3). I see a change in Super Timer Weight to 75%, but wouldn’t that carry a weight in the Super Timer of 100% (I assume the change is that we move from Zone 2 to Zone 1) ?
Thanks.
Tom C
Tom, you are correct – weight is now 100% in the SuperTimer, not 75%.
Thanks.
My previous reply applies to the Grader only. For the SuperTimer we are using the actual percentage of stock holdings, which currently is 75%.
I guess I’m confused. Does that mean we’re not in zone 1? There are four possible zones for the grader, as I read it (PPP, NPP, NNP, and NNN). But if you have 0, 25, 50, 75, and 100 that would imply five possible states, right? Seems like if you were differentiating all four states it would be 0/33/67/100.
Tom C
The Grader is in Zone-1, because 100% and 75% in stocks is considered Zone-1 in the Grader model.
In the SuperTimer we use the actual percentage. 75% as of last Monday, Mar-4-2019.
OK, I can see that making sense for the MC Grader. But in combo 3, it’s 1/3 1/3 1/3 (SSO-Bond, SPY-SH, and Sector-SH). It’s the SPY-IEF market timer that has the 50/25/25 right (it’s a different set – 50% SSO/Bond, 25% SPY-SH, 25% based on the other moving average system). Let me know if I am misunderstanding this.
Thanks.
Tom C
For the weight allocation in the SMC-Level the SSO-Bond model has a weight of 50% because of the 2x leverage of SSO. Assume all 3 component models of Combo3 are in stocks, then SSO will contribute 50% and not 33% to the performance of Combo3.
Yes, that makes sense. Thanks!!
Tom C
George,
Can you please explain the difference between the Market Climate Grader used in the Super Timer and the MC Score used in the Composite Timer?
Market Climate Grader is described here:
https://imarketsignals.com/2015/assessing-market-climate-with-ims-market-climate-grader/
This model uses four SPY-Cash models, each with a weight of 25% when in SPY.
MC-Score is described here:
https://imarketsignals.com/2016/etf-investing-according-to-market-climate-with-the-im-best2-mc-score-system/
Georg,
Thanks for the links…..I had already read both and was prompted to ask the question because the description of the Market Climate Grader inputs was pretty skimpy vs the MC-Score. I’m just trying to understand what component of the former caused it to re-enter the market, while the later, at least as indicated by the Composite Timer, is still out of the market.
Thanks
Thanks for the great work. I am a very happy subscriber. Have you looked at results using SSO and UST instead of SPY and IEF? In other words levering up a bit? Best!
Backtest with 2x leveraged ETFs UST and SSO from Jan-2000 to Mar-2019:
1-wk SuperTimer: CAGR= 35.5%, max D/D= -19.6%
4-wk SuperTimer: CAGR= 29.3%, max D/D= -23.4%
You have also tested a 4 week and a 13 week holding period with less trades, when will you have those charts posted?
The SuperTimer charts will be posted with our monthly updates.
impressed that it was out of the market on 12/10/18.
Hi George,
any chance we can get an update of the holding history of the Super Timer Holding Periods (previously downloadable below Table 3)?
The download file is updated: Super Timer Holding Periods (updated to October 2020)
Dear Anton
any chance we can get an update of the holding history of the Super Timer Holding Periods?
hi George and Anton,
could one use UPRO/TYD instead of SPY/IEF for higher returns?
thanks
UPRO and TYD are triple leveraged ETFs which could produce higher returns with much higher risk.
Hi George , Anton
any chance we can get an update of the holding history of the Super Timer Holding Periods (previously downloadable below Table 3)?
The holding history in the excel file under Table-3 is still current. The model switched to up-market on 6/15/2020 and there are no further signals since then.
Hello
How would IM 1 week Super Timer perform if holding IM Top 5 QQQ when long (rather than SPY) and IEF when out of stocks.
Thanks