
- The market environment for investment returns is divided into four climate zones.
- Market climate zones were determined by combining fundamental and technical indicators.
- A performance analysis of SPY shows that the probability of stock market gains is highest for climate Zone-1 and lowest for Zone-4.
(The iM-MCGrader up-rated the market climate on 9/6/15 to zone-1 positive)
Component of the Market Climate Grader
The Market Climate Grader combines volatility, risk premium, earnings estimates, and market mood together with moving average cross-overs to zone the market climate.
This model grades the market into four zones:
- Zone-1: PPP (positive)
- Zone-2: NPP (neutral-positive)
- Zone-3: NNP (neutral-negative)
- Zone-4: NNN (negative)
Market Climate Zones
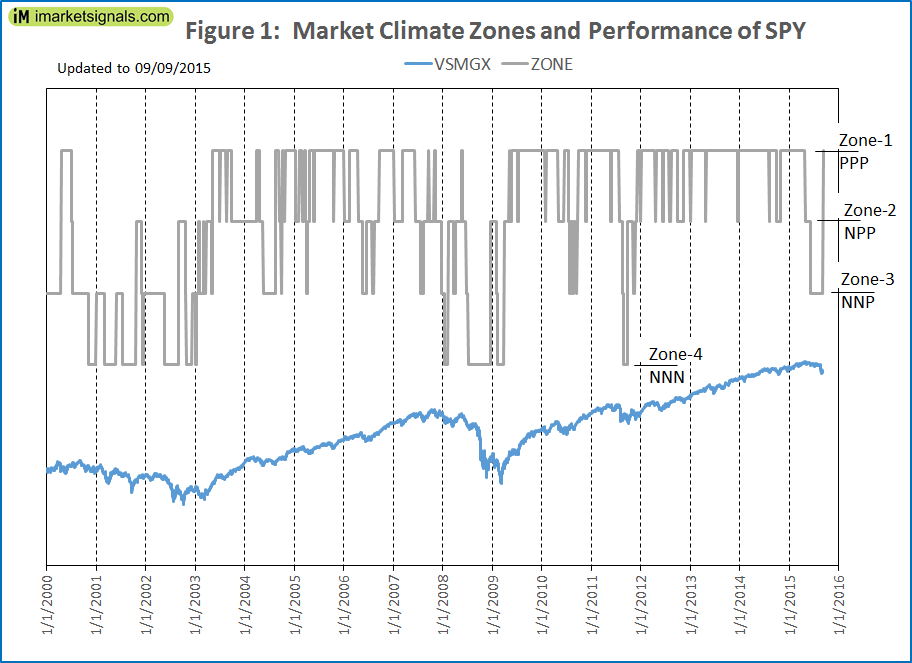
Figure-1 shows performance of SPY and depicts the market climate zones as determined by our market climate grader. From the figure it is evident that during up-market periods Zone-1 prevailed most of the time, while during down-markets Zone-3 and Zone-4 were more often present.
Performance Analysis of SPY
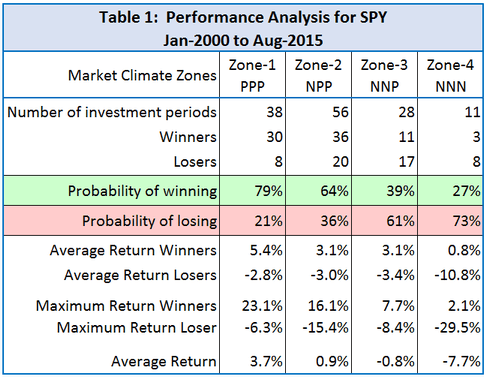
Table-1 provides statistical evidence of past performance of SPY over the investment periods of the various zones. From the number of winners and losers, as well as average return, it is evident that the odds of winning are higher when being long in the stock market during market climate Zone-1 and Zone-2, and being short or neutral during Zone-3 or Zone-4.
Current Market Climate
On 9/6/2015 the market climate was upgraded to PPP (positive). Statistically seen, from past performance, this zone has a 79% probability to return positive results.
The immediate past was defined by Zone-3, which is NNP or neutral negative. According to historical performance, there is a 60% probability that SPY loses value over this period, indeed SPY recorded a loss of 7.14% (6/8/2015 to 9/4/15).
Investing according to Market Climate Zones
To achieve better returns one should adjust one’s investments according to market climate. In a follow-up article we will provide simulation results for various asset allocations.
Following the Market Climate Grader
This model is updated weekly at our website imarketsignals.com.
Past Signals
Table-2: Market Climate Zones from Jan-2000 |
||||
| (Updated to 09/08/2015) | ||||
No. |
Begin Date |
Market Climate Zone |
Duration (weeks) |
|
| 1 | 1/3/2000 | 3 | NNP | 15 |
| 2 | 4/17/2000 | 1 | PPP | 11 |
| 3 | 7/3/2000 | 2 | NPP | 1 |
| 4 | 7/10/2000 | 3 | NNP | 17 |
| 5 | 11/6/2000 | 4 | NNN | 9 |
| 6 | 1/2/2001 | 3 | NNP | 9 |
| 7 | 3/5/2001 | 4 | NNN | 13 |
| 8 | 5/29/2001 | 3 | NNP | 7 |
| 9 | 7/16/2001 | 4 | NNN | 14 |
| 10 | 10/22/2001 | 2 | NPP | 6 |
| 11 | 12/3/2001 | 3 | NNP | 1 |
| 12 | 12/10/2001 | 4 | NNN | 1 |
| 13 | 12/17/2001 | 3 | NNP | 22 |
| 14 | 5/20/2002 | 4 | NNN | 16 |
| 15 | 9/3/2002 | 2 | NPP | 7 |
| 16 | 10/21/2002 | 3 | NNP | 1 |
| 17 | 10/28/2002 | 4 | NNN | 6 |
| 18 | 12/9/2002 | 3 | NNP | 4 |
| 19 | 1/6/2003 | 4 | NNN | 1 |
| 20 | 1/13/2003 | 3 | NNP | 2 |
| 21 | 1/27/2003 | 2 | NPP | 1 |
| 22 | 2/3/2003 | 3 | NNP | 4 |
| 23 | 3/3/2003 | 2 | NPP | 1 |
| 24 | 3/10/2003 | 3 | NNP | 2 |
| 25 | 3/24/2003 | 2 | NPP | 6 |
| 26 | 5/5/2003 | 3 | NNP | 1 |
| 27 | 5/12/2003 | 1 | PPP | 7 |
| 28 | 6/30/2003 | 2 | NPP | 1 |
| 29 | 7/7/2003 | 1 | PPP | 6 |
| 30 | 8/18/2003 | 2 | NPP | 1 |
| 31 | 8/25/2003 | 1 | PPP | 5 |
| 32 | 9/29/2003 | 2 | NPP | 26 |
| 33 | 3/29/2004 | 1 | PPP | 3 |
| 34 | 4/19/2004 | 2 | NPP | 4 |
| 35 | 5/17/2004 | 3 | NNP | 13 |
| 36 | 8/16/2004 | 1 | PPP | 4 |
| 37 | 9/13/2004 | 2 | NPP | 2 |
| 38 | 9/27/2004 | 3 | NNP | 1 |
| 39 | 10/4/2004 | 1 | PPP | 2 |
| 40 | 10/18/2004 | 2 | NPP | 1 |
| 41 | 10/25/2004 | 1 | PPP | 11 |
| 42 | 1/10/2005 | 2 | NPP | 4 |
| 43 | 2/7/2005 | 1 | PPP | 3 |
| 44 | 2/28/2005 | 2 | NPP | 2 |
| 45 | 3/14/2005 | 1 | PPP | 2 |
| 46 | 3/28/2005 | 2 | NPP | 1 |
| 47 | 4/4/2005 | 3 | NNP | 1 |
| 48 | 4/11/2005 | 2 | NPP | 2 |
| 49 | 4/25/2005 | 1 | PPP | 4 |
| 50 | 5/23/2005 | 2 | NPP | 2 |
| 51 | 5/31/2005 | 1 | PPP | 20 |
| 52 | 10/17/2005 | 2 | NPP | 1 |
| 53 | 10/24/2005 | 1 | PPP | 11 |
| 54 | 1/3/2006 | 2 | NPP | 6 |
| 55 | 2/13/2006 | 1 | PPP | 9 |
| 56 | 4/17/2006 | 2 | NPP | 5 |
| 57 | 5/22/2006 | 3 | NNP | 4 |
| 58 | 6/19/2006 | 2 | NPP | 6 |
| 59 | 7/31/2006 | 3 | NNP | 2 |
| 60 | 8/14/2006 | 2 | NPP | 5 |
| 61 | 9/18/2006 | 1 | PPP | 16 |
| 62 | 1/8/2007 | 2 | NPP | 9 |
| 63 | 3/12/2007 | 1 | PPP | 13 |
| 64 | 6/11/2007 | 2 | NPP | 6 |
| 65 | 7/23/2007 | 3 | NNP | 3 |
| 66 | 8/13/2007 | 2 | NPP | 5 |
| 67 | 9/17/2007 | 1 | PPP | 1 |
| 68 | 9/24/2007 | 2 | NPP | 5 |
| 69 | 10/29/2007 | 1 | PPP | 2 |
| 70 | 11/12/2007 | 2 | NPP | 6 |
| 71 | 12/24/2007 | 3 | NNP | 3 |
| 72 | 1/14/2008 | 4 | NNN | 4 |
| 73 | 2/11/2008 | 2 | NPP | 6 |
| 74 | 3/24/2008 | 3 | NNP | 2 |
| 75 | 4/7/2008 | 2 | NPP | 6 |
| 76 | 5/19/2008 | 1 | PPP | 2 |
| 77 | 5/27/2008 | 2 | NPP | 4 |
| 78 | 6/23/2008 | 3 | NNP | 2 |
| 79 | 7/7/2008 | 4 | NNN | 24 |
| 80 | 12/22/2008 | 2 | NPP | 6 |
| 81 | 2/2/2009 | 3 | NNP | 1 |
| 82 | 2/9/2009 | 4 | NNN | 7 |
| 83 | 3/30/2009 | 2 | NPP | 5 |
| 84 | 5/4/2009 | 1 | PPP | 1 |
| 85 | 5/11/2009 | 2 | NPP | 3 |
| 86 | 5/26/2009 | 1 | PPP | 6 |
| 87 | 7/6/2009 | 2 | NPP | 1 |
| 88 | 7/13/2009 | 1 | PPP | 28 |
| 89 | 1/25/2010 | 2 | NPP | 1 |
| 90 | 2/1/2010 | 1 | PPP | 13 |
| 91 | 5/3/2010 | 2 | NPP | 6 |
| 92 | 6/14/2010 | 1 | PPP | 5 |
| 93 | 7/19/2010 | 2 | NPP | 1 |
| 94 | 7/26/2010 | 3 | NNP | 1 |
| 95 | 8/2/2010 | 2 | NPP | 2 |
| 96 | 8/16/2010 | 3 | NNP | 1 |
| 97 | 8/23/2010 | 2 | NPP | 3 |
| 98 | 9/13/2010 | 3 | NNP | 1 |
| 99 | 9/20/2010 | 2 | NPP | 1 |
| 100 | 9/27/2010 | 1 | PPP | 8 |
| 101 | 11/22/2010 | 2 | NPP | 1 |
| 102 | 11/29/2010 | 1 | PPP | 25 |
| 103 | 5/23/2011 | 2 | NPP | 2 |
| 104 | 5/31/2011 | 1 | PPP | 8 |
| 105 | 7/25/2011 | 2 | NPP | 4 |
| 106 | 8/22/2011 | 3 | NNP | 1 |
| 107 | 8/29/2011 | 4 | NNN | 4 |
| 108 | 9/26/2011 | 2 | NPP | 6 |
| 109 | 11/7/2011 | 3 | NNP | 2 |
| 110 | 11/21/2011 | 2 | NPP | 2 |
| 111 | 12/5/2011 | 1 | PPP | 4 |
| 112 | 12/27/2011 | 2 | NPP | 1 |
| 113 | 1/3/2012 | 1 | PPP | 15 |
| 114 | 4/16/2012 | 2 | NPP | 1 |
| 115 | 4/23/2012 | 1 | PPP | 7 |
| 116 | 6/11/2012 | 2 | NPP | 1 |
| 117 | 6/18/2012 | 1 | PPP | 6 |
| 118 | 7/30/2012 | 2 | NPP | 2 |
| 119 | 8/13/2012 | 1 | PPP | 7 |
| 120 | 10/1/2012 | 2 | NPP | 6 |
| 121 | 11/12/2012 | 1 | PPP | 7 |
| 122 | 12/31/2012 | 2 | NPP | 1 |
| 123 | 1/7/2013 | 1 | PPP | 15 |
| 124 | 4/22/2013 | 2 | NPP | 1 |
| 125 | 4/29/2013 | 1 | PPP | 33 |
| 126 | 12/16/2013 | 2 | NPP | 1 |
| 127 | 12/23/2013 | 1 | PPP | 32 |
| 128 | 8/4/2014 | 2 | NPP | 1 |
| 129 | 8/11/2014 | 1 | PPP | 7 |
| 130 | 9/29/2014 | 2 | NPP | 4 |
| 131 | 10/27/2014 | 1 | PPP | 26 |
| 132 | 4/27/2015 | 2 | NPP | 6 |
| 133 | 6/8/2015 | 3 | NNP | 14 |
| 134 | 9/8/2015 | 1 | PPP | — |
Disclaimer
One should be aware that most of the results shown are from a simulation. Out-of-sample performance of the component models is relatively short. This timing model is presented for informational and educational purposes only and shall not be construed as advice to invest in any assets. Out-of-sample performance may be much different. Backtesting results should be interpreted in light of differences between simulated performance and actual trading, and an understanding that past performance is no guarantee of future results. All investors should make investment choices based upon their own analysis of the asset, its expected returns and risks, or consult a financial adviser.
Your studies and presentations are fantastic. They boggle my mind, for I have been doing similar work by myself for about 40 years. Would like to get together at some point. Nice to find a friend.
I am looking forward to your next article on how to apply this. Can you provide the average period for each zone? Also, specifically thinking about zone 3… if one is invested in say, one of your models that in those kind of down markets beats the S&P 500 by more than -0.8%, then that would suggest staying invested would still be favorable. Or am I missing something?
Thanks for this.
Great work (very timely for me because I was in the process of trying to combine your various timing tools). One other thing: would it be possible to include a table version of the graph (date of change, zone number).
Tom C
Also, what was the average length of time in a zone once that zone was entered?
A. First Para states “The iM-MCGrader up-rated the market climate on 9/6/15 to zone-1 positive” In Current Market Climate states”On 9/3/2015 the market climate was upgraded to PPP (positive”. So, did the model get updated on imarketsignals.com on 6th or on 3rd
B. Above its stated “This model is updated weekly at our website imarketsignals.com”. Is there any specific day of the week it gets updated?
Thanks for pointing out the typo.
We will be updating the iM-MCGrader every Sunday.
Out of curiosity, how does this differ from the SPY-IEF gradual market timer? Are these based on exactly the same models or is this model adding new information?
Although we use our tried and tested algorithms new information is added in the evaluation. We now published the iM-MCGrader past signals in Table 2 above and comparing these to our other systems you will note the differences straight away.
Is it suggested in this model that one should be invested in SPY when the indicator is in Zone-1 and cash at all other times?
When the Grader is in Zone-1 then the probability of stock market gains is highest. For a stock-cash model Zone-1 signals holding stocks and for all other zones hold cash.
Georg,
Is any of the fundamental data subject to revisions?
Thanks
i’m having trouble understanding something…
as of today (9-28-16), this signal is at PPP, which is the highest ranking for equity markets, but the SPY-IEF indicator is at 25% for SPY. how do these two relate to each other? thanks
Those two models are not related to each other. If all the models would always signal the same, then one would really only have one model.
Is this Grader now integrated into your trading systems signals? If not, how do I use it with your trading systems?
The Market Climate Grader, as it name implies, seeks to indicate market risk. It is not a trading model on its own.
It is not incorporated in any of the trading models. Our Composite Timer model is probably more suitable to determine whether to be in stocks or bonds.
What zone is the Market Climate Grader in right now?
Tom C
Zone 3, NNP
Where do i find this