
Unemployment
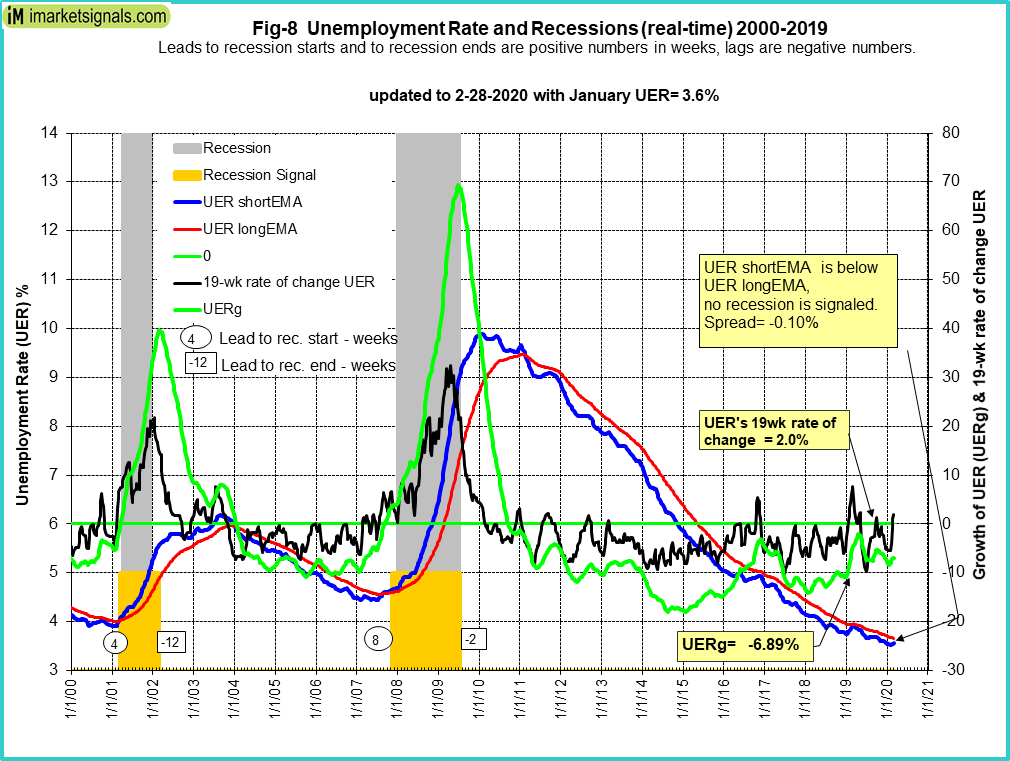 The unemployment rate recession model (article link), has been updated with the January UER of 3.6%. The model does not signal a recession.
Here is the link to the full update.
The Dynamic Linearly Detrended Enhanced Aggregate Spread:
This update is discontinued and replaced by our weekly updated iM-LLI.
CAPE-Cycle-ID
 Fig 9a depicts the CAPE-Cycle-ID and the year-on-year rate-of-change of the Shiller CAPE; the level switched from 0 to +2 end of October-2019. This indicator is described here.
To avoid the bear market, exit stocks when the spread between the 5-month and 25-month moving averages of S&P-real becomes negative and simultaneously the CAPE-Cycle-ID score is 0 or -2. (read more)
Estimated Forward 10-Year Returns
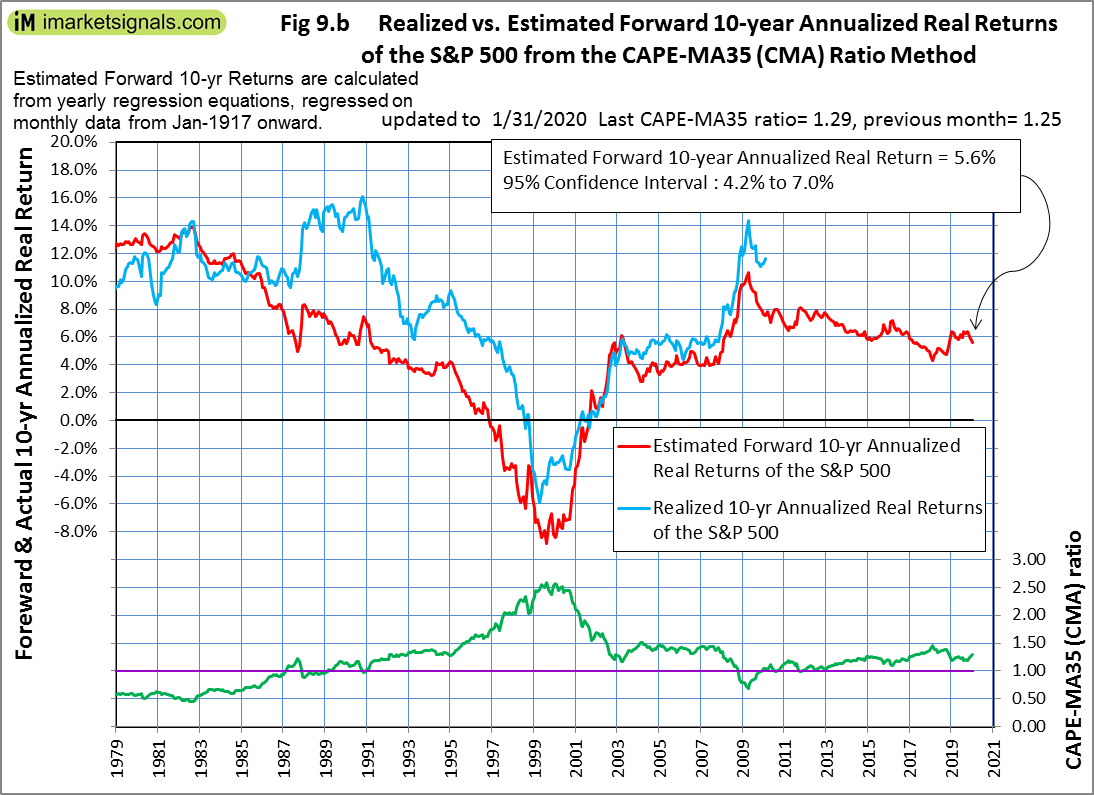 The estimated forward 10‐year annualized real return decreased to 5.9% (previous 6.1) with a 95% confidence interval : 4.5% to 7.3 (previous 4.7% to 7.5%).
iM-GT Timer
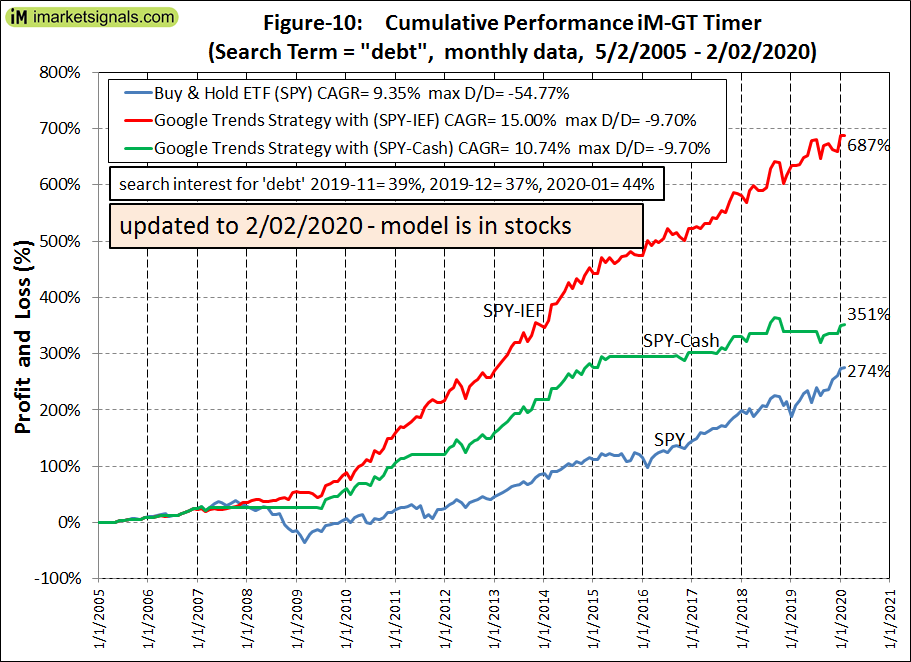 The iM-GT Timer, based on Google Search Trends volume switched into the markets on 12/02/2019. This indicator is described here.
Trade Weighted USD
 Will be updated later, the weekly FRED data series we used was discontinued and replacement series is daily and runs from 2015. We need to adapt our software and graphics first.
TIAA Real Estate Account
 The 1-year rolling return for the end of last month is 4.59%, down from last month. A sell signal is not imminent.
Leave a Reply
You must be logged in to post a comment.