
- From 1950 to 2018 the S&P 500 performed best from November to April, and significantly worse from May to October during most years.
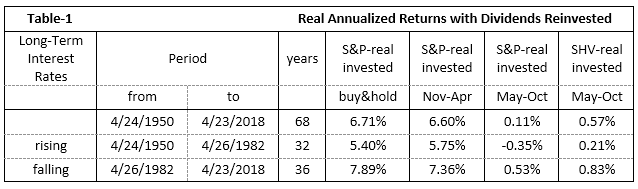
- From 1950-2018 the real annualized return for the S&P 500 was 6.71%. Had one only invested from November to April each year the return would have been 6.60%, almost the same.
- Investing in a money-market fund from May to October each year and the remaining time in the S&P 500 would have provided a higher real annualized return of 7.17%.
- For the 32 year period of rising interest rates (1950-1982) the real return of the S&P 500 was only 5.40%, much less than for following 36 years of falling interest rates.
Over the 32 years of rising interest rates, investment in the S&P 500 during the May-October periods provided a negative real annualized return of -0.35%, while the November-April periods produced 5.75%.
In this article, The iM Seasonal ETF Switching Strategy, it was demonstrated that Cyclical Sectors (Discretionary, Industrials and Materials) and Small Caps perform best from November to April, and Defensive Sectors(Staples, Health Care and Utilities) do better from May to October during most years.
To test for seasonality of the S&P 500 we compared the inflation adjusted annualized returns of the S&P 500 with dividends reinvested (S&P-real) for four investment strategies:
- Permanently invested, Buy&Hold.
- Only invested during the “good” months, November to April.
- Only invested during the “bad” months, May to October.
- Invested in S&P-real during the “good” months and investing in SHV-real during the “bad” months
All trading was assumed to occur on the first trading day of the last week of April and October.
We calculated daily values for S&P-real to reflect the real performance of the S&P 500 with dividends reinvested by splicing the data from three sources: the SPDR S&P 500 ETF (SPY) from 1993 to 2018, the Vanguard 500 Index Fund (VFINX) from 1980 to 1993 and before that from 1953 to 1980 daily data of the S&P 500 with monthly dividends taken from the Shiller CAPE data.
Also we simulated daily data for a hypothetical money market fund SHV-real using the federal funds rate from 1950 to 2007 and thereafter splicing the data from the iShares Short Treasury Bond ETF (SHV) to it.
Performance 1950-2018
In Table-1 is a summary of the real annualized returns for the period 1950 to 1984. The period is divided into two sub-periods which coincide approximately with rising and falling long-term interest rates. It is evident that most of the buy&hold stock market performance was generated during the “good” six months, November to April.
For all three periods, including the period of rising interest rates, investing in the money-market fund SHV-real during the “bad” six months May to October produced higher returns than an investment in the S&P 500.
Real 10-year annualized returns
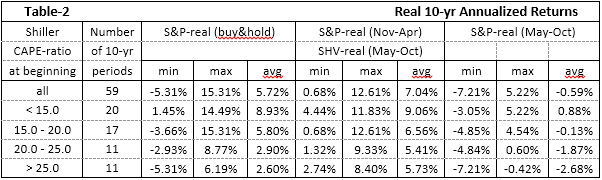
There are 68 years in the Apr-1950 to Apr-2018 period investigated, which contains 59 rolling 10-year periods. 10-year annualized returns were calculated for each of those periods and the Shiller CAPE-ratio was noted at the beginning of each 10-year period.
In Table-2 is a summary of the 10-yr returns listed according to the prevailing Shiller CAPE-ratio at the beginning of the 10-year investment periods. Returns are shown for:
- Buy&hold S&P-real.
- Investing in S&P-real from November to April and in SHV-real from May to October.
- Investing in S&P-real from May to October.
 One can conclude the following:
- Returns become less as the CAPE-ratio increases.
- Investing in S&P-real from November to April and in SHV-real from May to October produces higher average returns.
- The average stock market returns for the May to October periods are dismal.
Recent Returns from 1999 to 2018
The model was back-tested on the online simulation platform Portfolio123, which provides historical financial data for stocks and ETFs from 1999 onward. The ETFs SPY and SHV were used. The returns from Portfolio123 are the usual annualized returns, not adjusted for inflation.
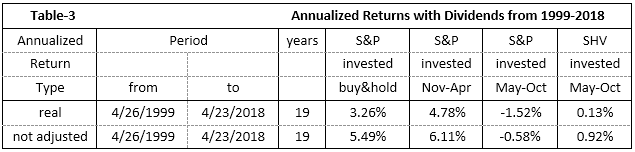
- For the recent 19 year period from end of April-1999 to end of April-2018, the annualized return for SPY was 5.49% with a maximum drawdown of -55%.
- The real returns are much worse. Buy&hold only produced 3.26%, with the “bad” months investment (May-Oct) contributing a negative return of -1.52%.
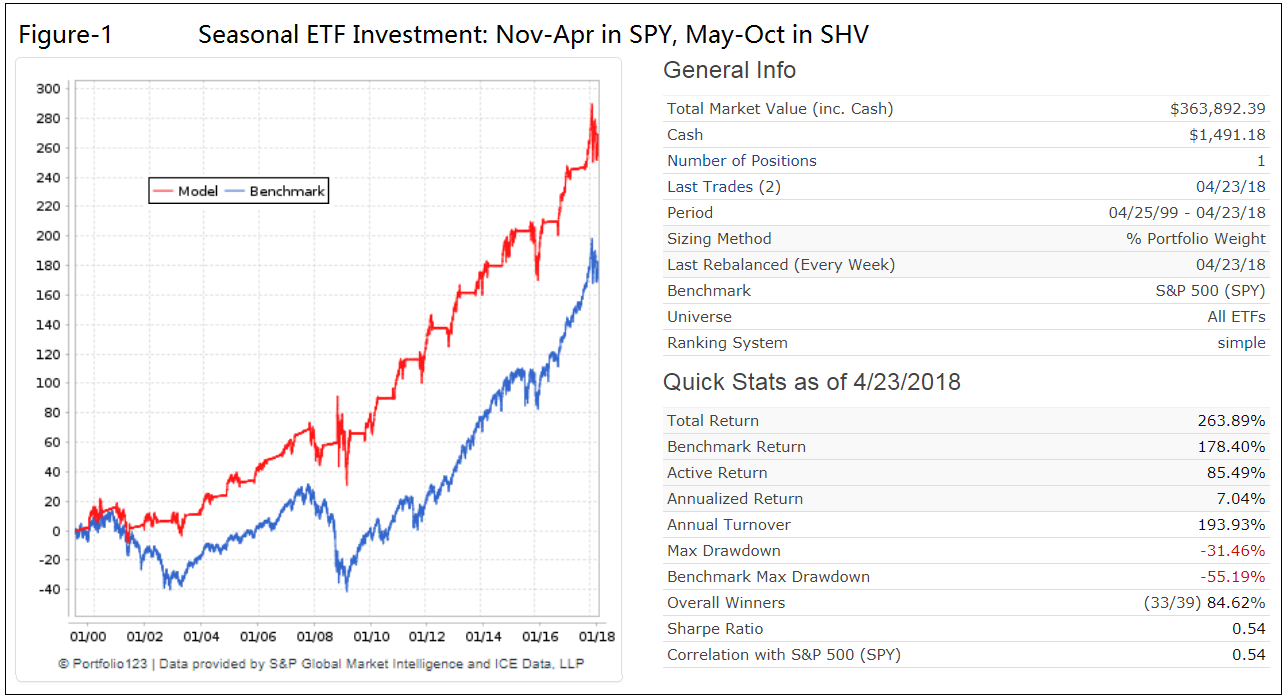
- For the same 19 years, an investment from November-April each year in SPY and from May-October in SHV would have produced an annualized return of approximately 6.11% + 0.92% = 7.03% with a -32% maximum drawdown, as shown in Figure-1 below, clearly a better return than buy&hold the S&P 500.
Returns from 1950 to 2018
- For the 68 year period from end of Apr-1950 to end of April-2018 the annualized return for S&P 500 with dividends not adjusted for inflation was 10.48% with a maximum drawdown of -55%.
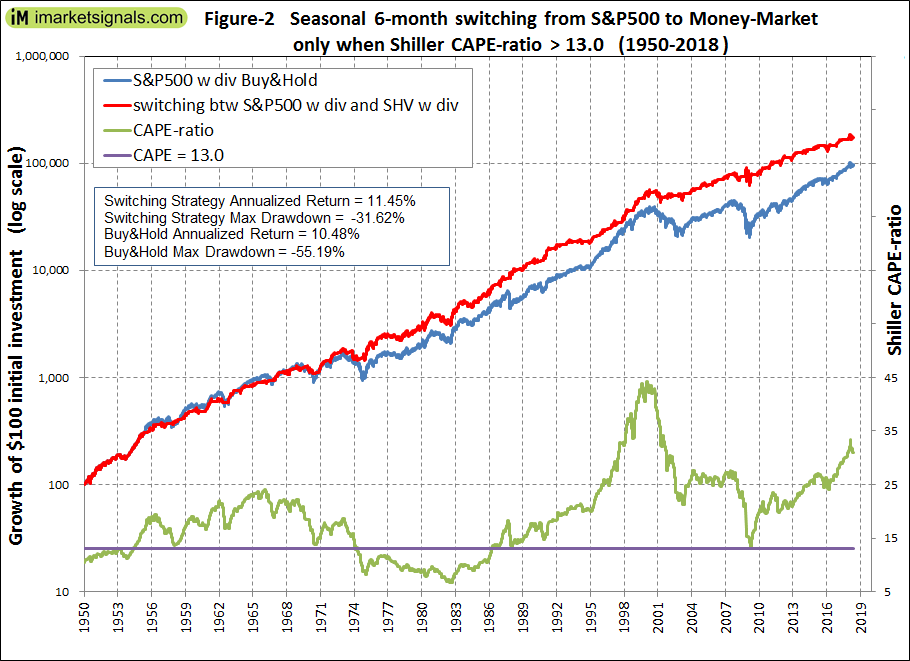
- For the same 68 years, an investment from November-April each year in S&P 500 and from May-October in a money-market account (or when the Shiller CAPE-ratio <= 13.0 from May-October also in S&P 500) would have produced an annualized return of 11.45% with a -32% maximum drawdown, as shown in Figure-2 below, a higher return than buy&hold the S&P 500 with dividends.
Conclusion
Backtesting with historic data shows that investment returns can be improved by employing a seasonal switching strategy. Minimum trading effort is required as one would only switch between a S&P 500 stock index fund and a money-market fund every six months, namely on the first trading day of the last week in April and October of each year. For periods when the Shiller CAPE-ratio <= 13.0 the investment stays only in the stock market.
Higher returns could have been achieved by using a longer term bond fund instead of a money-market fund. However, we wanted to show the most conservative performance from this strategy, which over the period 1950 to 2018 would have provided a total return of 1.8 times that of a permanent investment in the stock market and about 1.5 times more over the last 19 years.
Currently, the CAPE-ratio is at 31.2. The expected real 10-yr annualized returns for this level are shown in the last line of Table-2. It would appear that the best strategy for long-term investors now would be to only invest in the stock market from November to April and then to shift from investment in the stock market to the safer, money-market-fund-like reserve from May to October. Alternatively, one could employ other market timing strategies, some of which can be found here on iMarketSignals.
If you leave out the CAPE-Shiller ratio <= 13.0 condition, what is the result of the six month switching strategy over the 68 year period?
In this week’s email you indicate there is a trade for this strategy but it is not shown anywhere. Please advise how to access the trade.
The signal refers to the iM Seasonal ETF Switching Strategy which has been holding XLP for the last 6 months. It now switches to XLY.
https://imarketsignals.com/2018/im-seasonal-etf-switching-strategy/
The holdings and performance will be reported from next week onward.
This is a good addition to the Super Timer. I’m sure you’ve dived into this before, but another potential cycle of interest that combines well with the best six months is the 4 year Presidential Cycle, where Year 1 starts in November in the Presidential election year. Stock Trader’s Almanac and Jay Kaeppel’s Seasonality book have done research into this, and shown that years 3 and 4 are very positive, year 2 is negative, and year 1 is mixed depending on whether or not there is a new (weak) or incumbent (strong) President.
Tom C