- This 5-stock trading strategy with the Consumer Staples Sector stocks of the S&P 500 produces much higher returns than Consumer Staples Select Sector SPDR Fund (XLP).
- The universe from which stocks are selected holds point-in-time, the S&P 500 consumer non-cyclical stocks of FactSet’s Reverse Business Industry Classification System.
- The model ranks the stocks of this custom universe with a modified “Greenblatt” ranking system and selects periodically the highest ranked stocks which also satisfy stipulated yield requirements.
- From 1/2/2009 to 9/23/2020 this strategy would have produced an annualized return (CAGR) of 25.3%, significantly more than the 11.4% CAGR of XLP over this period.

Blog Archives
Profiting From Trading Stocks Of The S&P 500 Consumer Staples Sector (iM-Top5(XLP)Select)
Profiting from Trading Stocks of the Technology Select Sector SPDR Fund (XLK) — iM-Top5(XLK)Select
- This trading strategy with five stocks from those of ETF (XLK), mainly with a dividend yield greater than that of the S&P 500 index, produces much higher returns than XLK.
- The universe from which stocks are selected holds point-in-time, the S&P 500 technology stocks of FactSet’s Reverse Business Industry Classification System and some electronic payments industry stocks, similar to XLK.
- The model ranks the stocks of this custom universe with the Portfolio 123 “Greenblatt” ranking system and selects periodically the highest ranked stocks which also satisfy the stipulated yield requirement.
- From 1/2/2009 to 9/8/2020 this strategy would have produced an annualized return (CAGR) of 31.8%, significantly more than the 20.1% CAGR of XLK over this period.
The analysis was performed on the on-line portfolio simulation platform Portfolio 123.
Read more >
A Dividend Growth Strategy for Perennial Income
- A simulation of this strategy with annual withdrawal rates of up to 10% still showed long-term growth which exceeded that of buy-and-hold the S&P 500 ETF (SPY).
- The backtests use the FactSet stock database and FactSet’s Revere Business Industry Classifications System (RBICS).
- The model holds equal-weight 10 stocks of the Russell 1000 index which are ranked with a simple ranking system to identify shares of the highest “quality” companies.
- The strategy provides a high dividend yield because a minimum yield excess (depending on RBICS sector type) over the yield of SPY is a critirium for stock selection.
- From Jan-2000 to Jun-2020 this strategy without withdrawals would have produced an annualized return (CAGR) of 21.5%, much more than the 5.6% CAGR obtained from SPY over the same period.
Profiting from the Consensus Stock Holdings of Five Hedge Funds (iM-5HedgeFundSelect)
- This is a copycat trading strategy based on the quarterly 13F filings of five hedge funds.
- The model holds the top 20 consensus picks from a group of five hedge funds.
- Changes in the holdings occur only every three months when the end-of-the-month 13F filings becomes public information.
- From Jan-2007 to May-2020 this strategy would have produced an annualized return (CAGR) of 27.1%, much more than the 7.8% CAGR of the S&P 500 ETF (SPY).
Rational for a Copycat Strategy
Research from Barclay and Novus published in October 2019 found that a stock selection copycat strategy that combines conviction and consensus of fund managers that have longer-term views outperformed the S&P 500 by 3.80% on average annually from Q1 2004 to Q2 2019.
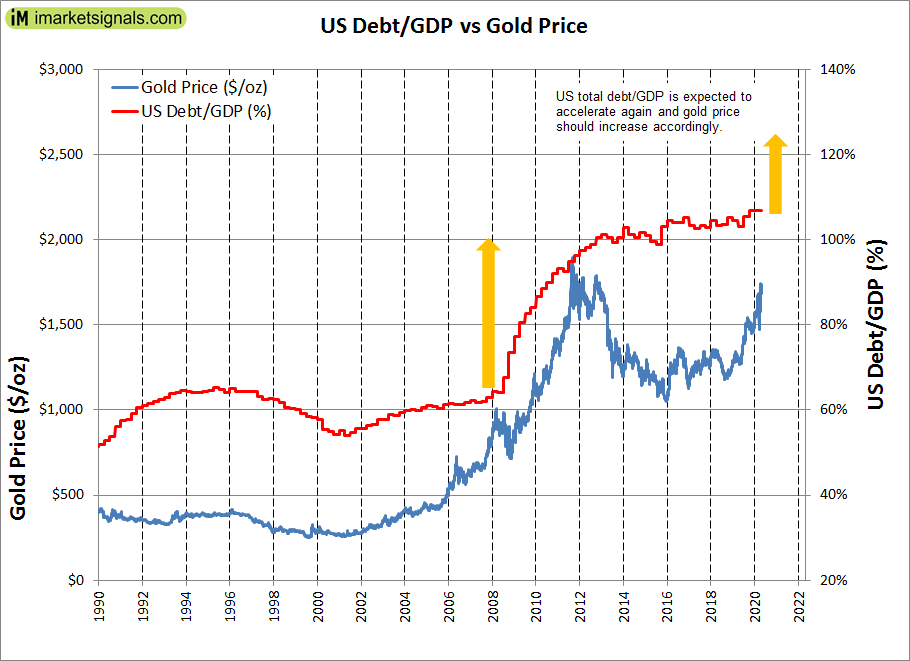
Profiting from the Expected Uptrend of Gold with a Momentum Trading Strategy of Gold Mining Stocks
- The ratio of federal debt to the GDP is expected to rise dramatically due to the covid-19 pandemic fiscal stimulus. This should result in a significant gold price rally.
- The analysis shows that a trading strategy for gold miners is preferable to a buy-and-hold investment strategy of individual mining stocks.
- This momentum strategy selects periodically one gold mining stock from a set of three: AngloGold Ashanti Ltd (AU), Newmont Corp. (NEM) and Sibanye-Stillwater Ltd. (SBSW).
- The selection is based on the momentum of the percentage price change and the up/down volume ratio of the stocks.
- From Jan-2016 to Apr-2019 this strategy would have produced an annualized return (CAGR) of 80.6%, much more than that of the best performing single stock of the three considered.
The ratio of federal debt to the economic output of the U.S. is expected to rise dramatically by the end of 2020 as a result of the covid-19 pandemic fiscal stimulus. This, and low interest rates should result in a significant rally in gold, similar to the post 2008 gold price increase, as shown in the figure below.
Posted in blogs
Short-Term Losses for Stocks Could Exceed 30%, But 10-Year Forward Returns Look Good
- The average of S&P500 for March-2020 was 2652. A 12% decline, or 325 point drop, would bring it to 2327, the end of March level of the long-term trend line.
- A recession appears to be imminent. Stocks could lose up to 50% if the S&P reaches the lower prediction band line of the long-term trend.
- If the percentage decline matches the loss during 2009-09 recession then the S&P500 could reach a low of 1560, a decline of about 35% from the current value.
- The Shiller Cyclically Adjusted Price to Earnings Ratio (CAPE) is at a level of 24.5, almost identical to the 35-year moving average (MA35) of the CAPE of 24.3.
- The CAPE-MA35 ratio is 1.01, forecasting a 10-year annualized real return of 7.9%. Should the CAPE-MA35 ratio decline further then 10-year forward returns will be higher.
Posted in blogs
Why Vanguard Should Retire The U.S. Momentum Factor ETF (VFMO)
- In February 2018 Vanguard released a set of five actively managed sector ETF’s and one multi-factor ETF. Here we report on the performance of the Momentum Factor ETF (VFMO).
- Shortly after the inception of VFMO we published “Why Not To Invest In Vanguard’s New U.S. Momentum Factor ETF” which demonstrated that Vanguard’s selection criteria for this fund was flawed.
- In the referenced article we stated that it was unlikely that VFMO would show a higher return than the SPDR S&P 500 ETF (SPY) over the year following inception.
- In April 2019 in a follow up article we showed that the actual performance of VFMO since inception was 6.8% lower than that of SPY, confirming the conclusion in the bullet-point above.
- Again, VFMO has underperformed SPY, and we come to the same conclusion for the following year, namely that the one-year return to Feb-2021 will be less than that of SPY.
Posted in blogs
The iM-SuperTimer – Update No.2a:Timing the Market with the iM-Stock Market Confidence Level
- For a detailed model description of the system please read the original description and previous update.
- To make this model more user-friendly we will be providing signals for three different version of this model, all updated weekly.
- The models’ holdings alternate between ETF (SPY) and ETF (IEF), being proxies for investments during up- and down stock market periods, repectively.
- The iM-1wk-SuperTimer (SPY-IEF) would have produced an annualized return of 19.9% with a max drawdown of about -10%.
- Appendix 2 shows that a (50%SPY+50%VCIT)-(IEF) strategy reduces drawdowns to -6.2% but would still have achieved an annualized return of 14%.
Posted in blogs
Robust Recession Forecasting With Our New Long Leading Index For The US Economy
- The new Federal Reserve Bank of Chicago Brave-Butters-Kelley Indexes (BBK) provide useful input for recession forecasting.
- We combine two BBK indexes with the Conference Board LEI and our Business Cycle Index BCIg to derive iMarketSignals’ new Long Leading Index (iM-LLI) for the US economy.
- Our analysis shows that the iM-LLI would have provided an average warning signal about eight months before the start of recessions, as observed for the last seven recessions since 1967.
- We are replacing the iM-Composite Index (COMP) with the new iM-LLI.
- Currently this Leading Index is not yet warning of an oncoming recession.
Estimating 10-Year Forward Returns For Stocks With The Shiller CAPE Ratio And The Long-Term Trend – Update January 2020
- The average of S&P 500 for Dec-2019 was 3166; that is 852 (i.e. 27% of 3166) above the Jan-2020 level of the long-term trend line.
- The Shiller Cyclically Adjusted Price to Earnings Ratio (CAPE) is at a relatively high level of 30.1, and the 35-year moving average (MA35) of the CAPE is at 24.2.
- The CAPE-MA35 ratio is 1.25, forecasting a 10-year annualized real return of 5.9%.
- Investing in equities for the long-haul when the CAPE-MA35 ratio is below 1.30 should produce reasonable returns, as this level of the ratio does not indicate an abnormally overvalued market.
With reference to Section 202(a)(11)(D) of the Investment Advisers Act:
We are Engineers and not Investment Advisers,
read more ...
By the mere act of reading this page and navigating this site you acknowledge, agree to, and abide by the
Terms of Use / Disclaimer