
- This strategy exploits the anomaly that Cyclical Sectors and Small Caps perform best from November to April, and Defensive Sectors do better from May to October during most years.
- In this analysis only one ETF is periodically selected by a simple ranking system from the cyclical and defensive groups, respectively, and held for six months.
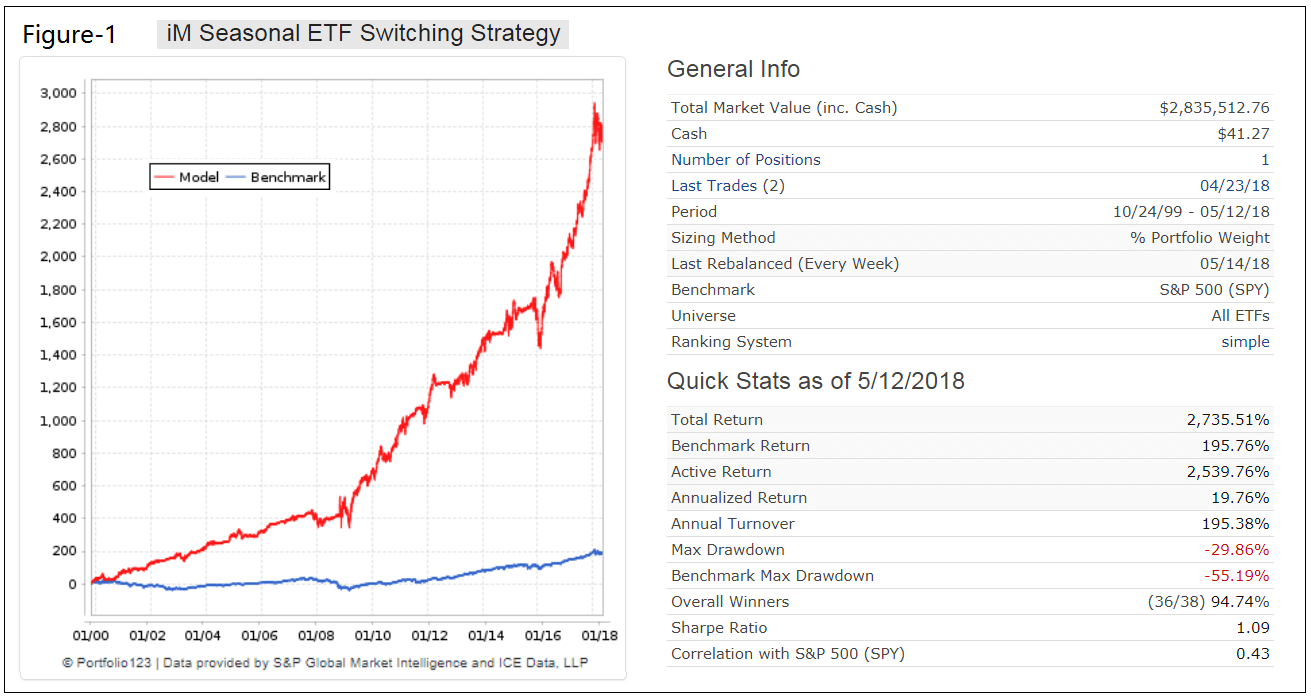
- Out of the 37 six-month periods, 36 periods showed gains ranging from 0.1% to 28.1%, while only one six-month period produced a loss of -9.3%.
- For the approximately 18.5 year period from end of Oct-1999 to May-2018 the backtest showed an annualized return of 19.8% with a maximum drawdown of -30%.
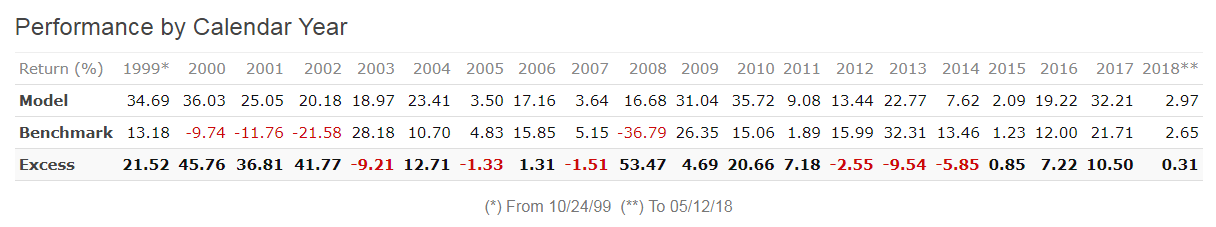
- For an “inverted” switching strategy, when cyclicals ETFs are used for the May-October period and defensive ETFs during November-April period, the annualized return was 3.2% and maximum drawdown was -60%.
The Case for Seasonal Switching
In this May-2013 article, What To Sell, If Selling In May, Doug Ramsey shows that since 1926 most of the excess return of Small Caps was earned during the seasonally strong months of November through April, and that one could have sat in cash each May through October and beaten “Small Cap Buy and Hold” on a total return basis.
The article also demonstrates that since the inception of the S&P 500 sector data in late 1989 it would have been beneficial to own cyclicals (Discretionary, Industrials and Materials) during the seasonally strong market months of November through April, and then swap into defensives (Staples, Health Care and Utilities) for the May to October period.
The iM Seasonal Switching Model
| ETF | The cyclical ETFs used for the analysis are: |
| XLY | Consumer Discretionary SPDR ETF |
| XLI | Industrials SPDR ETF |
| XLB | Materials SPDR ETF |
| XLK | Technology SPDR ETF
rev.11/22/20: XLV replaces XLK |
| VBR | Vanguard Small-Cap Value ETF |
| ETF | The defensive ETFs used are: |
| XLP | Consumer Staples SPDR ETF |
| XLV | Health Care SPDR ETF
rev.11/22/20: XLK replaces XLV |
| XLU | Utilities SPDR ETF |
| VIG | Vanguard Dividend Appreciation ETF |
| IEI | iShares 3-7 Year Treasury Bond ETF |
The model was back-tested on the on-line simulation platform Portfolio123, which provides historical economic and financial data as well as extended price data for ETFs before their start dates. Only one ETF is periodically selected from each group of five ETFs by a simple ranking system and held for six month. There is no market timing or stop-loss rule in the model.
A simple ranking system is used which is based on the price changes over a short period. The notion is that ETFs which have experienced a decline over a short period will bounce back, reverting and doing better than ETFs which have not declined in this way.
In the Appendix is a listing of all the 37 completed transactions. The only loss over any of the 37 six months investment period was -9.3% for the period 10/22/2007 to 4/28/2008 during the Great Recession which officially lasted from December 2007 to June 2009.
The red graph in Figure-1 shows the performance of the model with dividends and with trading costs and slippage accounted for. The blue graph represents the buy&hold performance of SPY (the ETF tracking the S&P 500 index). The model greatly out-performed SPY which only produced an annualized return of 6.0% with a maximum drawdown of -55%. Over the full period from end of Oct-1999 to May-2018 the total return of the model is 14-times that of SPY.
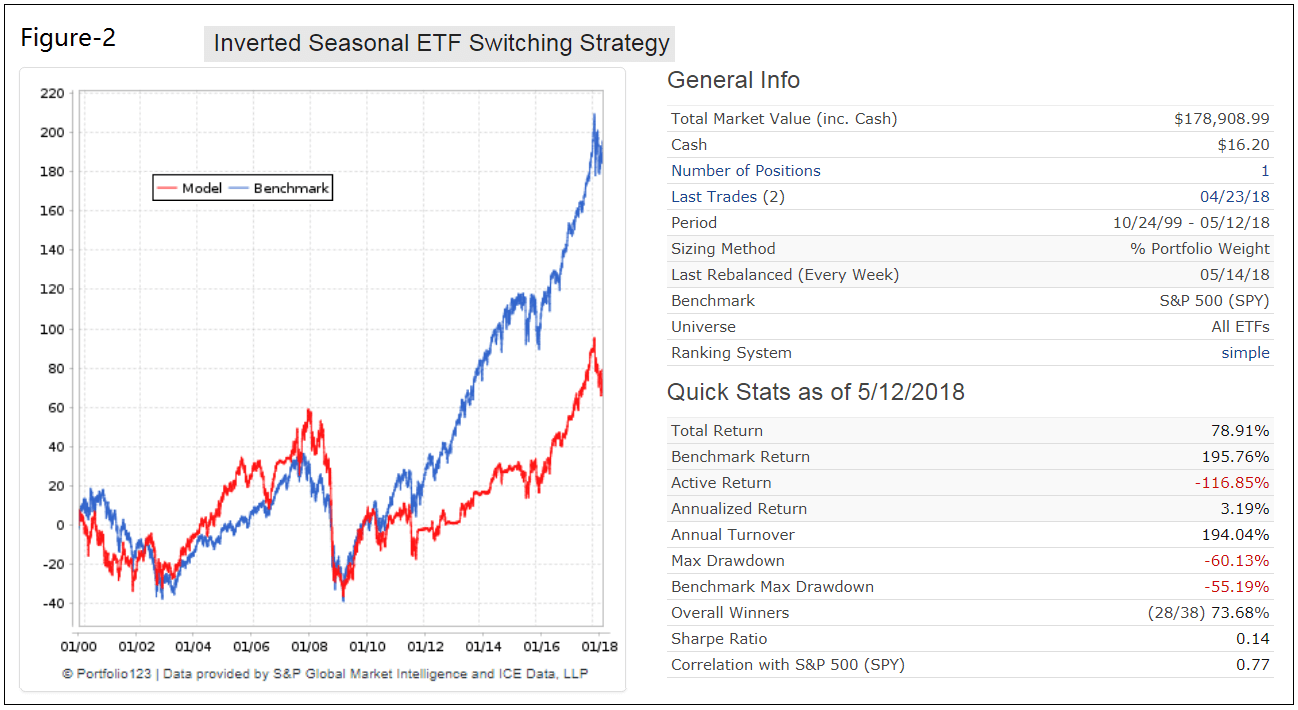
Performance by Calendar Year
The backtest shows only positive calendar year returns and produced positive returns for each calendar year, and excess returns over SPY in 13 out of 19 years.
What happens if the strategy is inverted?
Figure-2 shows the performance when an “inverted” seasonal switching strategy is adopted – when cyclicals ETFs are used for the May to October period and defensive ETFs during the seasonally strong market months of November through April. Again only one ETF is selected and held for six months.
The annualized return collapses to 3.2% with a maximum drawdown of -60%. Over the full period from end of Oct-1999 to May-2018 the total return of the inverted strategy model is only about 40% of SPY.
What happens if more than one ETF is periodically selected?
The performance diminishes if the model holds more than one ETF. The table below lists annualized returns and percentage of winning trades for the model holding one to five positions. For all cases performance is significantly better than for buy&hold of SPY which only produced an annualized return of 6.0% over the corresponding time period.
| Number of Positions | Annualized Return | Percentage Winners |
| 1 | 19.8% | 95% |
| 2 | 13.5% | 84% |
| 3 | 12.5% | 83% |
| 4 | 12.2% | 82% |
| 5 | 10.8% | 77% |
Conclusion
Backtesting with historic data shows that investment returns can be vastly improved by employing a seasonal ETF switching strategy. Minimum trading effort is required as one would only switch between ETFs every six months, namely on the first trading day of the last week in April and October of each year.
The performance of this model and ETF selection will be reported bi-annually.
Appendix
Transactions (Return is without dividends)
| Symbol | Open | Close | Days Held | Return | |
| 38 | XLP | 04/23/2018 | — | — | — |
| 37 | XLY | 10/23/2017 | 04/23/2018 | 182 | 13.69% |
| 36 | XLV | 04/24/2017 | 10/23/2017 | 182 | 12.39% |
| 35 | XLI | 10/24/2016 | 04/24/2017 | 182 | 16.12% |
| 34 | XLU | 04/25/2016 | 10/24/2016 | 182 | 1.50% |
| 33 | VBR | 10/26/2015 | 04/25/2016 | 182 | 0.87% |
| 32 | IEI | 04/27/2015 | 10/26/2015 | 182 | 0.08% |
| 31 | XLB | 10/27/2014 | 04/27/2015 | 182 | 7.19% |
| 30 | VIG | 04/28/2014 | 10/27/2014 | 182 | 1.63% |
| 29 | XLK | 10/28/2013 | 04/28/2014 | 182 | 7.30% |
| 28 | VIG | 04/22/2013 | 10/28/2013 | 189 | 10.66% |
| 27 | XLK | 10/22/2012 | 04/22/2013 | 182 | 0.20% |
| 26 | IEI | 04/23/2012 | 10/22/2012 | 182 | 0.37% |
| 25 | XLK | 10/24/2011 | 04/23/2012 | 182 | 11.93% |
| 24 | IEI | 04/25/2011 | 10/24/2011 | 182 | 4.76% |
| 23 | XLB | 10/25/2010 | 04/25/2011 | 182 | 14.50% |
| 22 | XLV | 04/26/2010 | 10/25/2010 | 182 | 1.14% |
| 21 | VBR | 10/26/2009 | 04/26/2010 | 182 | 24.35% |
| 20 | XLV | 04/27/2009 | 10/26/2009 | 182 | 18.12% |
| 19 | XLY | 10/27/2008 | 04/27/2009 | 182 | 17.43% |
| 18 | IEI | 04/28/2008 | 10/27/2008 | 182 | 2.62% |
| 17 | VBR | 10/22/2007 | 04/28/2008 | 189 | -9.31% |
| 16 | IEI | 04/23/2007 | 10/22/2007 | 182 | 1.93% |
| 15 | XLI | 10/23/2006 | 04/23/2007 | 182 | 7.17% |
| 14 | IEI | 04/24/2006 | 10/23/2006 | 182 | 2.50% |
| 13 | XLI | 10/24/2005 | 04/24/2006 | 182 | 17.62% |
| 12 | XLP | 04/25/2005 | 10/24/2005 | 182 | 0.81% |
| 11 | XLB | 10/25/2004 | 04/25/2005 | 182 | 6.20% |
| 10 | IEI | 04/26/2004 | 10/25/2004 | 182 | 2.90% |
| 9 | VBR | 10/27/2003 | 04/26/2004 | 182 | 15.77% |
| 8 | XLP | 04/28/2003 | 10/27/2003 | 182 | 9.24% |
| 7 | XLB | 10/28/2002 | 04/28/2003 | 182 | 5.42% |
| 6 | IEI | 04/22/2002 | 10/28/2002 | 189 | 8.36% |
| 5 | XLY | 10/22/2001 | 04/22/2002 | 182 | 20.75% |
| 4 | XLP | 04/23/2001 | 10/22/2001 | 182 | 5.31% |
| 3 | XLB | 10/23/2000 | 04/23/2001 | 182 | 24.62% |
| 2 | XLU | 04/24/2000 | 10/23/2000 | 182 | 13.89% |
| 1 | XLK | 10/25/1999 | 04/24/2000 | 182 | 28.09% |
This is pretty cool. What sector are we in right now? I couldn’t see that from looking at this.
Tom C
XLP (and amended table in appendix)
The ranking system you are using here appears to have a nice edge. Have you ever run this in a way that allows you switch weekly during the six month period to the leader in the respective group (Cyclical Nov-Apr, Defensive May-Oct) based on your ranking system?
Tom C
This is difficult to do in P123. One could do it in excel.
The advantage of this switching model is that one would only have to trade every six month to beat SPY. That could be attractive to many investors.
Yes, that makes sense. Another interesting question might be: what if you used something like MAC-US timer (on the S&P) or Composite RSP-SH timer to determine whether or not to choose between cyclical and defensive regime and choose based on your ranking system.
Tom C
To do it in P123 you would have to have an entry rule in a sim something like
( ((Month 10)) AND Ticker(“XLY XLI XLB XLK VBR”) )
OR
( ((Month > 4) AND (Month < 11 )) AND Ticker("XLP XLV XLU VIG IEI") )
with an exit rule that always exits so that a new choice is evaluated each week. Been quite a while since I've done anything in P123 but I think something like that would work.
Tom C
sorry, lost some characters
( ((Month 10) AND Ticker(“XLY XLI XLB XLK VBR”) )
OR
( ((Month > 4) AND (Month < 11 )) AND Ticker("XLP XLV XLU VIG IEI") )
Tom C
Hi, where one the site/emails will the ETF changes be reported? I wouldn’t want to miss a signal. thanks
*where ON the site
The model is now in XLP. We will email and post the next signal on Oct-28-2018.
Why wouldn’t the next signal be on Oct-21-2018 for trading on Oct-22-2018 since Oct-22-2018 is 26 weeks from Apr-23-2018? Also, are you trading on the open, close, or other?
Thanks,
Dan
Trading occurs on the first trading day of the last week of October, which should be Oct-29.
I’m still not understanding the trading days. For example, you have the trading day for last October as 10/23/2017. This is not the “first trading day of the last week of October”. 10/30/2017 is the first trading day of the last week of October 2017. Can you clarify?
The date is determined by this rule:
MonthDay>=22 & MonthDay<=30
Sorry to beat a dead horse, but 10/30/2017 is OK by this rule, but it still used 10/23/2017 above. All of the trade dates listed above actually fall between 22 and 28 so a rule such as MonthDay>=22 & MonthDay<=28 would match your data. However, you said the next trade date is the 29th which doesn't match?
How would this strategy do using fidelity select funds?
What level of access will be required for the e-mail updates? Thanks.
This would require a Bronze membership
Georg, Suppose one would overlay Composite Timer SPY/IEF and only enter equity positions if Composite Timer pointed to SPY. Would that improve results and drawdowns?
Would results improve significantly if you tweak this by overlaying your CAPE-Shiller ratio <= 13.0 threshold (that you described during your most recent article) on to this approach — that is, be in cyclicals during May-November when this condition is in place?
Tom C
The CAPE-Shiller ratio <= 13.0 did not occur during the backtest period of this model. It occurred from 1974-1985.
ah, good point. I posted a follow-up question about the 68 year period on your most recent post. Thanks.
Tom C
This strategy is essentially a cross between the “Sell in May and go away,” notion, and the Fama-French 3-Factor Model, which states that small-cap and value stocks tend to out-perform. Cyclical stocks tend to have the lower price-book ratios and lower P/E’s that you would find in a value style stock plus the higher betas needed to beat the market. Brilliant work! If you wanted to take this strategy a step further, you might bring in Bulkowski’s Ten Bagger strategy (from the book, not his website) and really amplify your gains.
(Rules for Ten Baggers from his book)
Small cap stocks with less than $1B market cap
Price per share between $1 and $5
P/B ratio < 2.5 (value stock)
P/S ratio < 1.5
PCF ratio < 10 but preferable < 6
No dividend
Has long-term debt
These stocks, in cyclical sectors held from Nov 1 until Apr 30, except during recessionary periods, with no more than 2% – 5% of portfolio invested in any one company.
I question the use of XLK over an ETF known to perform better between Nov 1 and May 1st like XLF. Did you try to incorporate XLF? Also XLE is a really good performer during those months. Is there any way to test these two ETF’s in this system to see if performance improves?
Simulated annualized return from 10/24/1999:
with XLK 20.0%
with XLF 17.8%
with XLE 17.6%
What if you added the VINEX to the November – April group?
Given it’s 11/1, what ETF would the IM Seasonal Switching Strategy be using now for the Nov-Apr period?
On the Home Page:
iM-Best Holdings
The iM-Seasonal ETF Switching Strategy sells XLP and buys XLY on 10/22//2018.
Hi Georg,
I’m interested to know if you tried backtesting this strategy using different trading days for the 6mth cycle. Ie. You state the trade occur on the “first trading day of the last week in April and October of each year”.
Have you compared different dates in Apr and Oct to see if the model returns can be optimised/improved?
Thanks
James
The end of April and end of October dates come from an optimization process.
Thanks, Georg!
Looks like another winning year for this strategy. Since buying XLP on 4/23/2018 and switching to XLY on 10/23/2018, StockCharts.com shows the total return for this strategy is about 19.5% so far, vs. 9.8% for SPY. Would have been higher had we held off on switching until XLY cratered in December.
I worried that the optimization process may have picked trade dates or other parameters which were a “lucky” fit to past data, but the luck looks like it’s continuing “out of sample.”
I hope you will continue to give strategy updates in the comments this month.
Here’s a link showing total return for each fund and the benchmark for the last 240 days: https://stockcharts.com/freecharts/perf.php?SPY,XLP,XLY&n=240&O=011000
The switch dates are fixed for the model. They are every year the same. This isn’t just luck, the seasonal performance of the stock market has been going on for a long time.
Thanks for the reply, Georg. Yes, I read your description and understand the switch dates. I only meant I’m never sure if performance going forward will be as good as the back test, but in this case it remains great!
I don’t remember seeing any strategy which trades twice a year and has such consistently good performance. Most investors who are semi-passive should think about including this strategy in their portfolio. I plan to look at more of your strategies and see if any match my investment style. I work for a financial institution and have some restrictions on trading stocks, but my employer doesn’t mind if I actively trade most ETFs.
Best regards,
Elliott
Yes, it has worked well. At the end of April this model will switch to defensive. Let’s see what it selects then.
Hi Georg
I like this strategy – but choke a little on the -30% max drawdown….
What period did the -30% max drawdown occur?
Could you possibly post the max drawdowns in each calendar year please so we could determine the average annual maximum drawdown. I may keep a trailing stop loss under this strategy.
Many thanks!
VMan
3/9/2009………. max D/D= 29.86%
year … max D/D
2000 … 23.25%
2001 … 13.30%
2002 … 6.36%
2003 … 17.04%
2004 … 5.57%
2005 … 13.54%
2006 … 5.13%
2007 … 10.95%
2008 … 29.61%
2009 … 29.86%
2010 … 10.13%
2011 … 9.43%
2012 … 10.06%
2013 … 7.11%
2014 … 8.84%
2015 … 7.40%
2016 … 16.79%
2017 … 3.94%
2018 … 10.71%
Would it be possible to combine this iM Seasonal Strategy with the iM Super Timer 1 week in that when the Super Timer called for SPY, SPY would be replaced with the Seasonal ETF? For example now the Seasonal is in XLV and iM Super Timer is in SPY so replace SPY with XLV. When the iM Super goes to IEF, XLV would be sold and IEF bought, when the Super goes back to SPY, IEF would be sold and XLV bought. This would continue until the next Seasonal ETF change. Would this combination improve CAGR and reduce DD?
There is no way we can test this, but it is not a bad idea to reduce risk during the seasonal bad months from May to October when the SuperTimer wants to be in SPY. You could also hold 50% SPY and 50% IEF instead of 100% SPY.
See today’s article, Figure-1 and -2.
https://imarketsignals.com/2019/winning-strategy-profit-seasonal-effect-equities/
Hey!
Great work, I really like the strategy. But i dont understand how to select the etf. What means Short period. Is it for example the etf that performed worst the last week?
Did you test it with different timeframes? For example if you take the etf that performed worst the last month? Does the results change a lot than or is it stable?
The model selects the applicable ETF, not the user.
The details of the algorithm are proprietary information.
Very Impressive. I was put on to your guys from a friend of mine who swears by you!
I was wondering if you have a spreadsheet available with the daily PnL since inception.
I know I could plot them myself against the data above, but I was wondering if there was one to hand, before I started?
Also, how long has this strategy been live and promoted for (ie customer forward tested, if you will)
Keep up the great work
Check your email for the spreadsheet.
The model has been live since 1/1/2018.
Brill, thanks for your prompt reply
I am glad that vman requested the annual DD info. I just happened to check on your 2018 stat that you said had a max DD of 10.71%. If the model bought XLY on 10/22/18 I show a max DD on that position of 17.6% instead of your 10.71%. The closing high was at $111.57 on 11/8/18 and it drew down to a closing low of $91.98 on 12/24/18. Thus 17.6% DD in 2018. Could you please explain our differences?
Also, could you list the individual max DD’s on your Appendix graph in a separate column next to your P/L column for each holding “period”? For instance the VBR position in 2015 did have a 7.4% DD by the end of the year but the DD continued into 2016 for another 12% which put the max DD for that position at 19%.
You are correct, the max D/D for 2018 was -17.38%. The spreadsheet calculated it to 12/17/2018, 9 trading days short before the end of the year.
Your second request would require to calculate the drawdowns for 38 different periods. Since all holdings and periods are shown you can also do this calculation, same as you did for XLY.
How did you use IEI iShares 3-7 Year Treasury Bond ETF prior to 2007? The Fund did not exist until January 2007.
Portfolio 123 constructs synthetic data from the index the ETF follows.
Impressive strategy! I’m just wondering if we tweak the period that is used to compute the price change over a short period of time, for instance let’s say we take the past 10 days return instead of 20 days for the ranking system, will this have a big impact on the overall strategy return?
And is the period that you’re using here the result of optimization (i.e. is there a risk of overfitting?)?
Thank you.
We use a simple reversion to the mean ranking system.
Would it be possible to see this post updated to current times, as the last buy was on 4/23/18?
This model changes investments in the last week of April and October.
The last trade was on 4/27/2020 as reported in the weekly email update to subscribers (silver membership required).
Performance can be found in the summary listing of all the models.
I think I’m being thick, but I can’t find the summary listing of all the models. Could you link to it, please?
Home page
> click on “Model Performance Tables:”
> “Out of sample performance summary”
click on top two pictures on left side.
Also, you said on the Jun 3, 2018 at 12:58 pm on this thread that this is available to bronze members?
My mistake. It is in the Bronze group.
It would be interesting to see what would happen if you end up being in one of the sector ETFs, what would be the result if you took that sector and applied the Greenblatt model you have been using in your “sector select” models. there’s a couple you haven’t covered yet. it wouldn’t make sense for IEI and VBR, might make sense to use your one of your dividend models if the dividend fund is selected.
Tom C
So far we have 4 “select sector” models, i.e. for XLK, XLI, XLV, and XLP.
What you are suggesting that instead of holding the ETF one holds the 5 stocks from the trading models. This should give better performance than holding the ETF. But we have not backtested this yet.
Hi, Georg. I’m curious if this strategy still uses a ranking system “which is based on the price changes over a short period. The notion is that ETFs which have experienced a decline over a short period will bounce back?”
The home page says the strategy went to XLB on 10/24, but XLB has done pretty well over the last month or so (https://stockcharts.com/freecharts/perf.php?SPY,VBR,XLB,XLY,XLV,XLI&p=1&O=011000). Looks like we’d have to start counting from the local max in mid August for XLB’s total return to be at the bottom of the pack. I’m not trying to pry proprietary modeling parameters from you, but I am curious if the strategy has changed?
I really like this strategy. Is there any way to see the transactions between April 2019 and the April 2023?
Thanks.
Here is a link to Google Sheets with all the trades.
https://docs.google.com/spreadsheets/d/1x4axPtq1ArOqlECQ8Bq_6brzKICy1mIdpYEyDmyVSBk/edit?usp=sharing
Are the newest trades that come up sent to subscribers, or is there another place to find them on the site?
Thank you.
The model is updated weekly, but holdings can only change end of April and end of October. We send out weekly emails and update the website typically on Sundays.
The model updated showing BUYS XLX. Where can I find this ticker?
Thanks for pointing the obvious type, the portfolio showed the correct holding.