
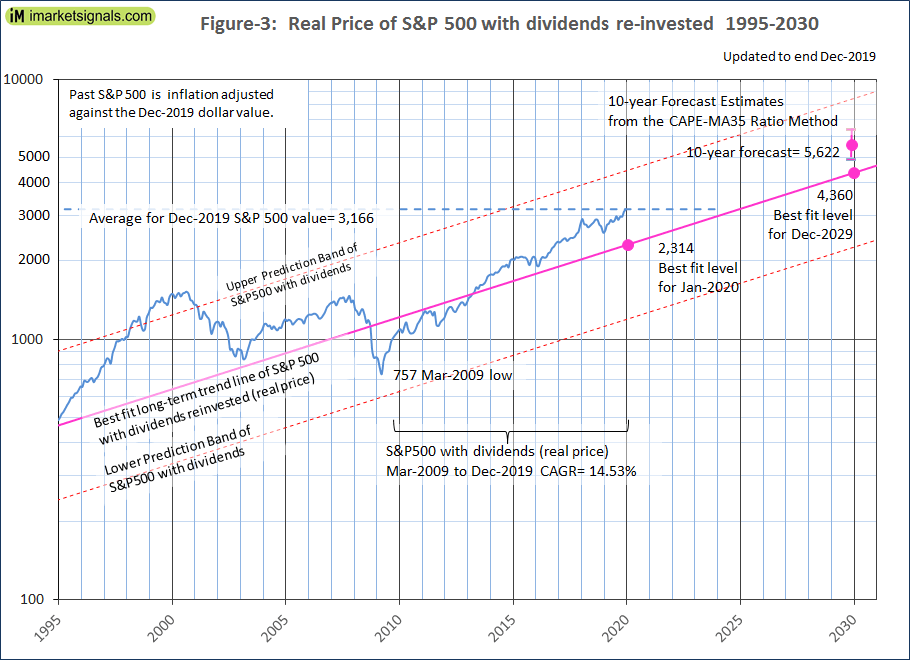
- The average of S&P 500 for Dec-2019 was 3166; that is 852 (i.e. 27% of 3166) above the Jan-2020 level of the long-term trend line.
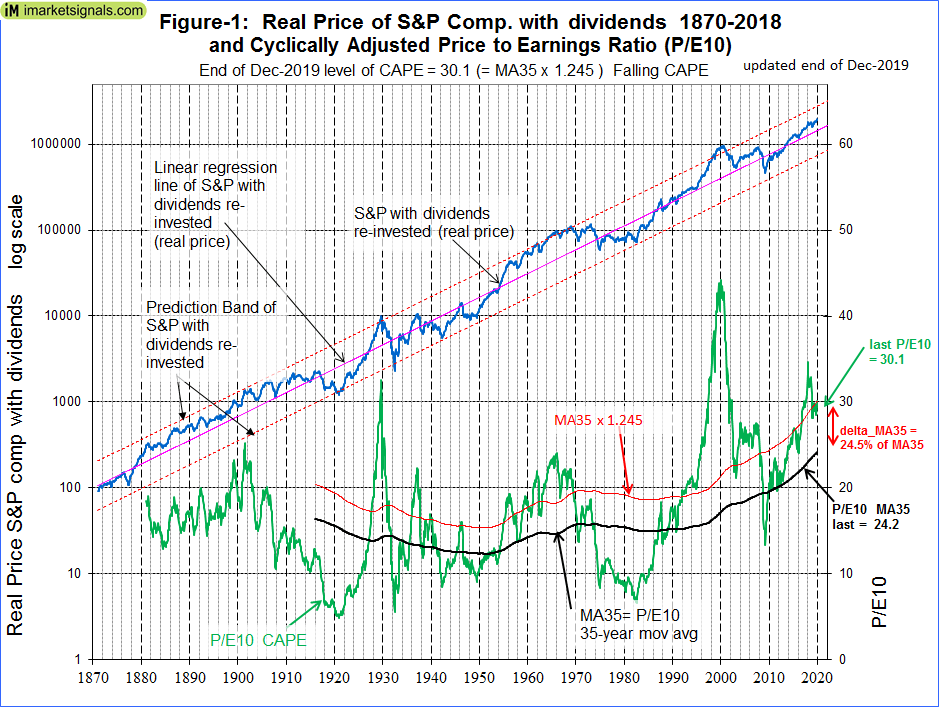
- The Shiller Cyclically Adjusted Price to Earnings Ratio (CAPE) is at a relatively high level of 30.1, and the 35-year moving average (MA35) of the CAPE is at 24.2.
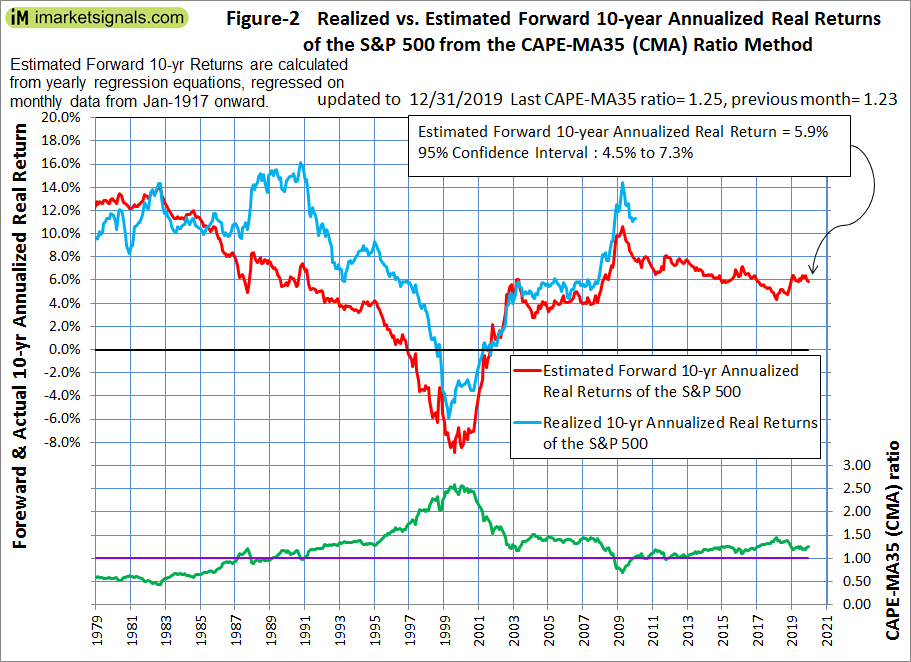
- The CAPE-MA35 ratio is 1.25, forecasting a 10-year annualized real return of 5.9%.
- Investing in equities for the long-haul when the CAPE-MA35 ratio is below 1.30 should produce reasonable returns, as this level of the ratio does not indicate an abnormally overvalued market.
This is a follow-up article to Estimating Forward 10-Year Stock Market Returns using the Shiller CAPE Ratio and its 35-Year Moving Average, which is referred to as the “referenced article” further down.
Since March 2009 the S&P 500 with dividends has gained a real 320% to December 2019. So what further gains can we expect, if any?
Will the bull market continue?
Nobody knows, and the best we can do is to use the historic data (which is from Shiller’s S&P series) to guide us to make estimates for the future. From the real price of the S&P-Composite with dividends re-invested (S&P-real) one finds that the best-fit line from 1871 onward is a straight line when plotted to a semi-log scale. There is no reason to believe that this long-term trend of S&P-real will be interrupted. S&P-real, updated to end of Dec 2019, and the best fit line together with its 95% prediction bands are shown in Figure-1. (See appendix A for the equation.)
The current level of the S&P-real is above the long-term trend line, and a reversal to the mean trend would entail a 27% decline over a short period.
Forecasting 10-year stock market returns with the CAPE-MA35 Ratio
Also shown in Figure-1 are the CAPE (which is the S&P-real divided by the average of the real earnings over the preceding 10 years) and its 35-year moving average, having end of June values of 30.1 and 24.2, respectively.
As discussed in the referenced article, a superior method to the standard use of the Shiller CAPE-ratio is to predict 10-year real returns using the CAPE-MA35 ratio as a valuation measure, which is simply the value of the Shiller CAPE-ratio divided by the corresponding value of its 35-year moving average (30.1 / 24.2 = 1.25).
Currently, for the 10-year period to Dec-2029, the CAPE-MA35 ratio of 1.25 forecasts an annualized real return of 5.9%. For the S&P-real referenced to the current S&P 500 value this would indicating a Dec-2029 value of 5622, with upper and lower confidence values of 6400 and 4900, respectively, all as shown in Figures-2 and -3.
Forecasting of returns with the long-term trend
When extending the best fit line and the prediction bands to 2030 (Figure-3) it enables us to estimate the change of S&P-real from the current level of 3166. In Jan-2020 the value of S&P-real as indicated by the best fit line would be at 2314, about 27% lower than where it is now. In Dec-2029, the value of S&P-real should be about 4360, while the highest and lowest values shown by the prediction bands would be 8420 and 2260, respectively.
Thus the historic trend forecasts a probable gain of about 38% for S&P-real to Dec-2029. The worst scenario would be a possible loss of about 35%, and the best outcome could be a 160% gain from the current level.
Conclusion
The current relatively high CAPE ratio of 30.1 and the elevated level of S&P-real relative to its long-term trend line suggest that the S&P 500 could decline over the shorter term. However, the current CAPE-MA35 ratio of 1.25 still forecasts reasonably good 10-year forward returns for the stock market.
Large drawdowns are always possible during a 10-year look-ahead period. Investments can be protected by following signals from various market-timing models at iMarketSignals. It is also important to know when a recession is looming, because stocks usually do poorly during recession periods. Our Business Cycle Index should provide early warning of an oncoming recession.
Appendix A
The best fit line and prediction band were calculated from monthly data from Jan-1871 to July-2012. The SP-real values for the period after July-2012 are “out of sample” and were not included in the regression analysis.
The equation of the best fit line is y = 10(ax+b)
y = is the dependent variable of the best fit line.
x = are the number of months from January 1871 onwards.
a = 0.0023112648
b = 2.02423522
Excellent! Thank you, sir.