
- The iM-Country Rotation System periodically selects one country ETF from six countries, USA, Canada, Japan, Australia, Germany and Sweden, based on the performance of their respective currency ETFs.
- Backtests from 2009 to 2018 (the bull market period) show that each foreign country ETF under-performed the US stock market over the full backtest period.
- However, when periodically selecting ETFs using a ranking system based on the performance of the countries’ respective currency ETFs, the model significantly out-performed the US stock market.
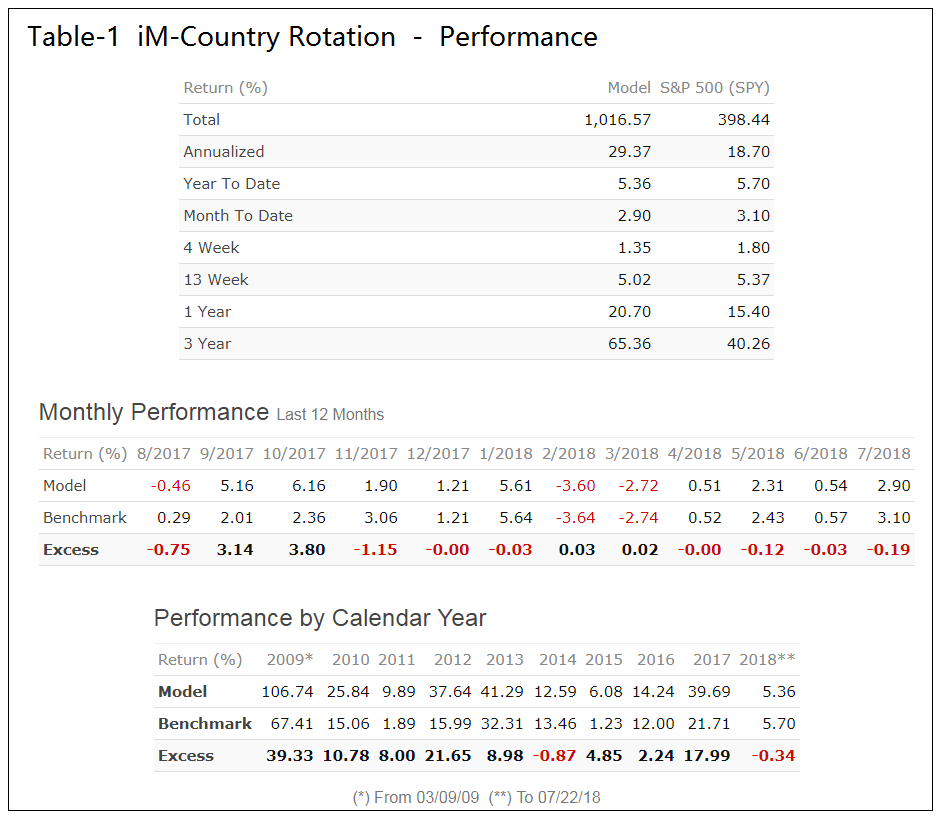
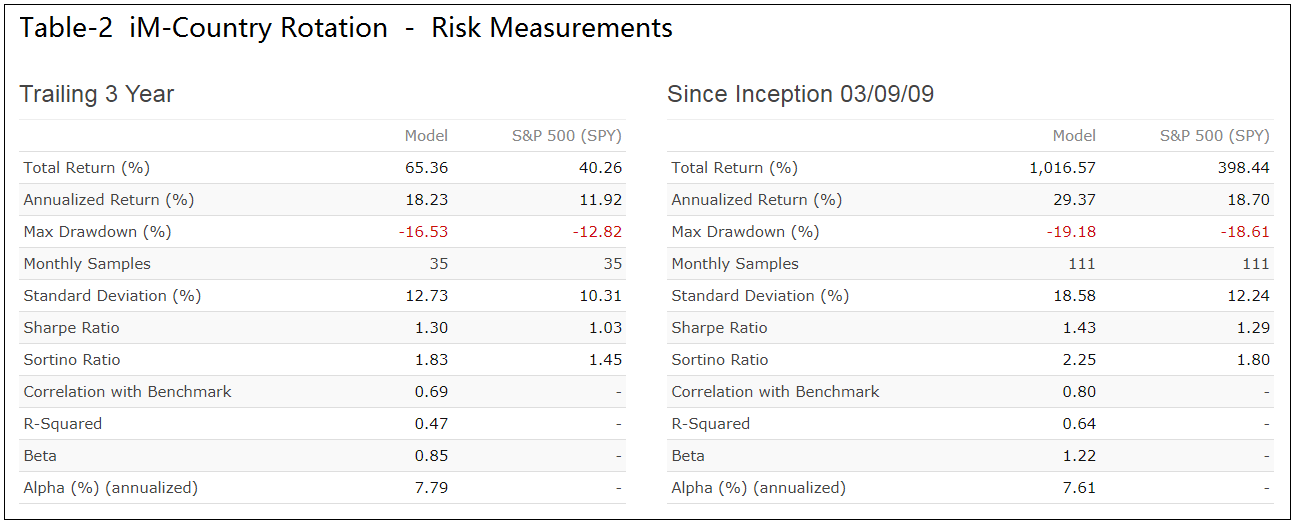
- Over the period 3/9/2009-7/21/2018 the system showed a simulated annualized return of 29.4% versus 18.7% for the SPDR S&P 500 ETF Trust (SPY), with similar maximum draw-downs of about -19%.
Model Philosophy
This model invests periodically in only one country ETF of the six available for trading. The selection is based on the performance of the respective currency ETFs over a one year period.
EDIT: FXS ceased trading on 02/14/20, thus the Sweden ETF (EWD) is no longer included in this model.
| Country | ETF |
| USA | SPDR S&P 500 ETF Trust (SPY) |
| Canada | iShares MSCI Canada ETF (EWC) |
| Japan | WisdomTree Japan Hedged Equity Fund (DXJ) |
| Australia | iShares MSCI Australia ETF (EWA) |
| Germany | iShares MSCI Germany ETF (EWG) |
| Sweden | iShares MSCI Sweden ETF (EWD) |
Note: Countries such as China and Switzerland which are monitored by the US Treasury Department for currency manipulation are excluded. Also the United Kingdom is not represented due to the “Brexit” effect on its currency.
| Country | Currency ETF |
| USA | Invesco DB US Dollar Index Bullish Fund (UUP) |
| Canada | Invesco CurrencyShares Canadian Dollar Trust (FXC) |
| Japan | Invesco CurrencyShares Japanese Yen Trust (FXY) |
| Australia | Invesco CurrencyShares Australian Dollar Trust (FXA) |
| Germany | Invesco CurrencyShares Euro Trust (FXE) |
| Sweden | Invesco CurrencyShares Swedish Krona Trust (FXS) |
Ranking System
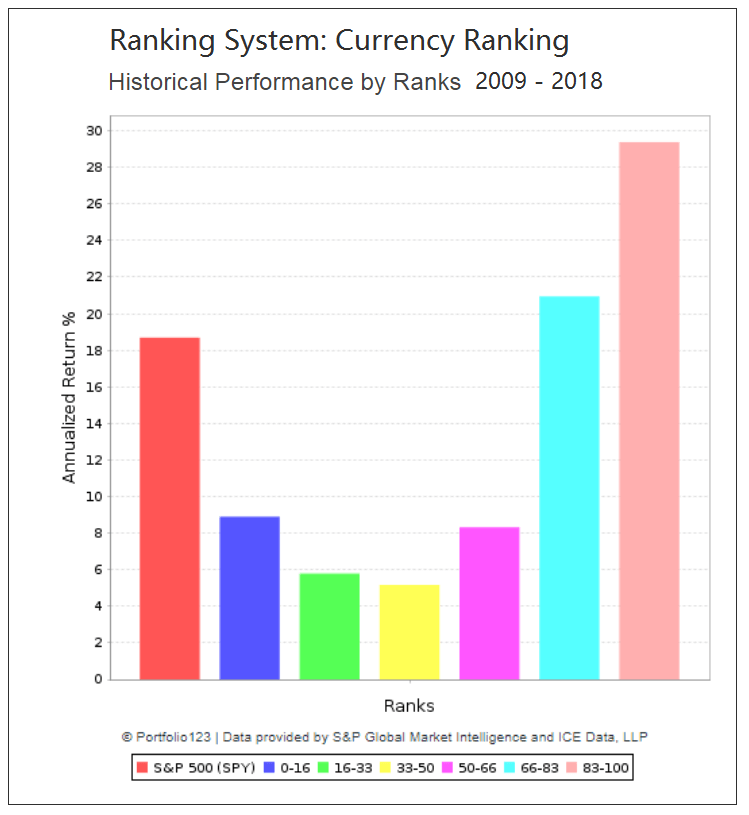
The performance indicated by the ranking system for the six country ETF universe is shown below. The ranking system ranks the six country ETFs according to the 1-year performance of their respective currency ETFs, lower being better. There are six “buckets” each holding one country ETF. Accordingly, selecting periodically the highest ranked ETF would produce an annualized return of about 29% over the period 2009-2018, which is the same return the simulation produced (Figure-2).
Performance of the Country ETFs versus SPY
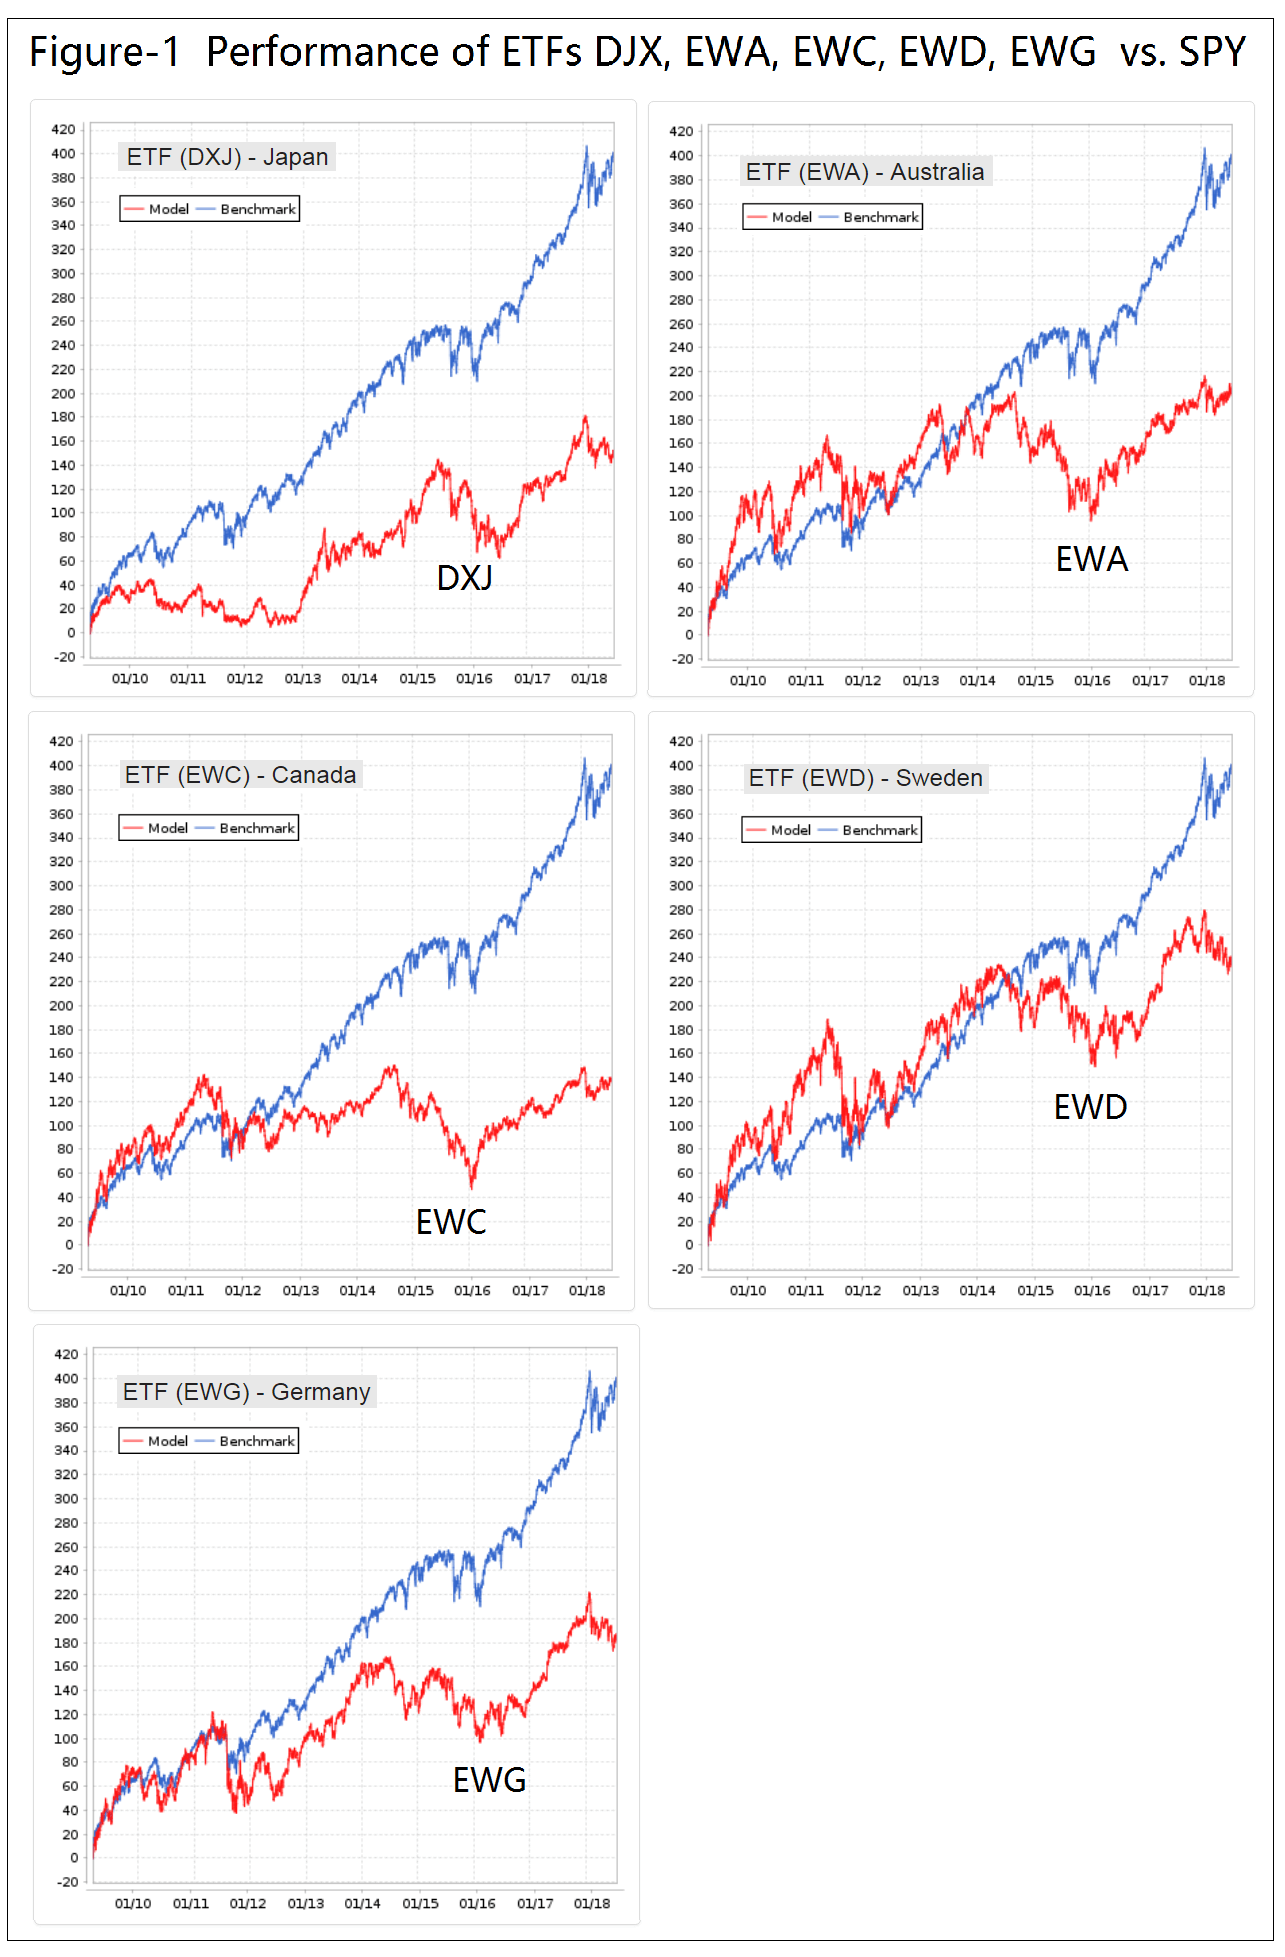
Figure-1 shows the performance of the five country ETFs representing Japan, Australia, Canada, Sweden and Germany versus the benchmark ETF (SPY). One can see that all five ETFs under-performed the benchmark by a wide margin over the full backtest period. However, there are shorter periods when some of them performed better than the benchmark.
Performance of the iM-Country Rotation System
In Figure-2 below the red graph represents the model and the blue graph depicts the performance of the benchmark, the SPDR S&P 500 ETF (SPY). The model is always fully invested, with no market timing.
When ranking country ETFs according to the performance of their respective currency ETFs and periodically selecting the highest ranked ETF, the rotation system significantly out-performed the benchmark (SPY). The simulation shows almost a 30% average annualized return over the preceding 9 years, or a total return 2.5 times greater than for (SPY), with similar maximum drawdowns of about -19%.

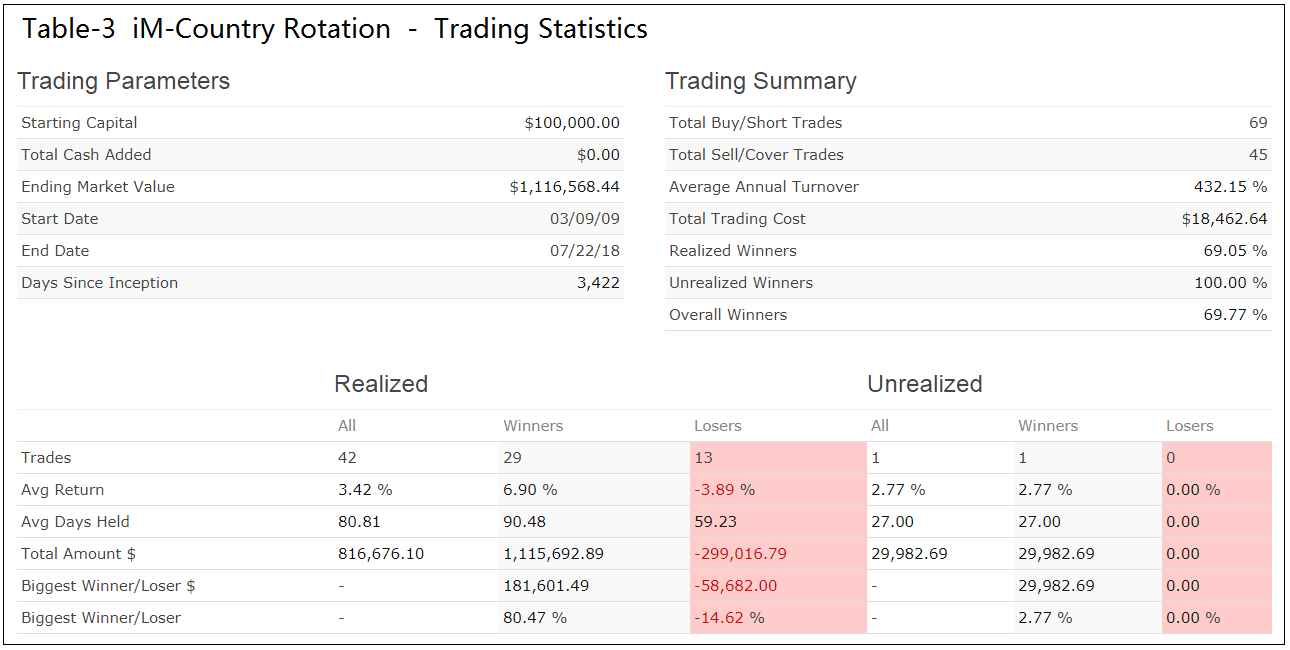
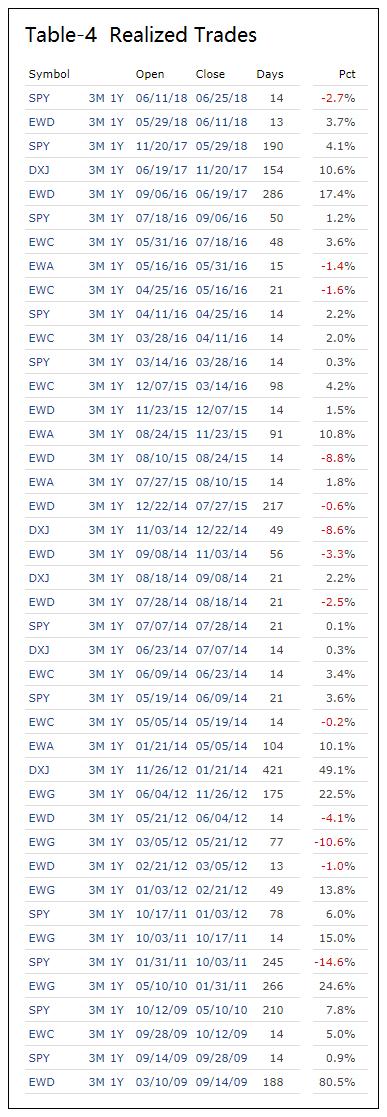
The iM-Country Rotation System was backtested on the on-line simulation platform Portfolio 123. Trading costs, including slippage, were assumed as 0.05% of the trade amounts using closing prices. Tables 1-4 in the Appendix provide Performance Details, Risk Measurements, Trading Statistics and a listing of the Realized Trades.
Following the Models
A Silver membership is required to follow the weekly performance update of the iM-Country Rotation System. As of writing (7/26/2018) the current holding is EWD since 6/25/18 showing a return of 5.6%.
Disclaimer
The performance data shown represent past performance, which is not a guarantee of future results. Investment returns and portfolio value will fluctuate, so ETFs when sold may be worth more or less than their original cost. Future performance may be lower or higher than the performance data cited.
Appendix
Really good diversification outside of your existing strategies. Maybe i missed it… is there a safe asset option for when all the markets are tanking?
What if one only held small cap and cyclical/discretionary ADR’s from the country this model signals, and only during the seasonal months of November through April? Then only defensive/non-cyclical sector ADR’s from the country this model signals from May through October? could this amplify gains of this model? (Essentially we would be applying the Seaonal Rotation approach to this model.)
We would need those ETFs for each of the six countries used. They are available for the US, but I am not aware of any for the other 5 countries.
This is a very interesting strategy due to its simplicity. Why are you using the hedged DXJ rather than EWJ, when all the others are unhedged?
Returns are better with DXJ than for EWJ.
back of the envelope: looks like returns with EWJ still would have been 25%+
Tom C
You are close: model with EWJ return is 25.6%
Period 03/09/09 – 07/26/18
Benchmark S&P 500 (SPY)
Ranking System Currency Basket – with EWJ
Quick Stats as of 7/26/2018
Total Return 747.18%
Benchmark Return 404.96%
Active Return 342.22%
Annualized Return 25.58%
Annual Turnover 433.14%
Max Drawdown -21.19%
Benchmark Max Drawdown -18.61%
Overall Winners (28/43) 65.12%
Sharpe Ratio 1.26
Correlation with S&P 500 (SPY) 0.78
I was wondering why you used DXJ for Japan rather than the iShares EWJ (like you did for all of the other currencies)?
Thanks,
Dan
Sorry, I see that this was just answered.
Why did you choose these 6 countries to be in the model?
Developed countries only and free floating exchange rate are a requirement. The BRIC countries are not used, nor any of the currency manipulators, such as China and Switzerland.
Great performance. I’m sure you don’t have ETF history, but do you have any thoughts on how this might have performed during the big U.S.bear markets of 2001-03 and 2008-09, and on whether timing based on a S&P long/short signal overlaid on this might have helped?
Tom C
Drawdowns during US bear markets would be similar to SPY. Best to be out of stocks during those times. We have a special market timer (not on website) which would have kept one out of stocks for only two periods:
2/5/2001 to 3/31/2003 (784 days)
12/24/2007 to 3/23/2009 (455 days)
That IS a special market timer!!!
Hopefully it will work again when we get the next big down-market. Otherwise the Composite Market Timer should also work, but it has a lot more signals, 37 investment periods for SPY and 36 for IEF.
You could try running it with SH-RSP, that would cut the signals down to about 13?
Or like you did in one of your previous research notes run 1/2 using the RSP-SH signal and go short (SH), and the other 1/2 using the composite market timer and use IEF.
This one:
https://imarketsignals.com/2016/market-timing-with-etfs-sh-and-rs/
Tom C
Hi Georg
Is this special market timer now used on your site? I’d love to know which one it is
Thanks
This special market timer is not in our models that we continuously update on iM.
Would be nice to see this model going back further. Looks like the currency etf’s all began trading in 2007. Any chance of running the returns back as far as you can?
The ranking system ranks the six country ETFs according to the 1-year performance of their respective currency ETFs. The latest inception date for the currency ETFs is 3/1/2007 for UUP, which implies the earliest start date for the model of 3/1/2008.
Here are the corresponding performance stats:
Period 03/01/08 – 07/31/18
Benchmark S&P 500 (SPY)
Quick Stats as of 7/31/2018
Total Return 602.35%
Benchmark Return 160.05%
Active Return 442.30%
Annualized Return 20.58%
Annual Turnover 456.11%
Max Drawdown -53.80%
Benchmark Max Drawdown -51.48%
Overall Winners (32/52) 61.54%
Sharpe Ratio 0.96
Correlation with S&P 500 (SPY) 0.84
Can you please do a backtest in which you overlay the iM Composite Market Timer? In other words, have this model move into IEF when US markets signal an out?
Hi there – just so I’m clear on this model. The ranking system uses the country currency ETF, sorts that from lowest to highest 1-Yr return, and then buys the country ETF that had the lowest currency ETF return? Do I have that right?
yes, that is correct.
what is the investment thesis behind this? what i mean is, why does this methodology work?
This model is based on research from Credit Suisse.
page 14
https://publications.credit-suisse.com/tasks/render/file/?fileID=0E0A3525-EA60-2750-71CE20B5D14A7818
page 18
https://publications.credit-suisse.com/tasks/render/file/index.cfm?fileid=88E8354C-83E8-EB92-9D5BB956943025E0
Their research shows that equities performed best after
currency weakness, not strength.
Is there a minimum 2 week holding period before reassessment/reallocation? Would a longer interval provide less turnover with similar results?
Turnover is not that high. There would have been only 42 realized transactions, with an average holding period of 80 days.
17 trades were held for 2 weeks,
5 trades were held for 3 weeks,
20 trades were held for 7 weeks or longer.
Could the signals in this system be used as a substitute for the SPY periods in the SPY-SH.R1 model to improve its performance?
This system’s signals cannot be used in a market timing system such as SPY-SH.
What would performance be if you threw out 1st trade EWD 3/10/09 -9/14/09? In other words review performance from 9/14/09 start date.
Thanks
Period 09/14/09 – 10/03/18
Benchmark S&P 500 (SPY)
Quick Stats as of 10/3/2018
Total Return 510.23%
Benchmark Return 233.58%
Active Return 276.66%
Annualized Return 22.12%
Annual Turnover 428.41%
Max Drawdown -19.18%
Benchmark Max Drawdown -18.61%
Overall Winners (29/42) 69.05%
Sharpe Ratio 1.30
Does this model include a risk free or short asset in case all the etfs are in a down trend?
This model has no market timing in its algorithm. We have a number of market timing models, such as the Composite Market Timer, at iM which can be used to assess market risk.
How do the following IM models correlate? Country Rotation, Super Timer (with RSP instead of SPY), 5-ETF Trader with leverage, and VIX Timer with ZIV. How would a quad-combo like this perform in backtests?
Are you still planning on operating this system now that FXS has been retired?
Yes, we have updated the model accordingly.
When did it transact from SPY to DXJ? That trade is not indicated in the Recent Updates Page. Last shown trade is 11/6/23B buying SPY.
There was a typo on the website but reported correctly in our Sunday emails. Below the last year’s transactions
Did this strategy change? Shows BUY a REIT ETF called DXI?
It buys DXJ not DXI. Thank you for reporting the typo on the website. The email was correct.
By DJX do you actually mean DXJ? The site says DJX
DXJ is the symbol.