
- Prior to recession the yield curve becomes inverted, as indicated by the Forward Rate Ratio between the 2-year and 10-year U.S. Treasury yields (FRR2-10) being less than 1.00.
- Currently the FRR2-10 is 0.998 and the smoothed FRR2-10 is 1.016 signifying that US economic activity is near the end of the expansion phase of this business cycle.
- When FRR2-10 falls to near 1.00 the transition from expansion to boom occurs, as during boom times the Federal Funds Rate (FFR) is increased to slow the economy.
- After the boom period comes the recession, on average 14 months after the FRR2-10 becomes less than 1.00, and concurrently the FFR is lowered.
- An almost risk-free investment is to buy 2-year Treasury bonds when the FRR2-10 is close to 1.0 and to sell when the FFR is at its lowest after recessions.
It is well known that an interest rate environment in which long-term debt instruments have a lower yield than short-term debt instruments of the same credit quality is considered to be a predictor of recessions. It is reasonable to assume that a similar pattern will prevail in advance of future contractions of the economy.
This model uses the 2-year and 10-year U.S. Treasury yields as measures of short-term and long-term rates, respectively, and calculates the Forward Rate Ratio (FRR2-10) between the two rates. (For the formula see the Appendix in the linked article.) An upward positive slope of the graphed FFR2-10 indicates a widening spread between the two rates, and a downward negative slope indicates the opposite.
FRR2-10 is the rate at which one can lock in borrowing for the eight year period starting two years from now, divided by the ten-year rate itself. A FRR2-10 greater than 1.00 indicates a yield curve with ten-year note yields higher than two-year note yields; a FRR2-10 less than 1.00 indicates an inversion of the yield curve when two-year note yields are higher than ten-year note yields.

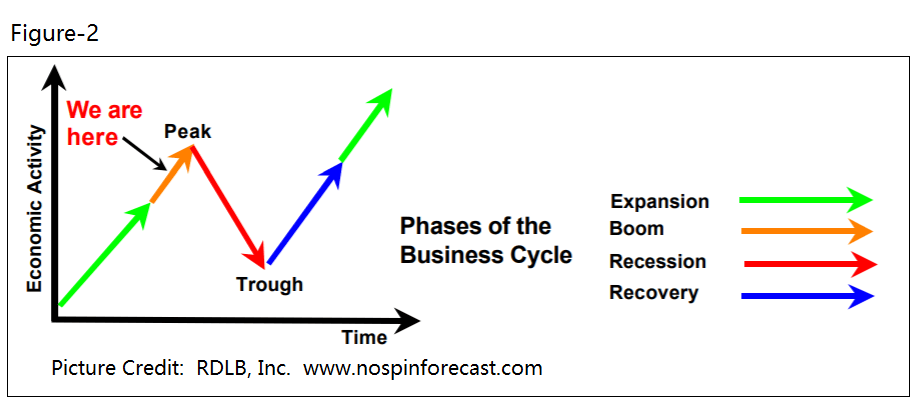
In Figure-1 the smoothed FRR2-10 and Federal Funds Rate are shown. One can see that the yield curve was inverted prior to the last seven recessions (the grey shaded areas in the chart). Currently (end of August 2019) the yield curve is inverted again, indicating that we are near the boom phase of the business cycle, not far away from the next recession, diagrammatically shown in Figure-2.
Also, one observes that the Federal Funds Rate is near a high when the yield curve inverts and then begins to fall before, during, and after recessions for some time. Currently the FFR has formed a peak, and our expectation is that it will drift lower as it did in the past. Also, usually when the FFR forms a trough the FRR2-10 peaks.
Investment Strategy
The proposed investment is the U.S. 2 Year Treasury Note bond or the iShares 1-3 Year Treasury Bond ETF (SHY) which has an Effective Duration of 1.85 years.
The fixed income investment is made when the Forward Rate Ratio between the 2- and 10-year yields becomes less than 1.00, and it is sold when the Federal Fund Rate has reached a low after a recession. In Figure-1 the buy- and sell signals are indicated by the green and red arrows, respectively.
Table-1 shows the beginning and end dates of the investments for the past seven “recessionary epochs”. The strategy always returned a profit, with annualized returns ranging from 5.9% to 15.8% over those periods. There were only two occasions when an investment in the S&P 500 with dividends would have had somewhat higher returns.
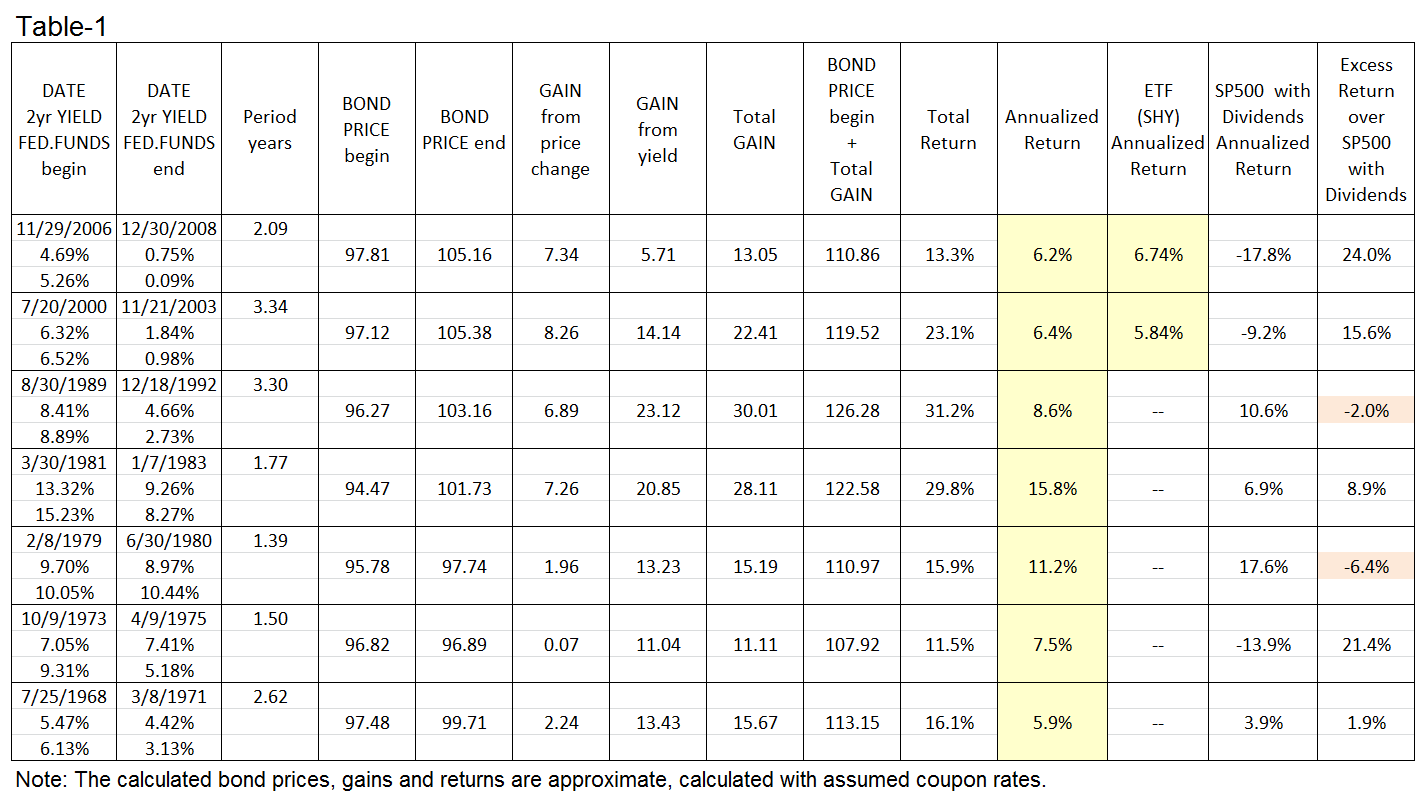
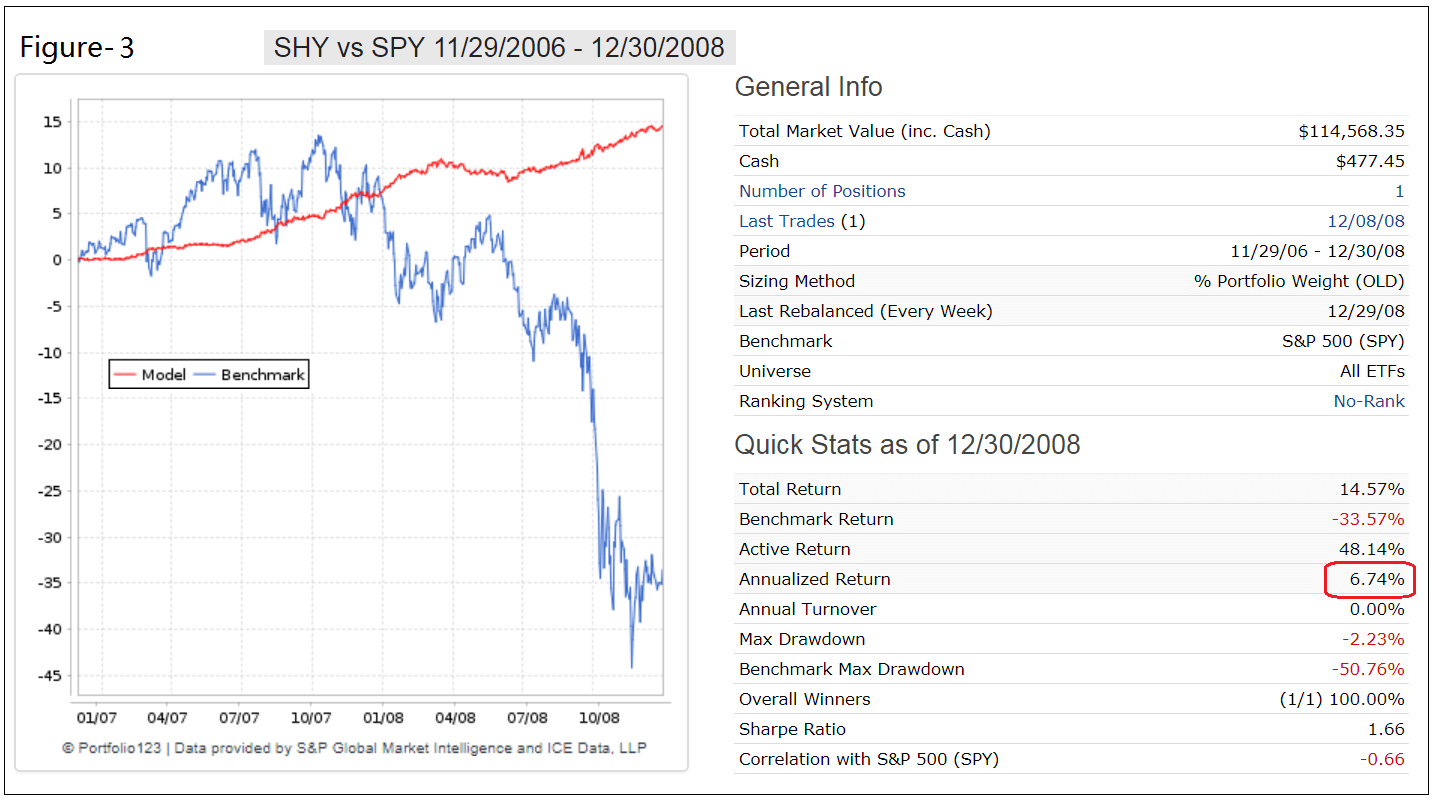
For the most recent two “recessionary epochs” the relative performance of SHY and the S&P500 ETF (SPY) is shown in Figures-3 and -4 in the Appendix. Note the maximum drawdowns of about -50% for SPY, versus about -2% for SHY.
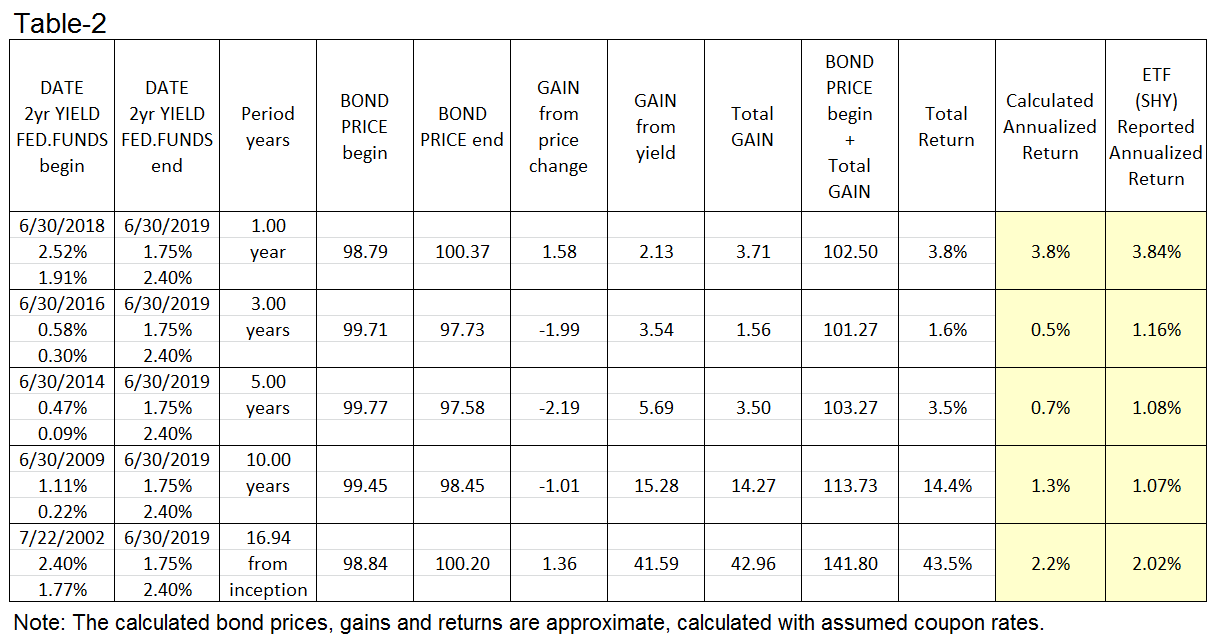
Also, for verification purposes actual returns of SHY for various periods are compared with returns calculated from the 2-year bond yields, Table-2 in the Appendix refers.
Conclusion
From the analysis it appears that relatively risk-free satisfactory returns can be had by investing in 2-yr Treasury bond funds prior to recessions when the yield curve inverts, and holding the investment until after recessions when the Federal Reserve is done with lowering the Federal Funds Rate.

This is hugely interesting. Thanks for the thoughts, the work and the post. Will this be routinely reported, and if so, what subscription level will be required?
There is not much to report. We only have to watch the Fed as they drop the Federal Funds Rate. It will probably go to zero again, which will produce nice profits for the 2-yr Treasuries.
Both the 2-10 and the EMA appear to be above the 1.0 black line. Is the graph updated with the 0.998 and 1.016 data points?
Both graphs are smoothed. The actual FRR2-10 was 0.998 at the update date.
Hello Georg. I’m having trouble replicating the Forward Rate that you’ve provided for the 31st of August. I’m assuming you’re using the numbers for the 30th (2yr = 0.0153; 10 = 0.015; on the 31st they were both 0.015 meaning the ratio is ~1) When I run those numbers through the equations you gave here: https://imarketsignals.com/2015/the-forward-rate-ratio-a-long-leading-recession-indicator/#appendix I get 0.995. Are you smoothing the treasury rates as well? Just doing my homework. Thanks.
The yields on the 30th you have are the closing yields. The chart was updated prior to closing using live values of the yields. That is why there is a small discrepancy; you have a FRR= 0.995, and the chart shows 0.998.
I might be mis-interpreting this, but how do we know that we reached a low FFR for the exit until after the fact? For example 12/30/2008. Wasn’t it possible the rate could have gone lower?
Tom C
We will soon have a weekly update for this model on iM using P123 which sells the bond fund when:
FEDFUND 10-day moving avg. / FEDFUND 50-day moving avg. > 1.05 and min hold is 90 days.
So, using this rule on the example above, when would the bond fund have sold on the 11/29/2006 SHY trade?
Thanks.
Tom C
Looks to me like you’d have to wait about 7 more years past 12/30/2008 to get out of the 2006 trade if I’m reading the chart right.
Please see our latest article on this:
“A Profitable Investment Strategy When The Yield Curve Inverts”
Thanks, Georg. Interesting post.
So what would your expected return for SHY be from here if the fed does cut short term rates to 0 again over, say, two years?
The starting SEC 30-day yield is 1.45 and the price rise would be the effective duration (1.9 yrs) times the rate drop (say, 2% max) over the time period, 3.8/2 years = 1.9% year? So annual return may be up to 1.45 + 1.9 = 3.4 [%/year] unless the rates drop faster or go negative?
Best regards,
Elliott
I agree with your figures, maybe a bit less, 1.45/2 + 1.9= 2.6% annualized return.
Please also see comments in Seeking Alpha article
https://seekingalpha.com/article/4289085-almost-risk-free-investment-yield-curve-inverts
Two related questions to read the plot better.
1. If the line that shows FRR2-10=1.00 is correct, why is the last FRR2-10=0.998 is above this line?
What are the numbers for the right axis?
Furthermore, perhaps the right axis has a linear scale.
On this chart both vertical scales are log10 scales.
Plotted is the Smoothed Forward Rate Ratio 2-10, which was 1.016 at the last update – see top right hand corner of the chart.
Thanks. So, given that the previous Buy Signal marks shown on the graph were also based on the smoothed curves (and not the actual values), would it mean it is not yet time to buy based on this model?
The original model was designed to provide signals for oncoming recessions with reasonable lead times. In this article it was used to demonstrate that investment in short Treasuries would have been beneficial when made according to these signals.
Currently it would have been better to buy Treasuries in Jan-2019 before the Fed began to reduce the Federal Funds Rate.
the link on the front page labelled ‘iM Bond Market Trader’ takes you to this page. i think you linked the wrong post
Thanks Randy, mentioned link now updated to iM-Bond Market Timer