
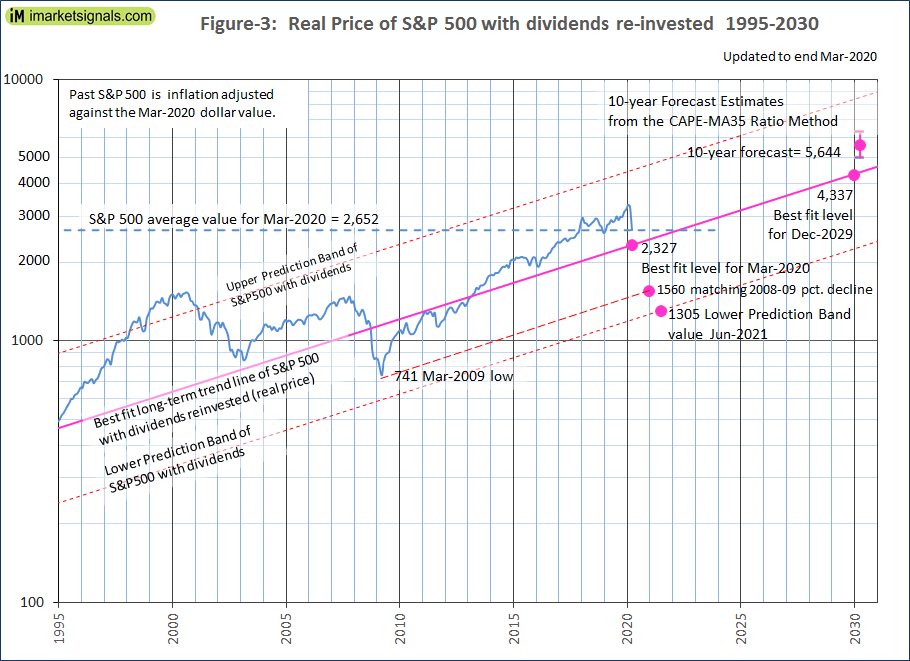
- The average of S&P500 for March-2020 was 2652. A 12% decline, or 325 point drop, would bring it to 2327, the end of March level of the long-term trend line.
- A recession appears to be imminent. Stocks could lose up to 50% if the S&P reaches the lower prediction band line of the long-term trend.
- If the percentage decline matches the loss during 2009-09 recession then the S&P500 could reach a low of 1560, a decline of about 35% from the current value.
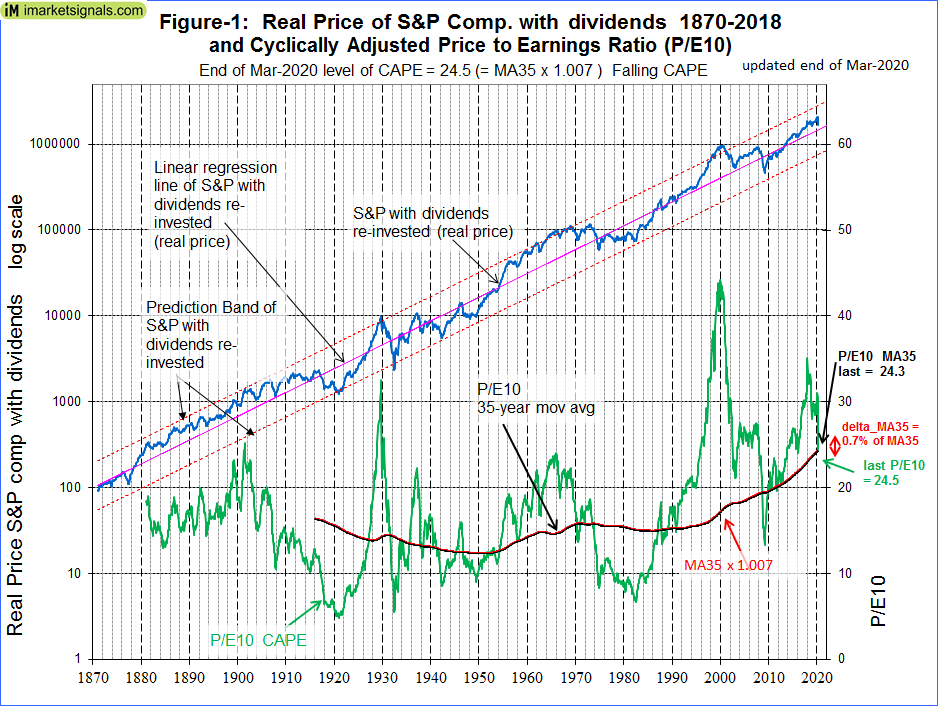
- The Shiller Cyclically Adjusted Price to Earnings Ratio (CAPE) is at a level of 24.5, almost identical to the 35-year moving average (MA35) of the CAPE of 24.3.
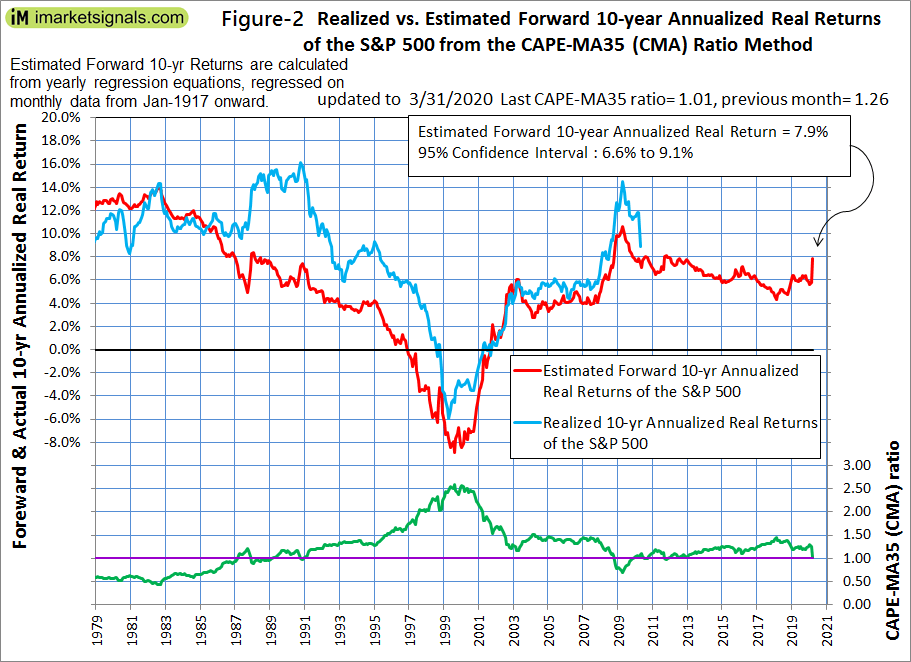
- The CAPE-MA35 ratio is 1.01, forecasting a 10-year annualized real return of 7.9%. Should the CAPE-MA35 ratio decline further then 10-year forward returns will be higher.
The projections in this article are partly based on Estimating Forward 10-Year Stock Market Returns using the Shiller CAPE Ratio and its 35-Year Moving Average, which is referred to as the “referenced article” further down.
What short-term stock market returns can be expected?
Nobody knows, and the best one can do is to use the historic data (which is from Shiller’s S&P series) to guide us to make estimates for the future. From the real price of the S&P-Composite with dividends re-invested (S&P-real) one finds that the best-fit line from 1871 onward is a straight line when plotted to a semi-log scale. There is no reason to believe that this long-term trend of S&P-real will be interrupted. S&P-real, updated to end of Mar-2020, and the best fit line together with its 95% prediction bands are shown in Figure-1. (See appendix for the equation.)
The current level of the S&P-real is not particularly low. It is still above the long-term trend line, and a reversal to the mean trend would entail a further 12% decline, possibly over a short period.
Effect of imminent recession
Our Business Cycle Index and the Unemployment Rate recession indicators are forecasting an imminent recession which could lead to further losses for equities.
Over the shorter term, if the S&P-real reaches the lower prediction band line, as it did in 1920, 1932, 1942, and 1983, then the value of S&P500 could get as low as 1300. This would constitute a 50% drop from the current average March level of 2652. If the impending recession produces a similar percentage loss for equities as observed during the 2008-09 recession then the S&P500 could reach a low of 1560, all as shown in Figure-3 below.
Forecasting 10-year stock market returns with the CAPE-MA35 Ratio
Also shown in Figure-1 are the CAPE (which is the S&P-real divided by the average of the real earnings over the preceding 10 years) and its 35-year moving average, having end of March values of 24.5 and 24.3, respectively.
As shown in the referenced article, a superior method to the standard use of the Shiller CAPE-ratio is to predict 10-year real returns using the CAPE-MA35 ratio as a valuation measure. It is simply the value of the Shiller CAPE-ratio divided by the corresponding value of its 35-year moving average (24.5 / 24.3 = 1.01).
Currently, for the 10-year period to Mar-2030, the CAPE-MA35 ratio of 1.01 forecasts an annualized real return of 7.9% (see Figure-2 in the referenced article). For the S&P-real adjusted to the current S&P500 value this would indicating a Mar-2030 value of 5644, with upper and lower confidence values of 6300 and 5000, respectively, all as shown in Figures-2 and -3.
Forecasting returns to 2030 with the long-term trend
When extending the best fit line and the prediction bands to 2030 (Figure-3) it enables to estimate the change of S&P-real from the current level of 2652. The end of Mar-2020 value of S&P-real as indicated by the best fit line is at 2327, about 12% lower than actual average March value. In Dec-2029, the value of S&P-real should be about 4300, while the highest and lowest values shown by the prediction bands would be 8400 and 2200, respectively.
Thus the historic trend forecasts a probable gain of about 60% for S&P-real to Dec-2029. The worst case scenario would be a possible loss of about 15%, and the best outcome could be a 220% gain from the current level of 2652.
Conclusion
The current CAPE-MA35 ratio of 1.01 forecasts relatively high real 10-year forward returns for equities of about 7.9%. Should the market continue to decline it will provide excellent investment opportunities for long-term investors because the 10-year forward returns should become increasingly better. For example, during the 2008-09 recession the CAPE-MA35 ratio reached a low of about 0.70 in March and April 2009, and the realized real annualized 10-year return for stocks that followed was a about 14%. Similarly, for the period 1980 to 1990 when the CAPE-MA35 ratio was less than 1.00 the realized real annualized 10-year returns that followed exceeded 10%.
Monthly updates of estimated 10-year forward returns are posted at iMarketSignals.
Appendix
The best fit line and prediction band were calculated from monthly data from Jan-1871 to July-2012. The SP-real values for the period after July-2012 are “out of sample” and were not included in the regression analysis.
The equation of the best fit line is y = 10(ax+b)
y = is the dependent variable of the best fit line.
x = are the number of months from January 1871 onwards.
a = 0.0023112648
b = 2.02423522
Leave a Reply
You must be logged in to post a comment.