
Approximately five years ago we launched at iMarketSignals the four quarterly displaced iM-Best12(USMV)Qx, x=1, 2, 3 or 4, investor models each holding 12 positions. The purpose of these models was to check whether our hypothesis (that a portfolio of top ranked USMV stocks in each of the four models will provide higher returns than the underlying ETF) is supported by the actual performances of the models over a longer period of time.
USMV’s inception was Oct-20-2011, and by end of Jun-2014 when we launched the first quarterly model the fund’s net assets were about $2.7-billion. Now, five years later, the fund’s current net assets had increased 10-fold to $28.6-billion, attesting to this ETF’s popularity.
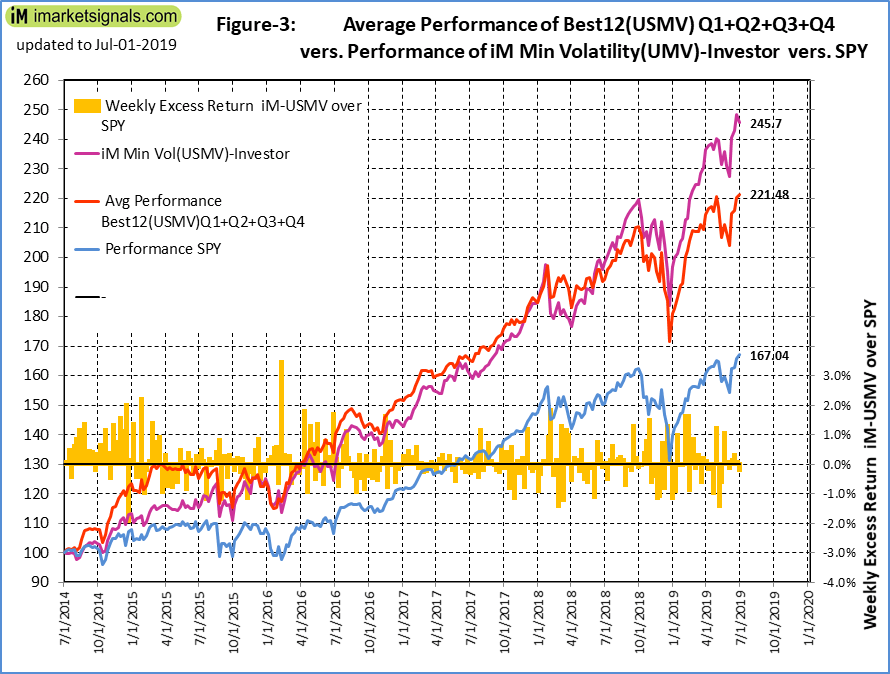
Over the last five years the performance of iM-Best12(USMV)Q1+Q2+Q3+Q4-Investor resulted in an excess return of 34.8% over USMV and 54.5% over SPY, thus corroborating our initial hypothesis. (Figure-3 in the Appendix-A refers.)
Over time the holdings of the four models have converged to hold only 18 different stocks between them, so future performance of each of the models is expected to be very similar. There is not much to be gained by following four similar models and we will be replacing them with the iM Min Volatility(USMV)-Investor. This model holds 10 equal weighted stocks from the iShares MSCI USA Minimum Volatility ETF (USMV), rebalanced every 13 weeks, and retains a position for a one year minimum period. Every three months the stock universe from which stocks are selected will be updated to correspond to the then current holdings of USMV.
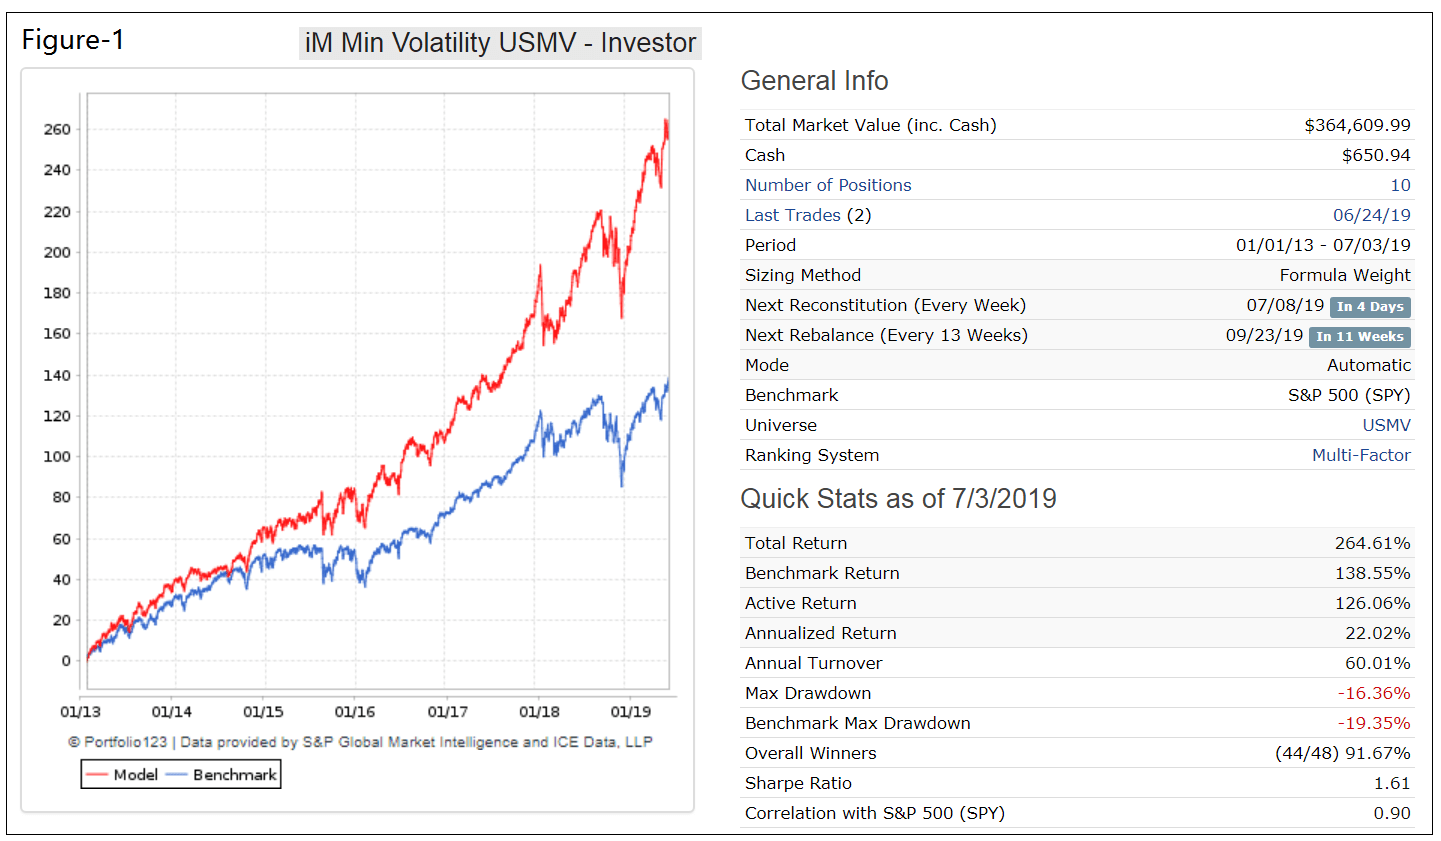
The iM Min Volatility USMV – Investor.
We have backtested this model from Jan-2013 onward with point-in-time data of USMV’s holdings. The simulated performance is shown in Figure-1 relative to the benchmark SPY. Over 6.5 years the model would have produced about double the total return of SPY. Estimated trading cost and slippage were taken into account.
Since inception the simulation shows an annualized return of 22.0% versus 14.3% for SPY and an annual turnover ratio of 60%. There were only 38 realized trades with an average holding period of 481 days.
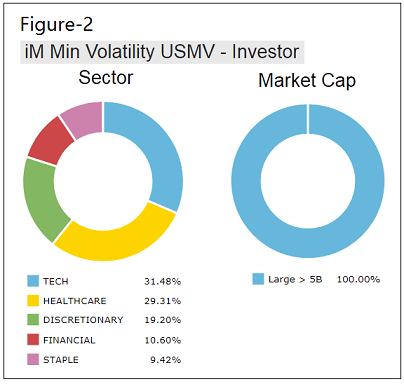
The model currently only holds large-cap stocks in five sectors, as shown in Figure-2.
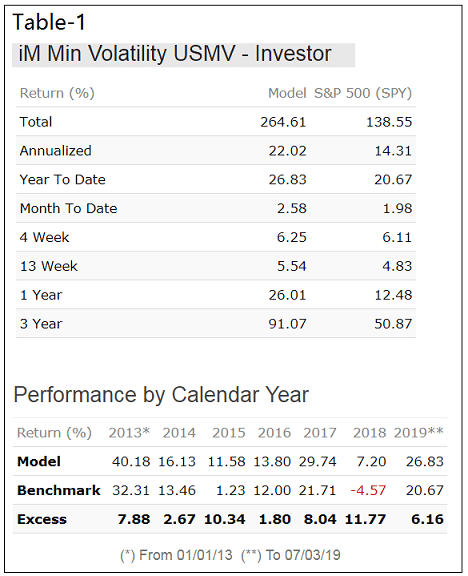
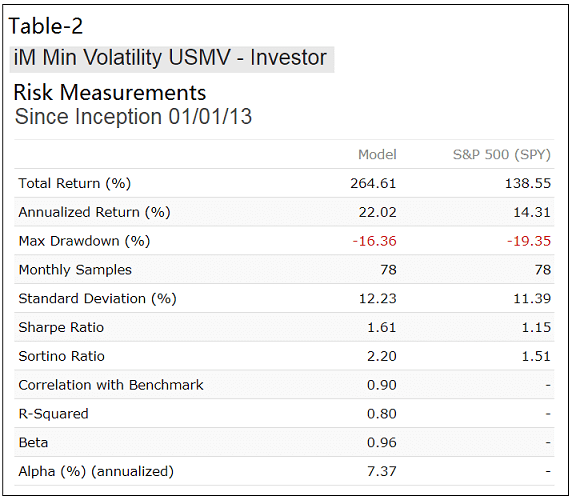
The historic performance statistics are in Table-1, and the risk measurements are in Table-2.
Current Holdings (7/5/2008)
| Ticker | Weight | Buy Date | Qty. Shares | Avg. Buy Price incl. fees |
Costs incl. fees |
Value now | Gain to date |
| HD | 9.95% | 1/12/15 | 171 | $105.13 | $17,977 | $36,269 | $18,292 |
| ROST | 9.22% | 5/11/15 | 336 | $48.04 | $16,141 | $33,600 | $17,459 |
| CDNS | 11.37% | 3/27/17 | 554 | $24.81 | $13,746 | $41,445 | $27,699 |
| MSFT | 10.48% | 6/11/18 | 278 | $101.16 | $28,123 | $38,214 | $10,091 |
| JNJ | 9.40% | 10/8/18 | 241 | $139.12 | $33,529 | $34,256 | $727 |
| LLY | 9.57% | 11/12/18 | 305 | $114.80 | $35,013 | $34,898 | -$115 |
| PEP | 9.41% | 11/19/18 | 256 | $121.88 | $31,201 | $34,301 | $3,101 |
| CSCO | 9.57% | 12/3/18 | 618 | $47.51 | $29,359 | $34,905 | $5,545 |
| BAX | 10.29% | 3/4/19 | 457 | $75.56 | $34,529 | $37,506 | $2,977 |
| AFG | 10.58% | 6/17/19 | 366 | $103.59 | $37,915 | $38,565 | $650 |
Note the buy dates. The minimum one year holding period is timed from the dates listed.
Following the model
At our website iMarketSignals one can follow the performance of this model, updated weekly.
Disclaimer
One should be aware that all results shown are from a simulation and not from actual trading. They are presented for informational and educational purposes only and shall not be construed as advice to invest in any assets.
Appendix-A
Figure-3 shows the actual historic performance of iM-Best12(USMV)Q1+Q2+Q3+Q4-Investor comapred to SPY. Also plotted is the simulated performance of iM Min Volatility(USMV)-Investor
is the model always long? is there any risk management for bear markets?
thanks
This model is always long. We have plenty of market timer models and recession indicators at iM to provide timely signals to get out of stocks.
Looks like a real improvement and a simplification as well. Thanks. The table of correlations you did a few years ago was very helpful. Would it be possible to put together an updated table covering this strategy and some others that weren’t in the last table? VDIGX trader, VIX/ZIV, 7 HiD LoV, 5 ETF Trader leveraged, 12 USMV Trader for example.
Thanks, much appreciated
Any chance you can add SPY or equivalent to the above table?
Will this model continue to have a rule to sell a position if it declines 15% from its high mark?
Is there any draw down protection in lieu of the 15% rule? The original USMV 12’s had the 15% rule did they not?
We have added a rule to sell if return of an existing position is less than -15% (dividends are not included). i.e. sell a position if it gained less than -15% from buy price.
This improved 2013-2019 simulated annualized return by about 0.5% and resulted in two sales.
Ok, many thanks. This implies that the 1 year minimum holding period will remain, and you check in after 1 year, and if the gain is less than -15% you replace it, correct?
No, that’s not correct. A position will be sold if the gain is less than -15% irrespective of the holding period.
i’d like to propose a model just like this, but for a small cap low-vol fund, such as XSLV. the results could be extraordinary. check out this article from Ploutos on seeking alpha, you will see what I mean:
https://seekingalpha.com/article/4282630-favorite-market-dataset
Historical holdings are not available from the ETF provider’s website, therefore cannot run a point-in-time backtest.
hi Georg,
How about combining this model together with Composite Timer or super timer? For example, in between Oct 2018 and Jan 2019, when signal from composite timer is to sell SPY and buy IEF, we sell all holding position and then buy IEF? Would like to know this performance and the max D/D since 2013. Thank you!
this would be interesting. i’m guessing you could probably just implement it yourself. the analysis above says that the correlation with SPY is 0.90. I plan on using one of those timers as a hedge for this strategy
This model is intended to be tax efficient.
Why the model table is no longer present in the first list ?
It is there.
Is this model not updated anymore? All I see is IM Best 12 USMV trader! The USMV investor outperforms the trader model. Thanks!
This model is updated weekly.
Can I get trades spreadsheet for this model?
Thank you,
John
Symbol … Open … Close … Days … Pct
LMT … 02/26/2018 … 03/04/2019 … 371 … -7.80%
HUM … 09/25/2017 … 11/12/2018 … 413 … 42.00%
MRK … 09/11/2017 … 11/19/2018 … 434 … 21.00%
VMW … 07/03/2017 … 12/03/2018 … 518 … 90.10%
MDT … 05/08/2017 … 06/11/2018 … 399 … 4.80%
PEP … 02/13/2017 … 10/08/2018 … 602 … 1.00%
UPS … 09/19/2016 … 09/25/2017 … 371 … 10.10%
SNPS … 07/18/2016 … 02/26/2018 … 588 … 57.00%
ABT … 02/22/2016 … 05/08/2017 … 441 … 13.10%
VMW … 02/08/2016 … 03/27/2017 … 413 … 105.30%
INTU … 02/08/2016 … 07/03/2017 … 511 … 44.50%
MRK … 01/19/2016 … 02/13/2017 … 391 … 25.90%
AMGN … 09/14/2015 … 09/19/2016 … 371 … 13.50%
MSI … 07/13/2015 … 07/18/2016 … 371 … 15.30%
ACN … 02/02/2015 … 02/08/2016 … 371 … 10.50%
CAH … 02/02/2015 … 02/08/2016 … 371 … -8.20%
SHW … 01/12/2015 … 07/31/2017 … 931 … 27.80%
ABT … 01/12/2015 … 01/19/2016 … 372 … -11.40%
ANSS … 07/07/2014 … 07/13/2015 … 371 … 21.10%
UPS … 05/05/2014 … 05/11/2015 … 371 … 2.50%
LLY … 01/06/2014 … 01/12/2015 … 371 … 34.40%
PEP … 01/06/2014 … 02/22/2016 … 777 … 21.10%
CHD … 01/06/2014 … 01/12/2015 … 371 … 20.70%
SNPS … 01/06/2014 … 09/14/2015 … 616 … 18.20%
MSFT … 01/06/2014 … 02/02/2015 … 392 … 14.00%
HSY … 01/06/2014 … 01/12/2015 … 371 … 10.10%
PFE … 01/06/2014 … 02/02/2015 … 392 … 3.70%
TJX … 01/02/2013 … 06/17/2019 … 2357 … 88.30%
CELG … 01/02/2013 … 01/06/2014 … 369 … 100.10%
ATVI … 01/02/2013 … 01/06/2014 … 369 … 64.60%
MDT … 01/02/2013 … 01/06/2014 … 369 … 41.10%
ROST … 01/02/2013 … 01/06/2014 … 369 … 35.90%
HD … 01/02/2013 … 07/07/2014 … 551 … 23.50%
MRK … 01/02/2013 … 01/06/2014 … 369 … 17.90%
MSI … 01/02/2013 … 05/05/2014 … 488 … 16.20%
WMT … 01/02/2013 … 01/06/2014 … 369 … 11.30%
ORCL … 01/02/2013 … 01/06/2014 … 369 … 9.10%
HI Georg,
Can you give the trades to bring this up to date.
Thanks,
T
hello Georg the backtest of these strategies (The iM Minimum Volatility (USMV) Investor and iM-Best10(VDIGX) Trader Positions ) involve the entry and exit position at the open or at Monday close ?
All our models use Monday closing prices.
Hi Georg and Anton What’s the updated(end of2019) sharpe ratio and max dd for this model ? Thanks
Period 1/1/2013 to 1/14/2020
Total Return …… 272.33%
Benchmark Return …… 163.92%
Active Return …… 108.41%
Annualized Return …… 20.53%
Annual Turnover …… 61.43%
Max Drawdown …… -16.36%
Benchmark Max Drawdown …… -19.35%
Overall Winners …… (44/52) 84.62%
Sharpe Ratio …… 1.56
Correlation with S&P 500 (SPY) …… 0.88
Hello,
Is there periodic rebalancing included in the returns? What is the trigger for a rebalance?
I was always taught to let the winners run
Thank you
Periodic rebalancing to equal weight every 13 weeks is included in the returns. The minimum rebalancing transaction for a position is specified as 1% of portfolio value.
Typically a position is held for at least one year, unless it shows a loss of 15% from when it was bought.
Given that a rebalance would trigger a small tax event, are the results much worse if the model does no rebalancing and keeps a -15% trailing stop loss?
can you give the annual returns for this model the last 15 years.
thanks,