- The system uses a composite model consisting of several market timers. It should deliver more reliable signals for profitable investment and saving plans than single market timing models.
- Component timers are allocated a 100% stock holding percentage when the timer signals investment in the stock market, or 0% when the timer it is out of the stock market.
- A weekly Stock Market Confidence Level (SMC level), which can range from 0% to 100%, is obtained by considering the percentage allocated to each component timer and the timer’s weight in the system.
- A backtest of a combination model of 15 iMarketSignals timers signaled avoidance of the stock market for SMC levels <=50%, while SMC levels >50% suggest better stock market investment climates.
The Component Market Timing Models
Two more market timing models have been added to the previous lineup of market timers. They are the CAPE-MA35 ratio (invested in stocks when the ratio is <= 1.0) and the Seasonal Strategy (invested in stocks from November to April) models.
The 15 component market timing models used are shown in Table-1. The table, updated every Sunday at iMarketSignals.com, shows which of the models are invested in stocks or not. Those invested in stocks have a stock holding percentage of 100%, and those out of the stock market of 0%. Combination models are given a holding percentage proportional to their current stock market investments.
An Importance Factor related to the performance of a model is also assigned. The iM-Stock Market Confidence Level (iM-SMC level) is calculated from the stock holding percentages and importance Factors of the models, rounded to the lowest number which is divisible by 5.
| Table-1 iM-Stock Market Confidence Level iM-SMC = 50% ( 3/11/2019 ) | |||||
| Update Frequency | Calculation Platform | Backtest from | iM-Market Timer Model | Model Importance Factor | Stock Holding |
| weekly | P123 | 2000 | Best(SPY-IEF) Market Timer Combo | 0.5 | 25% |
| weekly | P123 | 2000 | Best-Combo3.R1 | 1 | 50% |
| weekly | P123 | 2000 | Composite (SPY-IEF) Timer | 2.5 | 0% |
| weekly | P123 | 2000 | Composite (SH-RSP) Timer | 1 | 100% |
| weekly | P123 | 2000 | Standard Market Timer | 1 | 100% |
| monthly | Excel/P123 | 1953 | Inflation Timer | 1 | 100% |
| weekly | P123 | 2000 | 3-mo Hi-Lo Index Timer | 1 | 100% |
| weekly | P123 | 2000 | Low Frequency Timer | 0.5 | 100% |
| weekly | P123 | 2000 | Market Climate Grader | 1 | 50% |
| weekly | Excel | 1965 | MAC-US Timer | 1 | 100% |
| monthly | Excel | 1965 | Coppock Indicator for the S&P500 | 1 | 0% |
| monthly | Excel | 1950 | CAPE-Cycle-ID | 0.5 | 100% |
| monthly | Excel | 1979 | CAPE-MA35 Ratio | 0.5 | 0% |
| monthly | Excel/P123 | 1950 | Seasonal Strategy | 0.5 | 100% |
| monthly | excel | 2004 | iM-Google Trends | 1 | 0% |
Historic weekly levels and holding periods can be download here: im-smc_to_3-18-2019.xlsx
The iM-SMC Level and Stock Market Exposure
As shown in the original model description, a backtest for a model holding equity ETFs (stocks) during periods when the iM-SMC level was higher than 50% and invested in fixed income ETFs (bonds) during periods when the iM-SMC level was equal to or less than 50% produced the highest returns.
Performance of the iM-SuperTimer
Reconstituted weekly
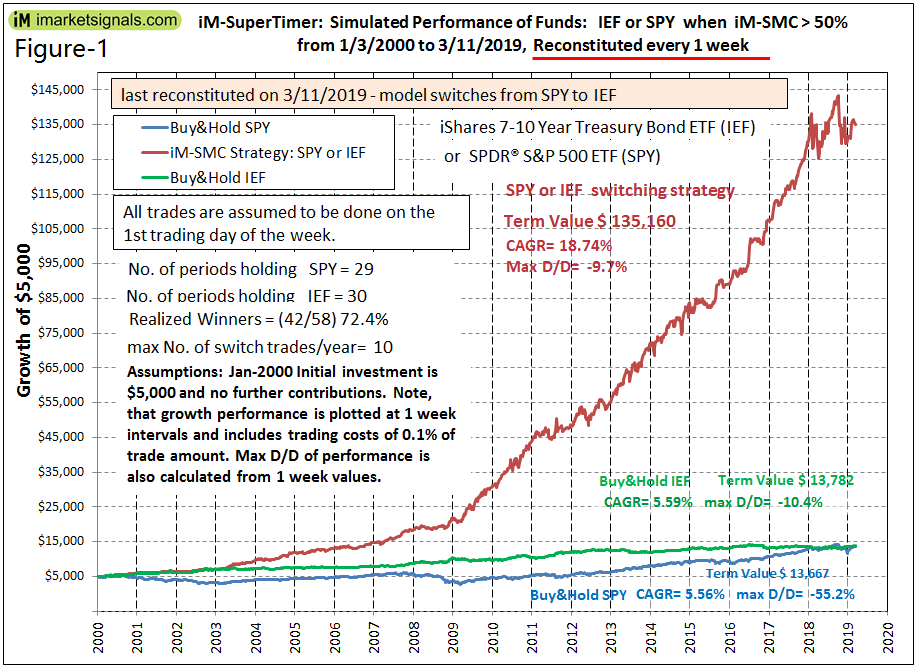
The performance of a SPY-IEF switching strategy from bond ETF (IEF) to equity ETF (SPY) when iM-SMC > 50% is shown in Figure-1. This strategy, was modelled in excel with weekly reconstitution, and performance includes trading costs of 0.1% of the total switch trade amounts.
For the period 1/3/2000 to 3/11/2019 the SPY-IEF model would have produced an annualized return of 18.7% with a max drawdown of about -10%. A buy-and-hold strategy of SPY or IEF had an annualized return of only 5.6% with a maximum drawdown of -55% and -10.4%, respectively, over the same period.
Since the iM-SMC level is available on Sundays, trading is assumed to occur on the first trading day of the week thereafter, usually a Monday. Trading should not be delayed by more than two or three days as the model’s annualized return diminishes then significantly.
| Trading Day | Annualized Return |
| 1st | 18.74% |
| 2nd | 17.83% |
| 3rd | 17.44% |
| 4th | 15.82% |
| 5th | 15.81% |
Performance of the iM-4wk-SuperTimer,
Reconstituted every 4 weeks
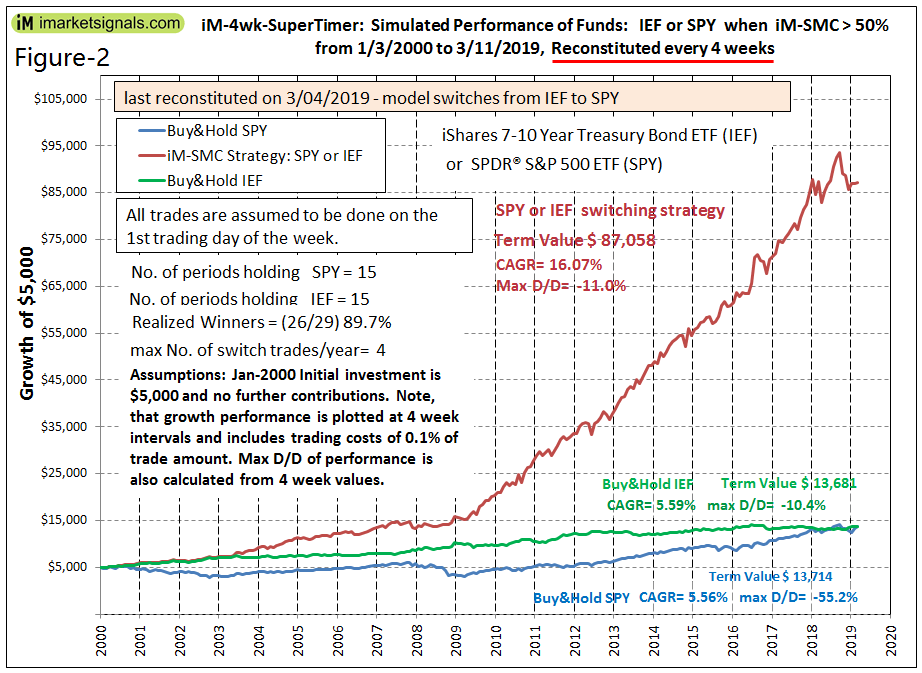
The performance of the switching strategy when the model is reconstituted ever 4 weeks is shown in Figure-2. The return is lower than for the model reconstituted weekly, but trading effort is reduced by half from that of the 1-week model. Trading should not be delayed by more than three days as the model’s annualized return diminishes then.
| Trading Day | Annualized Return |
| 1st | 16.07% |
| 2nd | 15.13% |
| 3rd | 15.24% |
| 4th | 14.36% |
| 5th | 14.08% |
Performance of the iM-13wk-SuperTimer,
Reconstituted every 13 weeks (3 months)
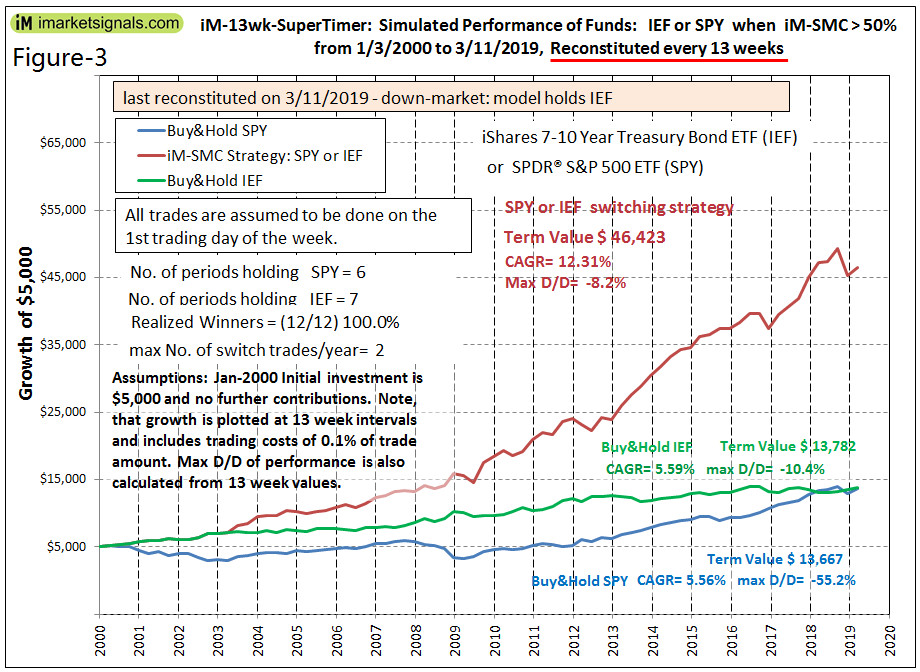
The performance of the switching strategy when the model is reconstituted ever 13 weeks is shown in Figure-3. The return is lower than for the model reconstituted weekly and every 4 weeks, but trading effort is significantly reduced since the 13-week model generated only a fourth of the trades of the 1-week model.
The model is very robust and trading can be delayed by up to two weeks before the model’s annualized return diminishes to any extent.
| Trading Day | Annualized Return |
| 1st | 12.31% |
| 2nd | 12.13% |
| 3rd | 12.04% |
| 4th | 11.95% |
| 5th | 11.54% |
| 4th | 11.95% |
| 6th | 11.54% |
| 8th | 11.49% |
| 10th | 11.66% |
| 12th | 11.41% |
| 15th | 10.86% |
| 20th | 11.22% |
| 25th | 10.00% |
| 30th | 10.38% |
The 13-week SuperTimer model could be of interest to participants in retirement savings plans and education savings plans where the number of asset allocation switches per year is limited. This model shows only 12 switch trades over the 19 year backtest period, with a maximum of two switches occurring in 2004 and 2006.
Despite this low trading frequency the model’s initial Jan-2000 investment would have grown from $5,000 to about $46,000 in 2019, for a total return of $41,000. This is an impressive performance. A buy-and-hold investment of $5,000 in SPY or IEF would have only grown to about $13,700 for a total return of $8,700 over the same period. So, following the few signals from the 13-week SuperTimer one would have added almost 5-times as much to one’s savings as one would have had from holding either SPY or IEF.
Conclusion
The backtests suggest that the iM-SuperTimer based on the Stock Market Confidence Level Strategy could provide useful trading signals for investors and savers.
At iMarketSignals we have provided weekly updates of the iM-Stock Market Confidence Level for longer than one year now. We are currently providing updates for the weekly reconstituted iM-SuperTimer model. We will also provide weekly updates for the iM-SuperTimer models which are reconstituted every 4 weeks and every 13 weeks. Figures 1, 2, and 3 will be updated monthly.
Disclaimer
The performance data shown represent past performance, which is not a guarantee of future results. Investment returns and portfolio value will fluctuate, and future signals from these models may not be as efficient as they were in the past.


Hi Georg,
great work again !
Can you give us a list of the dates (trades) for the weekly model?
Thank you.
The weekly email from last week indicated a BUY for SPY and a SELL for IEF. This agrees with the table above. However the weekly email that I just received (3/24/19) indicates that the weekly SuperTimer portfolio is in IEF since 2/25/19. Is one of these a mistake?
There is no mistake. The table above refers to the model which has a minimum holding period of 1 week.
The new 1wk SuperTimer holds a position for a min period of 5 weeks to avoid weekly back and forth trading. This eliminates the annoying short holding periods which a weekly timer can have and also improves returns.
If you want to trade according to the old timer on a weekly basis, there is nothing stopping you from following the weekly iM-Stock Market Confidence Level which signals up-market conditions when iM-SMC > 50%.
Thanks, this is great (and very thorough).
The 4 week returns are strong. So strong it makes me wonder if there could be any benefit to using Super-Timer to dial in a variable monthly combo SPY-IEF model (or Vanguard funds that simulate the same thing). Like 100% SMC would signal 80-20 stock bond, 0% SMC would be 20-80, and then interpolated in between (for example, 75% SMC would be 65/35, 50%, 50/50, 10% 26/74, etc). For those who don’t have fees for monthly switching in their IRAs. Kind of a variation on your flip timer.
Tom C
We will soon release a spreadsheet of the historic stock holding percentages of all the component models of the SuperTimer from which the Stock Market Confidence level is calculated.
Then members can use this to formulate their own investment strategies accordingly.
Hi Georg,
Given the different stock holding % from the indicators, how would you recommend going about which to choose?
Not investment advisors I understand, but perhaps a point in the right direction for how to digest the differences and what to make out of it?
In your Sunday home page update, looks like your revised Super timer links are pointing to “Seasonal Switching Strategy” instead of “Seasonal Strategy” on this page. Also, looks like your Super Timer link is pointing to the prior Super Timer page instead of this page.
Tom C
Georg,
thank you for the trade dates.
Very useful.
The list of trade dates above is very helpful. Would it be possible to associate the specific Confidence Level (SMC )percentage for each trade? Thanks
Historic weekly levels and holding periods can be download here: im-smc_to_3-18-2019.xlsx
Perfect. Thank you.
So, I took a quick look, is that right that the level never hit 100%? That is somewhat surprising to me.
Tom C
The numbers are what they are. Remember we have 15 timers in this, not counting the sub models.
Right, I would think it would be infrequent. I had noticed from eyeballing the graph of the original 13 factor model, 100% iM-SMC appears to have occurred on ten occasions. Four of those look to have been in the May-October timeframe, so the seasonal model would have knocked that down on those instances. The CAPE-MA35 not pointing to 100% stocks must be what knocked the others down.
Tom C
Hi Georg/Anton
Like this model. Could you possibly run it with SSO and IEF to see how performance and maximum drawdown changes please.
Thanks
Vman
To avoid weekly back and forth, have you thought of having a buffer of 1 or 2 points before changing weekly asset allocation, i.e bonds at 49 and stock at 51 , etc?
In future we will provide signals for a weekly SuperTimer model that holds a position for a minimum period of 5 weeks. This eliminates the annoying short holding periods which a weekly timer can have and also improves returns.
We will also make available a 1-month and a 3-month SuperTimer, which reconstitute on the first trading day in the first week of the month.
We will post an update description of this soon.
Where can I get the updated SMC level history since 2019 ? THANKS !