
Our first market timing system uses SPY (the ETF tracking the S&P 500) to generate trading signals for the stock market. This is a binary model, it either holds SPY or cash. We refined this model to iM-Best(SPY-SH) which switches to SH during adverse market conditions. However, we kept the Best(SPY) R2G model on P123 as one could deduct the holding as described below. Since mid October, 2013 the holding column was removed by P123 – thus this model serves no further purpose.
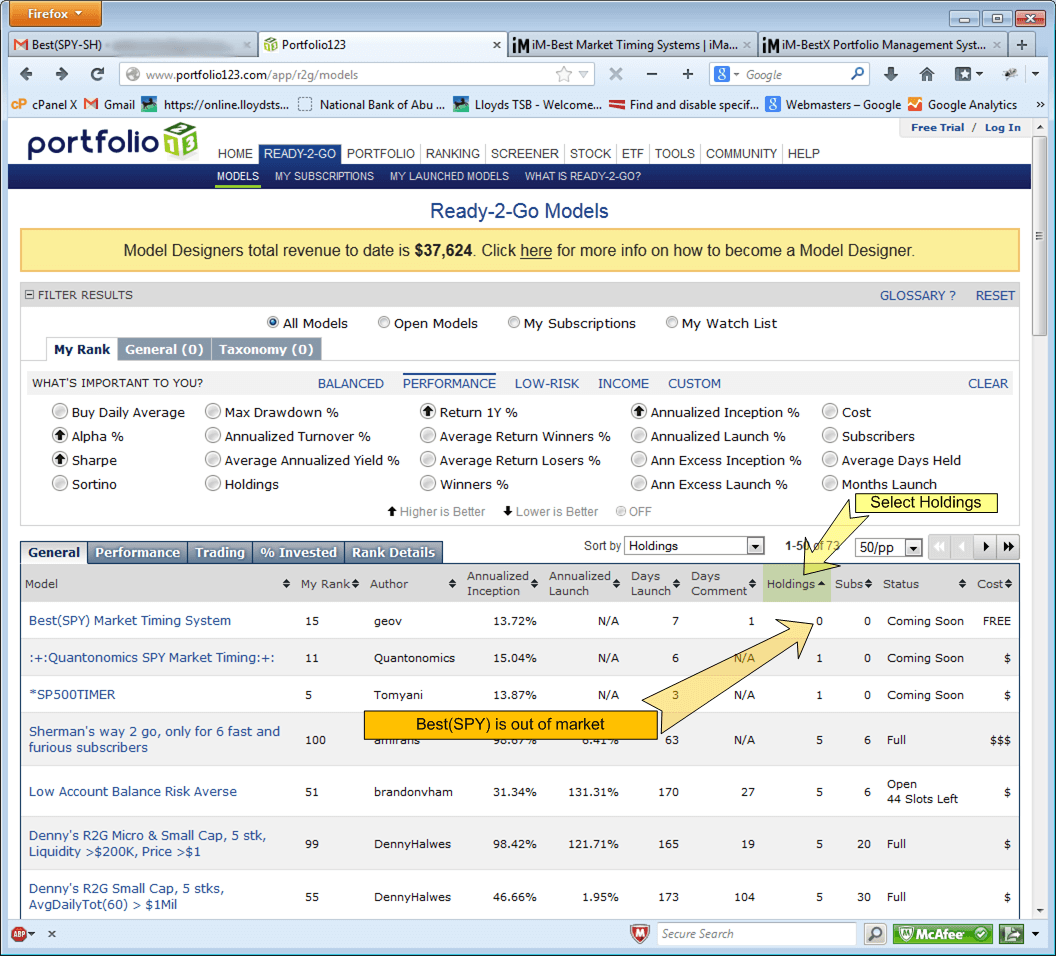 The Best(SPY) Market Timing Signals can be obtained from P123 without subscription. Monday morning, after the model has updated, open the Ready2Go page, and sort according to [Holdings] with least holdings first. The Market Timing models based on one ETF, i.e. SPY, will be listed first. Find the BEST(SPY) Market Timing Model and if holdings show ‘1’ then the model is in market, and if holdings show ’0′ then the model is out of the market.
This market timing system uses SPY (the ETF tracking the S&P 500) to generate trading signals for the stock market. This is a binary model – either IN or OUT of the market.
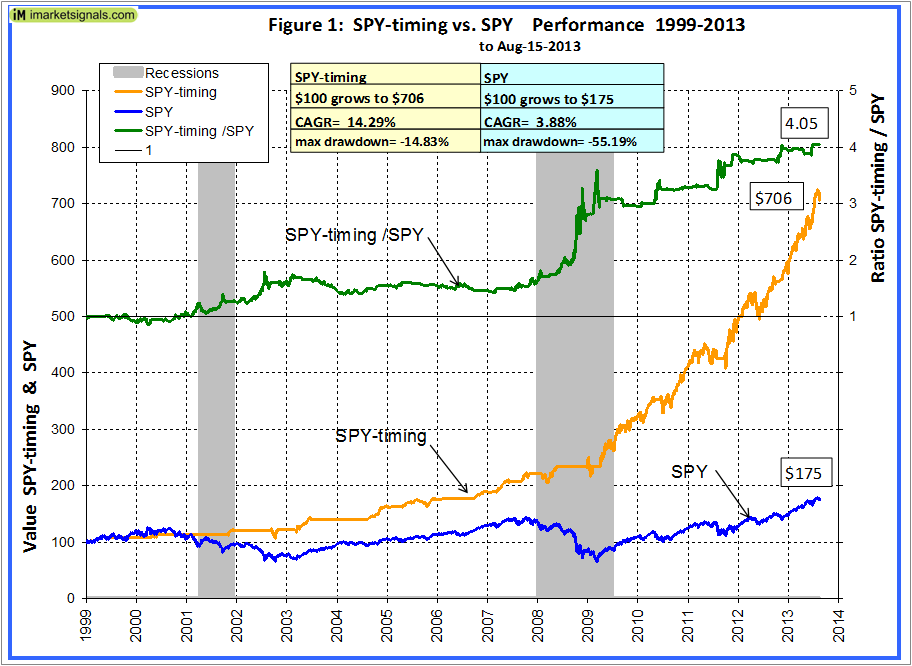
It has been backtested from Jan-2-1999 to Aug-15-2013 on a web-based portfolio simulation site and would have provided a high annualized average return of 14.3% with a max drawdown of only -14.8%. A continuous investment in SPY gave only 3.9%, with a much higher drawdown of -55.2%. The performance without trading costs is shown in Figure 1.
This trading system produced 4 times more value than a continuous investment in SPY, as indicated by the green ratio graph at the top in Figure 1. Excluding the period 2003-2006 when it matched SPY, the timing model always outperformed the continuous investment, as indicated by the upward sloping ratio graph.
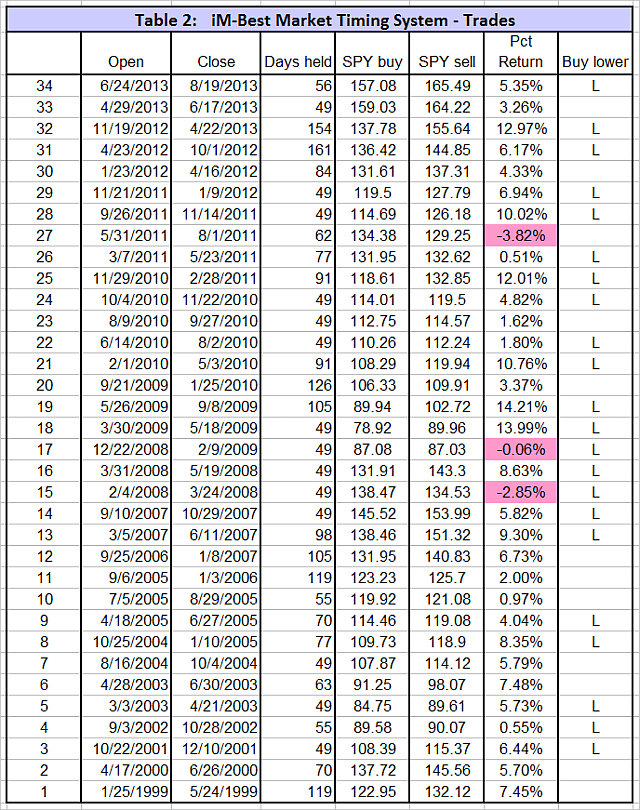
There were only 33 completed trades since 1999, 30 of them winners – a 91% win rate. A list of all trades is in Table 2.
Also this model was 52.2% of the time in cash, 2,796 days out of 5,340, and one would have earned additional interest during this time. Assuming one had invested in a GNMA fund during the cash periods, then annualized average return would have been 17.0% with a max drawdown of only -14.8%. Figures 1a shows the results with the added returns from the GNMA fund.
The model is rebalanced weekly. Buy signals are only allowed to occur 1 week after a sell signals. The buy rule uses volatility, risk premium, earnings estimates together with moving average cross-overs and includes the following parameters:
- CBOE Volatility Index – VIX,
- S&P500 Risk Premium – which is the difference between the Current Estimated Earnings Yield of the S&P500 and the Treasury 10-yr Note Yield,
- Current Year Earnings Per Share Estimate of the S&P500,
- and the daily price of SPY.
The sell rule is based on moving average cross-overs of SPY, with a minimum holding period of 7 weeks specified after a position was first opened.
This model identifies entry- and exit times for the stock market. We are not advocating trading only SPY, because there are better returns to be had using other ETFs when following the signals from this model. For example, had one used SPY from 1999 to May 2003 and then the ETF Equal Weight (RSP) when it became available, the annualized average return would have been 15.5% to Aug 2013, considerably higher than what SPY alone returned.
There were 15 buy signals which occurred 1 to 2 weeks after a sell signal, 9 of them with a lower buy price than the previous sell price. This short period between sell and buy may be a problem if one wanted to apply the signals to retirement accounts where one could possibly invest only in one index fund. It would therefore be advantageous to be with a company offering several large-cap index funds. So if a buy signal from the model falls within the typical 60 day waiting period to enter a fund again after one had previously exited it, one could simply invests in one of the other available funds when a buy signal occurs shortly after a sell signal.
 (click for larger view)
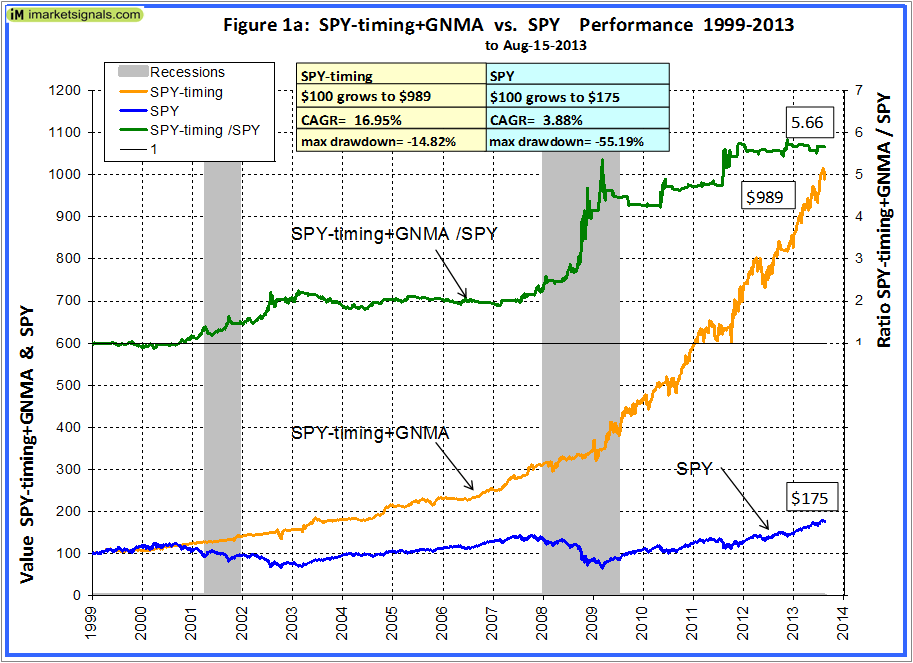 (click for larger view)
Annual performance from January to December was always positive, ranging from a maximum of 28% for 2009 and 2010 to a minimum of 1% for 2002, as can be seen in Figure 2.
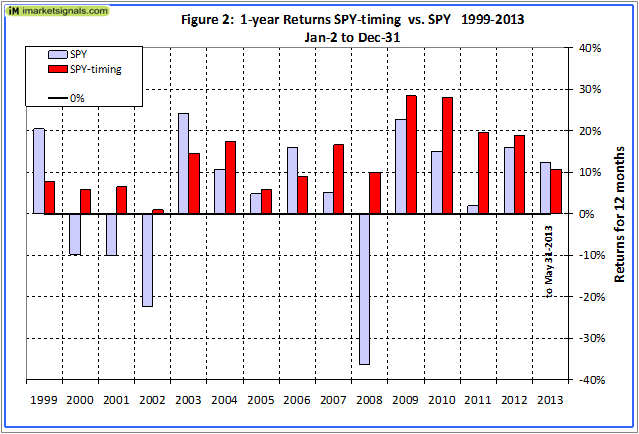
Figure 3 shows the rolling 1-year returns starting each day from 1999 to 2012. There were a few periods when the model produced a small negative return. The minimum return over one year was -7.2% and the maximum was 51.3%.
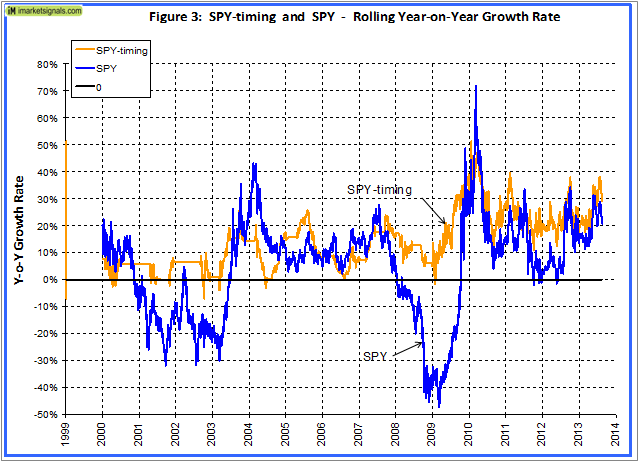
Figure 4 shows returns over 2 calendar years which were always positive, ranging from a maximum of 64% for 2009-10 to a minimum of 8% for 2001-02.

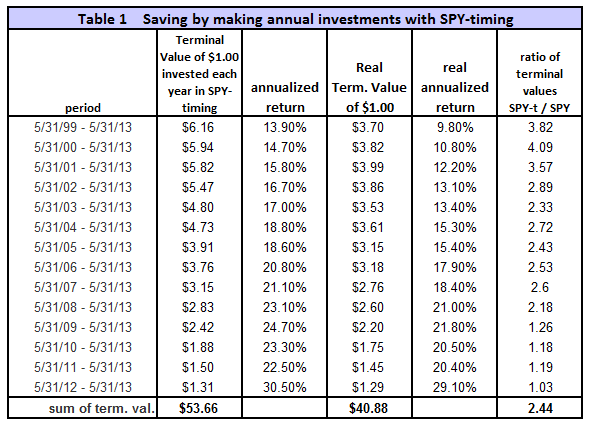
To simulate savings over time, terminal values were calculated to the end of May 2013 for annual hypothetical investments of $1. Starting with a dollar during each of the 14 years from 1999 to 2012, one would have invested a total of $14 cumulatively by the end. Summing the 14 terminal values, this strategy would have netted this dollar-per-year investor $53.66 at the end of 14 years.
Following a buy-and-hold strategy in SPY, one would have only $22, about 41% of what SPY-timing provided. Furthermore, the lowest annualized return, for any of the 14 time periods was 13.9% and the average for all the periods was 20.1%. This is shown in Table 1.
A list of all trades is in Table 2, furthermore trades where the buy was at a lower value than the previous sell are marked with an ‘L’.
iM-Best Systems
Quick Comparison
Quick Links to Model Descriptions
R2G & iM(Silver) iM-Best10(S&P 1500): A Portfolio Management System for High Returns from the S&P 1500
R2G iM-Best9(Russell 1000) – Large-Cap Portfolio Management System
R2G iM-Best8+ Portfolio Management System
iM(Gold) iM’s Best12(USMV)-Trader Minimum Volatility Stocks
iM(Gold) iM’s Best12(USMV)Q1..4-Investor Minimum Volatility Stocks (The Q3 model available to Silver)
iM(Silver) iM-Best10(VDIGX) Trading the Dividend Growth Stocks VDIGX
R2G & iM(Silver) iM-Best(SPY-SH) Market Timing System: Gains for Up and Down Markets
R2G & iM(Gold) iM-Best1(Sector SPDR) Rotation System
R2G & iM(Gold) iM-Best(SSO-TLT) Switching System
iM(Gold) iM-Best Combo3: Best(SPY-SH) + Best1(Sector SPDR) + Best(SSO-TLT)
iM-Best(SPY-Cash) Market Timing System
iM-Best(SSO-SDS): Beating the Market with Leveraged ETFs
Survivorship Bias: neither Myth nor Fact
Quick Links to Ready-2-Go Models
Best(SPY-SH) Gains for Up & Down Markets
When subscribing to P123 please use this link or enter token IMARKETSIGNALS when registering to obtain 30 days free membership.
Disclaimer: The opinions in this document are for informational and educational purposes only and are obtained from a mathematical algorithm and should not be construed as a recommendation to buy or sell the stocks mentioned. Past performance of the companies may not continue and the companies’ stock values may decline. The information in this document is believed to be accurate and represents the output of a mathematical algorithm, and under no circumstances should a person act upon the information contained within. We do not recommend that anyone act upon any investment information without first consulting an investment advisor as to the suitability of such investments for his specific situation. Also see our Terms of Use/Disclaimer.
Dear Mr. Vrba,
When can I start the free trial subscription to IM-Best(SPY)Market Timing System and what is the price of subscription?
Thank you.
Raj
rajvenkatappan@yahoo.com
Raj,
There is no free trial subscription for the model. The free trial subscription for 4 weeks is for P123 if you use the link from this website to get there. We anticipate to open the SPY model early in September. Please leave your email address in the iM-BestX News box to be notified.
Dear George
why there is 7 weeks minimum holding period.Although there wasn’t any major meltdown
during any 7 weeks period in the past. It can happen in the future. Should we impose certain stop loss say 20% to avoid market crash.
Peter
Peter, I think that would be wise.
Also check the IBH, MAC and COMP models for market direction. Additionally there is the Best(SPY-SH) market timing model (published 8-30-13), which oscillates between SPY and SH, the 1x inverse ETF of the S&P500. This model’s investment periods differ somewhat from those of Best(SPY) which is either in or out of the market.
Dear George:
I would be interested in the new SPY timing system. Please advise when ready.
Thanks,
Bruce
The Best(SPY) Market Timing Signals can be obtained from P123 without subscription. Monday morning, after the model has updated, open the Ready2Go page, and sort according to [Holdings] with least holdings first. The Market Timing models based on one ETF, i.e. SPY, will be listed first. Find the BEST(SPY) Market Timing Model and if holdings show ’1′ then the model is in market, and if holdings show ’0′ then the model is out of the market.
Also see the new Best(SPY-SH) timing model on our website coming out on Aug-8-13, which will be updated every weekend with point-in-time data.
The correct date is Aug-30-2013 not Aug-8-13.
Why is there a difference in trading dates between the SPY Marketing timing system and the SPY-SH trading system? Shouldn’t these be the same?
These are different models.
Another question, when I look at the sell price they don’t match historical prices from yahoo closing price, do you know why that is? Some of the sell values are higher than the closing price. Is that due to transaction fees or dividends? Can you explain.
Thanks
We use average of Hi and Low for the next day after the signal is generated, not closing prices. Transaction fees together with slippage of 0.05% of transaction amount is taken into account. Dividends are also included.
Thanks for the quick responses.
Dear Mr. Vrba,
What Moving Average Cross Over do you use in your Best(SPY) Market Timing System to derive Buy and Sell signals.
Thank you.
Raj
Sorry, that is proprietary information. We do not share the maths behind our models.
Can you post an article or chart that summarizes the differences between the SPY market timing model and the SPY-CASH market timing model. If the get different trade signals why? Since both are binary either in SPY or CASH there must be a reason that you run both models. Explain. Thanks.
Signals for Best(SPY-Cash) are from Best(SPY-SH). Best(SPY-SH) has a ranking system which ranks SPY and SH, which is part of the the model’s algorithm.
Best(SPY) does not use a ranking system because it would only have one ETF to rank. Therefore different mathematics produce different results.
The investment periods for Best(SPY) and Best(SPY-Cash) are shown in Table 2 and Table 3, respectively, of the relevant model descriptions.
Thanks!
Georg and Anton:
Regarding your iM-Best(SPY)system, it looks that a sell signal is not possible for 7 weeks after a position in the SPY is established (“The sell rule is based on moving average cross-overs of SPY, with a minimum holding period of 7 weeks specified after a position was first opened”).
Does your SPY-SH system also have a minimum holding period of a similar length of time?
Thank you.
Greg
Yes, SPY-SH has similar provisions.