
The S&P 500 has notched up significant gains over the last year. But looking a bit further back then the performance of the stock market is dismal. An investment in an S&P 500 Index fund made 13 and 14 years ago has only produced negative real returns to date. However, one can get much better returns from the S&P 500 by using a ranking system, and then periodically rebalance one’s portfolio to hold only the 10 highest ranked stocks of the S&P 500 at anytime. This method would have produced average annual returns of about 35% over the last 14 years.
So how does this get done?
Ranking System
To find stocks which may be undervalued all 500 stocks of the S&P 500 index are ranked weekly according to the following parameters:
- Valuation (measured as market capitalization, debt and cash relative to earnings before interest, taxes, depreciation & amortization, future cash flow and projected earnings),
- Efficiency (measured as future cash flow relative to total assets),
- Financial Strength (measured as future cash flow relative to total debt),
- Short Interest (being the short interest ratio),
- Trend (measured as the stock price relative to a moving average of the price),
with the highest rank obtainable being 100.
Trading Rules
Stocks are sold from the portfolio once their rank falls below 97 and replaced by the highest ranked stocks at that time. The model does not restrict buying to stocks which are ranked 97 or higher. (It will only sell once a stock’s rank goes below 97. Since rebalancing is done once a week, stock “A” may already have a rank lower than 97, say 96.5. If the highest ranked stock in the pool is say 96.4, then that stock will be picked, and stock A will be sold nevertheless.)
The model assumes stocks to be bought and sold at the next day’s opening price after a signal is generated. Transaction costs accounting for brokerage fees and slippage, together amounting to about 0.35% of the transaction value of each trade, are taken into account. Taxes are assumed to be deferred, as for retirement accounts.
Performance
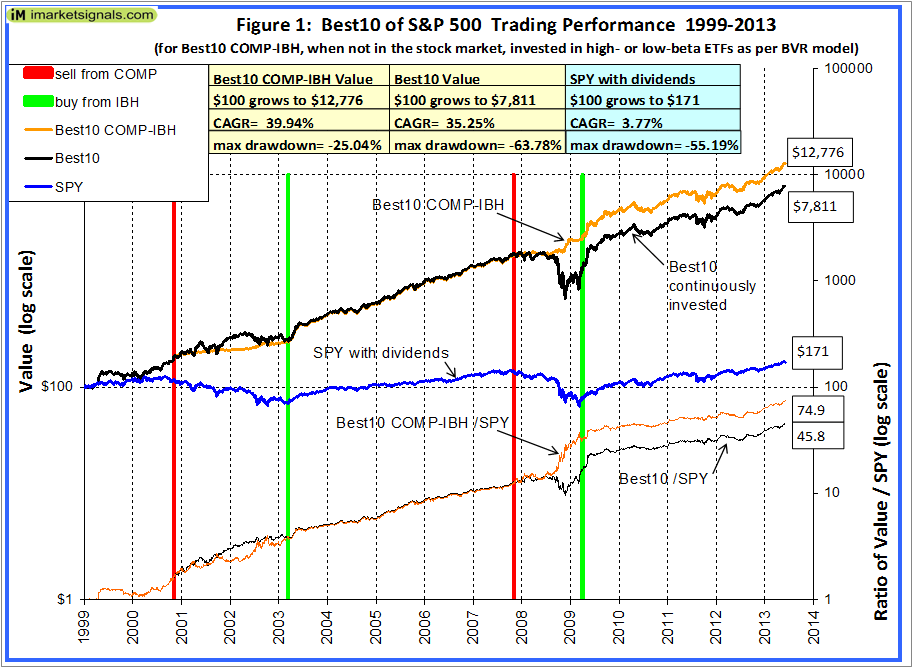
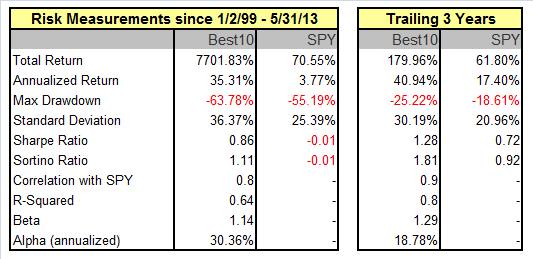
The trading performance is shown in Figure 1 further down. The annualized return over the last 14 years and 5 months was 35.3%, and the maximum draw-down was 64% versus 55% for SPY. Annualized returns for periods of 2 to 14 years were all higher than 28%; they are listed in Table 2.
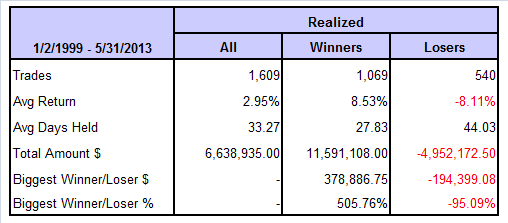
For an investment of $100,000 made on Jan-2-1999 and holding about 10 stocks at any time, there were over the last 14 years 1,609 realized trades, 1,069 of them winners and 540 losers, as shown below; the figures include transaction costs of $599,272.
Further details are given in the Appendix.
 (Click on image to enlarge)
Also one can see from the general slope of the ratio graph at the bottom of the chart that Best10 always outperformed SPY from 1999 onwards, producing 46 times the value which one would have had from a 1999 investment in SPY.
Performance during recession periods
During the period from Jan-1999 to May-2013 there were two recessions. Returns can usually be increased, and drawdowns decreased, by placing the portfolio’s funds, when not in the stock market, into treasury bond funds. My COMP-IBH system provides information when to exit the market and when to re-enter it, and the system’s buy and sell signals are shown in Figure 1 as the vertical green and red lines, respectively.
This strategy would have increased performance considerably, because Treasuries gained greatly during the last recession. $100,000 would have grown to $12,776,122 (about 75 times more than SPY) from 1999 to May 2013, providing an annualized return of 40% and a maximum drawdown of 25%, all as shown in Figure 1.
However, it is noteworthy that during the years 2001 and 2002 Best10 did not follow the market lower, and performed as well as Treasuries over that time. Only during the great recession did Best10 lose value.
Annual Returns
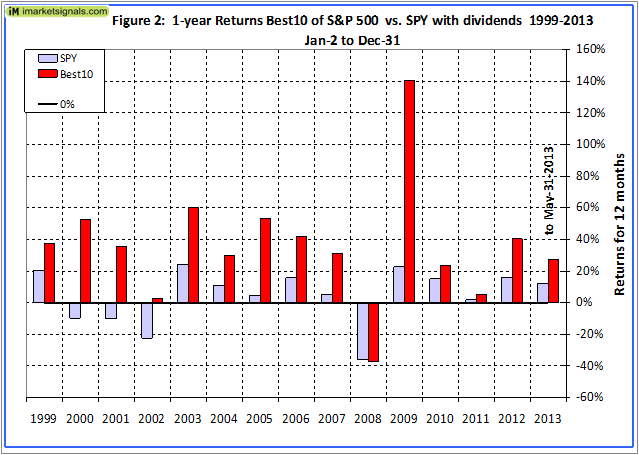
Annual performance from January to December ranged from a maximum of 140% for 2009 to a minimum of -37% for 2008, as can be seen in Figure 2. (This is the return if one had bought stocks on the first day of the year, then traded according to the model’s signals, and sold all the holdings on the last day of the year.)
Terminal Values
A Fund’s performance is better measured by calculating the terminal values of hypothetical equal annually recurring investments, than by the average annual percentage returns for a few time-periods. This simulates returns from saving, which is a continuous process. It also highlights whether a fund has consistently performed well, or whether a good return measured from inception is perhaps only due to an initial period of exceptional returns, never to be repeated later.
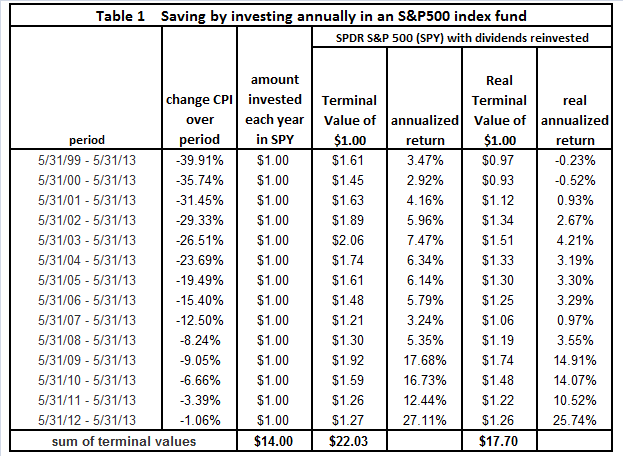
Table 1 in the Appendix shows the futility of having invested in an S&P 500 index fund on an ongoing basis for the last 14 years. Assuming an investment of $1.00 at the end of May of every year, from 1999 to 2012, one would have invested a total of $14 cumulatively by the end. Summing the 14 terminal values, this strategy would have netted this dollar-per-year investor the sum of $22.03 by May 31, 2013, and accounting for inflation this would only have amounted to $17.70. Retirement accounts reflect this poor performance, and it is not surprising that the elderly have for some time now accounted for the highest growth rate in the labor force, obviously this is because they can’t afford to retire.
Making the same $1.00 annual investments in a portfolio managed according to the Best10 trading system would have provided a terminal value of $235.23, as shown in Table 2 in the Appendix. That is about 11 times of what one would have had from an S&P 500 index fund. Also one can see that the lowest annualized returns over all the various time periods was 28.1% for the period 2008-13.
Conclusion
Here is a portfolio management system which does require frequent trading (about once a week), but which would have provided huge returns. There is no art of hindsight involved because only stocks from the S&P 500 are used, and a simple algorithm is consistently applied to the stock selection process. This is not a complex, high risk system which could easily break down. Additionally, selecting only from large and mid-cap stocks from the S&P 500 assures liquidity, even if the portfolio value is large.
More particulars, including a listing of all the transactions since 1999, can be found on our website’s “Systems” page where one can also follow the portfolios’ progress over time as new buy and sell signals emerge. The performance simulations were done on a web-based Portfolio Simulations platform which allows back-testing to the beginning of 1999.
Note
The composition of the S&P 500 differs over the years. The results shown assume that the pool of stocks to select from were the current stocks of the S&P 500. For example, since 2009 there were 29 stocks added and 29 removed. A back-test of this model using the composition of the S&P 500 of 2009 would have provided a CAGR of 32% instead of 35% since 1999. Similarly, if one used the S&P 500 of 1999 one would get a different return.
The intent of this analysis was not to provide an accurate number for the return, but to show that by holding a few of the highest ranked stocks of a pool of company one would always outperform a constant investment in all the companies by a wide margin.
Appendix

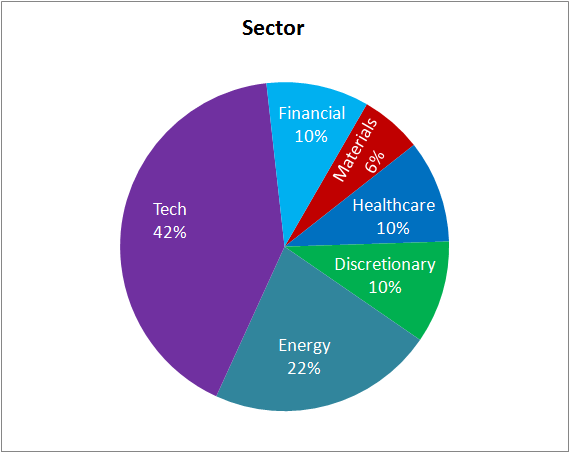
Current holding allocation by sector
 (Click on image to enlarge)
First published June 6, 2013 by dshort Advisor Perspective, iM-Best10: A Portfolio Management System for High Returns
Hello, interesting model will you publish this on a regular basis?
Can you provide more details regarding the ranking? Are the future cashflows based on analyst estimates? Do you use the short interest ratio as a bullish or bearish signal? Have you thought about including insider buying as a signal?
Thanks
Jakob
Jakob, thank you for your thoughtful comments.
We update the model weekly and publish on Friday. Please note that this is for demonstration purposes only, we do not provide investment advice.
Future cash flow is based on analyst estimates. Short interest ratio – lower is better. I can include insider activity into the ranking system and check whether results would improve.
Regarding the statement…
“Since rebalancing is done once a week, stock “A” may already have a rank lower than 97, say 96.5. If the highest ranked stock in the pool is say 96.6, then that stock will be picked, if there is no stock higher ranked than A’s 96.5 no stock will be picked, but stock A will be sold nevertheless.)
If the 96.6 stock is picked this week and the value does not change in next week’s update, is the stock then sold because it’s below 97 and thereby giving a holding period of one week?
Thanks
Yes, the stock will then be sold, because it has a rank lower than 97, and the holding period will be 1 week.
Georg – nice work here. Do you have any turnover data? weekly trading can get expensive is there’s a lot of turnover
Thanks, Joel
Joel, the transaction fees for the model in the article are taken into account in the return and were $559,272. One can lower trading frequency and costs by only selecting the 5 best stocks. Also remember that the current composition of the S&P 500 is different from previous years. Thus the return shown in the article is an estimate only, but the principle remains the same, namely that one would do better by selecting only the 10 best stocks, instead of investing in an index fund.
how do you get the recommendations every week, start trading?
We re-run the simulation every Friday and post the results on this web page. Also please remember we are not investment advisers. Further, we may soon replace this model with a better one. So we don’t recommend that it should be used for trading purposes.
Very interesting.
I was just realizing recently how much I spend on commissions. I am seriously thinking of switching to Interactive Brokers. The savings are substantial. For example, on the last trade in your table of 22,747 shares at $.005 per share the commission/fees cost is 114 instead of 1017.
The fees shown include slippage. The model assumes that the trade is done at the next opening price. But you may not get all the stocks at that exact price, so a slippage factor is applied for the simulation, and this is reflected in the fees.
Can you provide the specific spreadsheet and formulas and weightings so I can replicate and maintain after you guys move onto another model? What software re you using to backtest?
As you say, we will have a more profitable model up soon. It is called the Best10+. Annualized returns for the last 14,5 years are 47%. The weightings of the components of the ranking system are private info. The back-testing is done at the Portfolio Simulations site listed under Favorite Websites, also hyper-linked in the description of the model.
So, it’s a secret system that can’t be reproduced, and might be subject to any number of back-testing errors or biases? How is anyone supposed to have any faith that you haven’t made any number of rookie mistakes such as over-parameterizing your model?
Do you even have a genuine out-of-sample test, or do you just “upgrade” the model every time it starts to perform poorly?
Nice information as an investor where he can get the ranking of S and P ranking information.
Thanks
KNP Krishnaraj
You can get it here every Friday when we update the models. Please note that Best10 will soon be replaced by Best10+ which has provided a 47% average annual return over the last 14.5 years, far better than the 35% return of Best10.
Hi Georg,
Thanks as always for working on new systems and share them with us.
I am wondering if this time your backtesting is not suffering deeply from the “survivorship bias” as you’re saying: “The results shown assume that the pool of stocks to select from were the current stocks of the S&P 500.”
From the wikipedia:
http://en.wikipedia.org/wiki/Survivorship_bias
“Additionally, in quantitative backtesting of market performance or other characteristics, survivorship bias is the use of a current index membership set rather than using the actual constituent changes over time. Consider a backtest to 1990 to find the average performance (total return) of S&P 500 members who have paid dividends within the previous year. To use the current 500 members only and create an historical equity line of the total return of the companies that met the criteria, would be adding survivorship bias to the results. S&P maintains an index of healthy companies, removing companies that no longer meet their criteria as a representative of the large-cap U.S. stock market. Companies that had healthy growth on their way to inclusion in the S&P 500, would be counted as if they were in the index during that growth period, when they were not. Instead there may have been another company in the index that was losing market capitalization and was destined for the S&P 600 Small-cap Index, that was later removed and would not be counted in the results. Using the actual membership of the index, applying entry and exit dates to gain the appropriate return during inclusion in the index, would allow for a bias-free output.”
I think you are aware of this as you are stating that:
“A back-test of this model using the composition of the S&P 500 of 2009 would have provided a CAGR of 32% instead of 35% since 1999. Similarly, if one used the S&P 500 of 1999 one would get a different return.”
A different return for sure but how much different? To me that’s a real issue.
I know that you’re kind of “protecting” yourself saying that “The intent of this analysis was not to provide an accurate number for the return, but to show that by holding a few of the highest ranked stocks of a pool of company one would always outperform a constant investment in all the companies by a wide margin.”
Well, in this case correct backtesting results are key for a correct conclusion. Your conclusion should be revised with a backtesting avoiding the survivorship bias. Otherwise big doubts will remain.
I hope you will still be right and this portofolio management system can provide big returns but that’s not clear to me currently.
I like very much all your work and make my comments in a constructive way to help you refine the results to reach a clear conclusion.
I must also admit that I am not a backtesting expert and might have misunderstood part of your research.
Thanks.
Nicolas
Nicolas,
thank you for your thoughtful comments. The composition of the S&P 500 stock index changes frequently, thus there is no way to capture this when back-testing this model.1) If one had the S&P 500 index data for every year then it would be quite easy to check. So if you have information where I can get it, I would be happy to run this analysis again.
However, I did check the model on the DOW data. Historic data of the components of the DOW is available on the internet. http://en.wikipedia.org/wiki/Historical_components_of_the_Dow_Jones_Industrial_Average
I ran the ranking model for the 1999 list and the 2013 list from 1999 to 2013. The returns were virtually identical, all substantially higher than buy-and-hold of the DOW. The DOW produced a CAGR= 3.44& from 1999 to 2013. Selecting the Best5 produced for the 1999 DOW list a CAGR=9.3% and for the 2013 DOW list a CAGR= 10.6%. For the Best2 the returns were 17.0% and 16.5%, respectively.
The ranking method works for all lists, irrespective of how the lists changes over time. Interestingly the maximum draw-down for the best 5 and best 2 stocks was less than for all 30 of the DOW stocks.
1) Correction June 17, 2013: The portfolio simulations system does allow historic S&P500 selection, and survivor bias free simulations are now in progress.
Hi Georg,
Many thanks to take the time to answer me. :-)
As I said I am not an expert but I think these two articles might help:
http://engineering-returns.com/2010/11/16/sp500-survivorship/
http://www.quantshare.com/sa-435-getting-accurate-backtesting-results-survivorship-bias-free-s-p-500
The first one is showing that results based on a “survivorship bias free database” are half of results with a today’s index members only database (in their example).
Their conclusion is “Using today’s S&P500 stocks to backtest strategies will guide you towards wrong decisions in your system design & development process.”
Hope this helps.
As you are saying in the comments your system results are “unbelievably high” even if I would like to believe them. :-)
Have a great day.
Nicolas
Nicolas, thank you for your reply and the references.
The message of my article is that a strategy based on selecting a few of the highest ranked stocks from a list of stocks will always provide a higher return, than if you just invested in the an index fund representing all the stocks on the list.
So the conclusion that “Using today’s S&P500 stocks to backtest strategies will guide you towards wrong decisions in your system design & development process” does not really apply to my method, although I used the current S&P500 list to demonstrate it.
Also one should modify the list over time. For example in 1999 Kodak was one of the 30 DOW stocks and it may have been on your list. Now they are gone. So obviously you would not have Kodak on your list anymore. You would probably have noticed earlier that Kodak was in trouble and replaced it with a better performing stock.
So in real life the list will change all the time. This year’s list will be obsolete in a few years as well.
Hi Nicolas,
Our own research shows that the opposite also holds true, namely that using a static current database of an index for backtesting produces lower returns than using a dynamic database which reflects the changes to the index’s composition over time.
It depends on the backtesting model’s parameters and also on the size of the index. The S&P500 may be too small, the companies too homogeneous, or the selection model could be flawed. The referenced articles above provide no data or results that one could check.
We will soon publish our research showing that there could be other mechanism at play, or that survivor-ship bias applies only to selected populations, but not if one selected stocks from a large population of diverse companies.
Question: What would have occurred if you would have shorted the ten worst ranked stocks(i.e. the Worst 10)
Ted
Good idea, I will do this next by inverting the ranking system to pick the 10 worst, this will be fun
Hi,do any of the Internet sites list all of the s and p 500 stocks with the percentage rating like ANF 99.7 all the way down to zero percent
The rating system is proprietary and calculated weekly and the ranks of only the weekly traded stocks is indicated in the weekly updates
Georg – Would you get a better overall return by going to cash when either your BCI or COMP models instructed you to do so? Not sure if you would have missed too much upside to compensate for the downside avoided. I would guess the total return would be better, but not sure.
Yes, please refer to Figure 1
Joel, I think it is always a good idea to avoid being invested in stocks during business cycle downturns. Just look at the drawdowns – losing 55% of your investment is tough to take, even if the model catches up later. But in the past it was better to be in Trasuries than in cash.
The new Best10+ system does 4% better by staying in the market during recessions. But what difference does it make if you have a CAGR=50% or 46%, both of them are unbelievably high.
I think I jumped the gun and was referring to the Best10+ system also following the COMP-IBH model. Anyway, I think you make a good point – hard to wrong either way.