We developed a novel approach to rule based trading and rule based market timing. Dedicated pages are allocated to these systems as indicated further below, and can also be found as sub-menu under the |Systems| menu above. As a general remark we elaborate to the subject of survivorship bias and curve fitting as follows:
Our rule based models are tested, using survivorship bias free data, on the Portfolio Simulations site, please refer to Survivorship Bias: neither Myth nor Fact.
Regarding concerns that our models are curve fitted to maximize past performance, please refer Section 4 of the Terms of Use/Disclaimer and the following:
Please note, any mathematical model is based on experience, and thus it can be said that it is curve fitted to the experience – that is a simple fact of mathematical modeling. This should not be seen as a negative trait provided the model is thoroughly tested during development and a transparent model description is provided.
All our models are subjected to a sensitivity study. As our models use a multitude of parameters this study ensures that the model remains stable when each and every parameter is changed independently. This should ensure that the model is robust and not crash when market conditions are different from those captured in the past.
Nothing in our description has been selected for good reading. For example, we publish the daily rolling year-on-year return or growth, something that no managed fund does. This way one can see the spread of the yearly returns at any time. The expectation being that this should, with high probability, resemble what can be expected in the future. It also shows the performance of the algorithm over different market conditions which prevailed over the back test period.
Rule Based Trading
Our IBH, MAC , BCI or COMP models are designed as a guide to reduce stock market investment risk. These models do not address the choice of specific stocks. However, sites like Portfolio Simulations offer access to a database allowing simulations of stock trading models according to specific set of rules.
In the article Maximizing Profits in a Low Stock Return Environment with Stock Trading Systems and Asset Allocation Models of October 2012 such a simulation is discussed. This particular model was found to have no practical application in real life.
Our simulated stock trading systems are described on the dedicated page iM-BestX Portfolio Management Systems.
Rule Based Market Timing
The investor often asks the question when to enter and exit the stock market. Our weekly indicators IBH, MAC , BCI or COMP models do answer part of the question; these indicators are devised from numerous financial indices.
We have now developed a rule based market timing model based on the SPY (the ETF tracking the S&P 500) using the third party Portfolio Simulations website and is described on the dedicated page iM-Best Market Timing Systems
iM-Best Systems
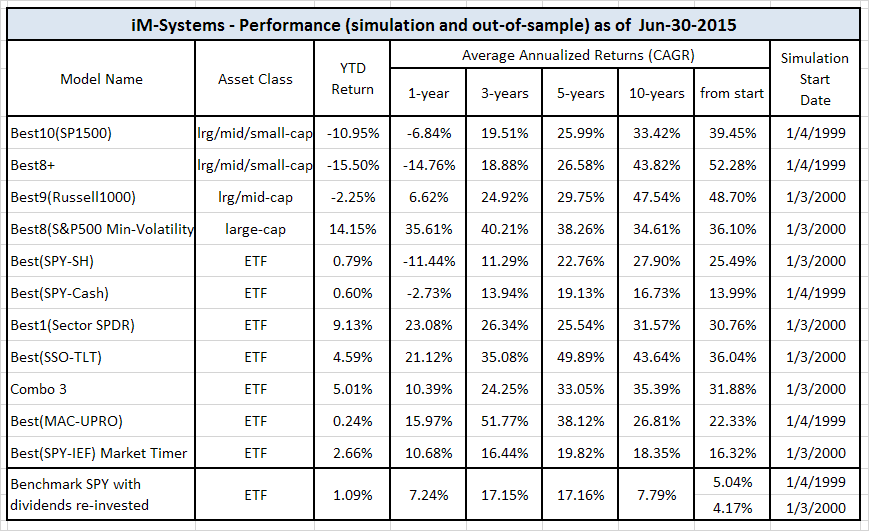
Quick Comparison
Quick Links to Model Descriptions
R2G & iM(Silver) iM-Best10(S&P 1500): A Portfolio Management System for High Returns from the S&P 1500
R2G iM-Best9(Russell 1000) – Large-Cap Portfolio Management System
R2G iM-Best8+ Portfolio Management System
iM(Gold) iM’s Best12(USMV)-Trader Minimum Volatility Stocks
iM(Gold) iM’s Best12(USMV)Q1..4-Investor Minimum Volatility Stocks (The Q3 model available to Silver)
iM(Silver) iM-Best10(VDIGX) Trading the Dividend Growth Stocks VDIGX
R2G & iM(Silver) iM-Best(SPY-SH) Market Timing System: Gains for Up and Down Markets
R2G & iM(Gold) iM-Best1(Sector SPDR) Rotation System
R2G & iM(Gold) iM-Best(SSO-TLT) Switching System
iM(Gold) iM-Best Combo3: Best(SPY-SH) + Best1(Sector SPDR) + Best(SSO-TLT)
iM-Best(SPY-Cash) Market Timing System
iM-Best(SSO-SDS): Beating the Market with Leveraged ETFs
Survivorship Bias: neither Myth nor Fact
Quick Links to Ready-2-Go Models
Best(SPY-SH) Gains for Up & Down Markets
When subscribing to P123 please use this link or enter token IMARKETSIGNALS when registering to obtain 30 days free membership.
Disclaimer: The opinions in this document are for informational and educational purposes only and are obtained from a mathematical algorithm and should not be construed as a recommendation to buy or sell the stocks mentioned. Past performance of the companies may not continue and the companies’ stock values may decline. The information in this document is believed to be accurate and represents the output of a mathematical algorithm, and under no circumstances should a person act upon the information contained within. We do not recommend that anyone act upon any investment information without first consulting an investment advisor as to the suitability of such investments for his specific situation. Also see our Terms of Use/Disclaimer.

