Using the simulated investment periods determined with the iM-Best(SPY-SH) Market Timing System, we calculated performance figures resulting from the model switching between the ETFs SSO and SDS, instead of SPY and SH. The periods when the model was long are listed in Table 3 of iM-Best(SPY-SH) Market Timing System. SSO and SDS are the leveraged ETFs which seek daily investment results corresponding to twice, and to twice the inverse of the daily performance of the S&P500, respectively. This alternative system would have produced an average annual return of about 55.6% from January 2000 to the end of August 2013, versus 2.6% for a buy-and-hold investment of SPY over the same period.
Performance
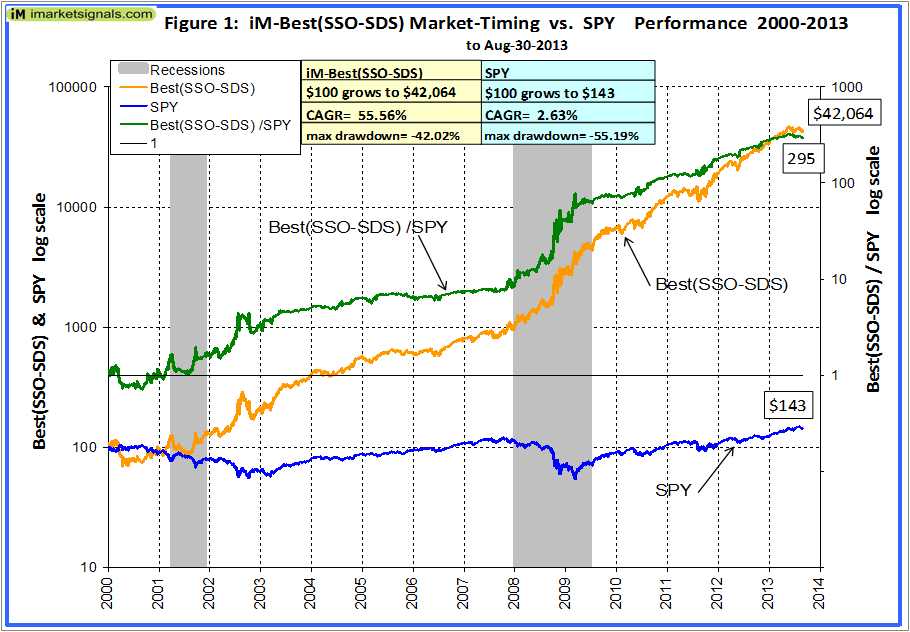
The trading performance of the system which switches between SSO and SDS is shown in Figure 1. The annualized return from January 2000 to end of August 2013 was 55.6%; $100 grew to about $42,000 over this period. The maximum drawdown was -42.0% in October 2002. All values are adjusted for dividends, and slippage was assumed at 0.1% of the transaction amounts.
In above chart, the upper green graph shows the ratio of the Best(SSO-SDS) to SPY, the rising trend of that graph indicating that the Best(SSO-SDS) almost continuously outperformed SPY, producing 295 times the value which one would have had from a buy-and-hold investment in SPY over the same period. However, note that from middle of May 2013 to end of August 2013 there was an underperformance of about 9% relative to SPY.
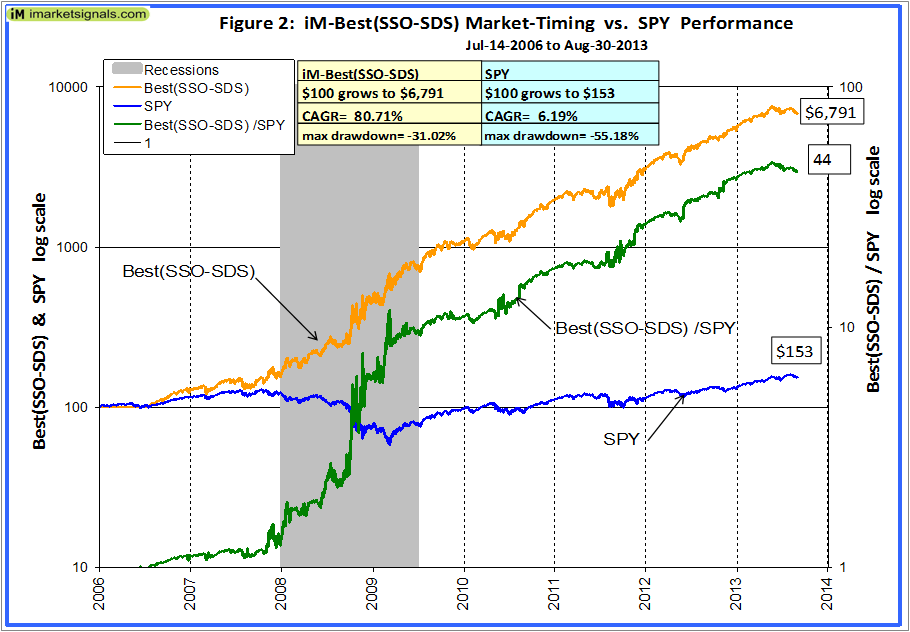
The inception date of SSO and SDS was June 19, 2006 and July 11, 2006, respectively. Prior to this dates values are “synthetic”, derived from the S&P 500. Below is Figure 2 which shows the model’s return from July 14, 2006 onwards using the actual closing prices of SSO and SDS. The annualized return is 81% with a maximum drawdown of only 31%.
Annual Returns
Annual performance from January to December ranged from a maximum of 190% for 2008 to a minimum of -7% for 2000, as can be seen in Figure 3.
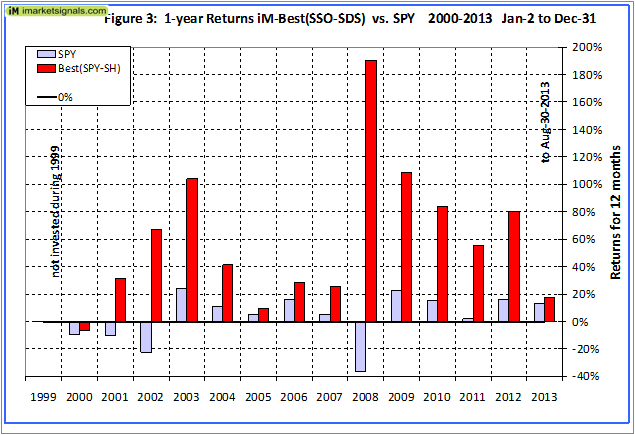
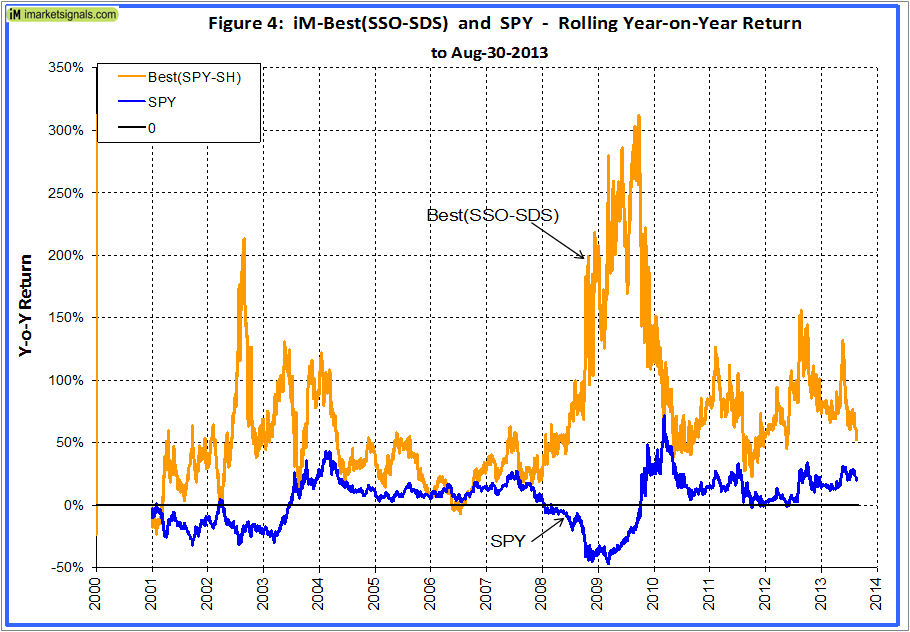
Figure 4 shows the rolling 1-year returns starting each trading day from 2000 to 2012 ranging from a minimum of -24% to a maximum of 312%.
Terminal Values
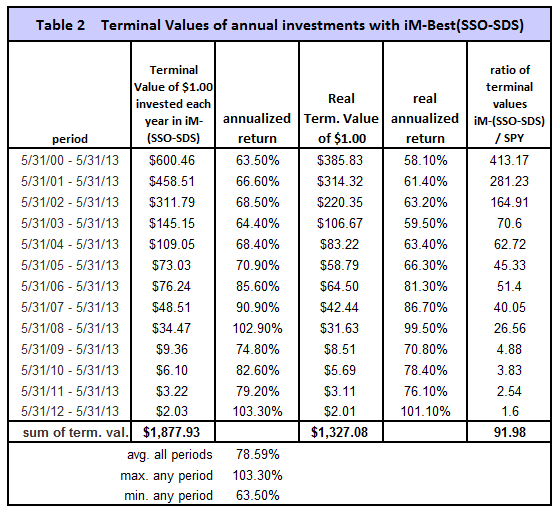
Terminal values were calculated to the end of May 2013 for annual hypothetical investments of $1. Starting with a dollar during each of the 13 years from 2000 to 2012, one would have invested a total of $13 cumulatively by the end. Summing the 13 terminal values, this strategy would have netted this dollar-per-year investor the amount of $1,878 at the end of 13 years.
Following a buy-and-hold strategy in SPY, one would have only $22, a tiny fraction of what Best(SSO-SDS) provided. Furthermore, the lowest annualized return, for any of the 13 time periods was 63.5% and the average for all the periods was 78.6%. This is shown in Tables 1 and 2.
Conclusion
It is evident that successful market timing will improve returns. Investments in leveraged ETFs is highly risky, and the returns shown are provided for informational use only. The returns over shorter periods are not always better than those of the S&P500. There is no claim made that one would have actually achieved those returns in real life. Note that all performance figures are derived from a simulation model and are the results of backtesting only.
iM-Best Systems
Quick Comparison
Quick Links to Model Descriptions
R2G & iM(Silver) iM-Best10(S&P 1500): A Portfolio Management System for High Returns from the S&P 1500
R2G iM-Best9(Russell 1000) – Large-Cap Portfolio Management System
R2G iM-Best8+ Portfolio Management System
iM(Gold) iM’s Best12(USMV)-Trader Minimum Volatility Stocks
iM(Gold) iM’s Best12(USMV)Q1..4-Investor Minimum Volatility Stocks (The Q3 model available to Silver)
iM(Silver) iM-Best10(VDIGX) Trading the Dividend Growth Stocks VDIGX
R2G & iM(Silver) iM-Best(SPY-SH) Market Timing System: Gains for Up and Down Markets
R2G & iM(Gold) iM-Best1(Sector SPDR) Rotation System
R2G & iM(Gold) iM-Best(SSO-TLT) Switching System
iM(Gold) iM-Best Combo3: Best(SPY-SH) + Best1(Sector SPDR) + Best(SSO-TLT)
iM-Best(SPY-Cash) Market Timing System
iM-Best(SSO-SDS): Beating the Market with Leveraged ETFs
Survivorship Bias: neither Myth nor Fact
Quick Links to Ready-2-Go Models
Best(SPY-SH) Gains for Up & Down Markets
When subscribing to P123 please use this link or enter token IMARKETSIGNALS when registering to obtain 30 days free membership.
Disclaimer: The opinions in this document are for informational and educational purposes only and are obtained from a mathematical algorithm and should not be construed as a recommendation to buy or sell the stocks mentioned. Past performance of the companies may not continue and the companies’ stock values may decline. The information in this document is believed to be accurate and represents the output of a mathematical algorithm, and under no circumstances should a person act upon the information contained within. We do not recommend that anyone act upon any investment information without first consulting an investment advisor as to the suitability of such investments for his specific situation. Also see our Terms of Use/Disclaimer.

 (click to enlarge)
 (click to enlarge)
 (click to enlarge)
Looks good but I would be surprised if this is effective in any kind of stagnant market. As the Mötley Fool points out, “What most people don’t understand is that most leveraged ETFs are leveraged to the daily moves of the market. So, over time, the volatility of the market will eat away potential returns.” and ” leveraged ETFs never, ever belong in someone’s long-term portfolio. They’re all destined to underperform the market.”
Yes I would suggest your synthetic prices possibly need re-examination. Are they calculated in exactly the same way as these ETFs?
I agree with you that leveraged ETFs don’t belong into a long-term portfolio, simply because they are too risky. See the concluding paragraph of the article. I have done the analysis because people asked for it.
Also, I did not calculate the synthetic prices, they are from P123, and from what I was given to understand, they follow the applicable formula.
Based on my own research, a similar Long-Short backtest using Russell 2000 or S&P Mid 400 funds would produce an even better performance result. Since the start of 2003 these indexes have outperformed the S&P 500 using your trade dates.
Thanks for letting us know. The Russell 2000 represents small-cap stocks and ETFs are IWM (long – since 5/22/00) and RWM (short – since 1/23/07).
Here are the annualized returns and draw-downs 2000-13:
(IWM-Cash) 21.5% max DD= -21.0%
(IWM-RWM) 33.4% max DD= -35.6%
(IWM-SH) 34.2% max DD= -31.4%
(SPY-SH) 28.8% max DD= -22.8%
Using IWM instead of SPY will result in higher returns, but also in higher draw-downs. Small-caps are more volatile than large-caps, and this is reflected in the results.
I agree that leveraged ETFs do not belong in a long-term portfolio…but they seem to be ideal for a short term trading portfolio…the UPRO (3x) is up 66% YTD compared to the S&P500 19% YTD…so have you looked at the possibility of UPRO to Cash and a UPRO to SPXU system using the Best Stock Market Indicator to switch in and out…I would be very interested to see what numbers are generated by such a system…thanks much for you great work.
The 3x leveraged ETFs UPRO to SPXU would have provided from 2000 to 2013 an average annualized return of 85% with the signals from Best(SPY-SH).
Also see my next comment below.
The inception date of UPRO and SPXU was 6/23/09. Values before that date are synthetically derived from the S&P500 index. A simulation with those values would be unreliable. Also the underlying model Best(SPY-SH) is not a short-term trading model.