
Below article was revised on September 1, 2013.
This binary model switches between SPY (SPDR® S&P 500® ETF) and SH (ProShares Short S&P500 ETF) depending on market direction. Using a web-based trading simulation platform, our ranking system, and specific buy and sell rules, this model would have produced an average annual return of about 27.7% from January 2000 to middle of August 2013, versus 2.8% for a buy-and-hold investment of SPY over the same period. Had one not invested in SH but remained in cash without interest then one would have been 64% of the time in SPY and the average annualized return would have been about 16%. This model is currently invested in SPY.
Model Parameters
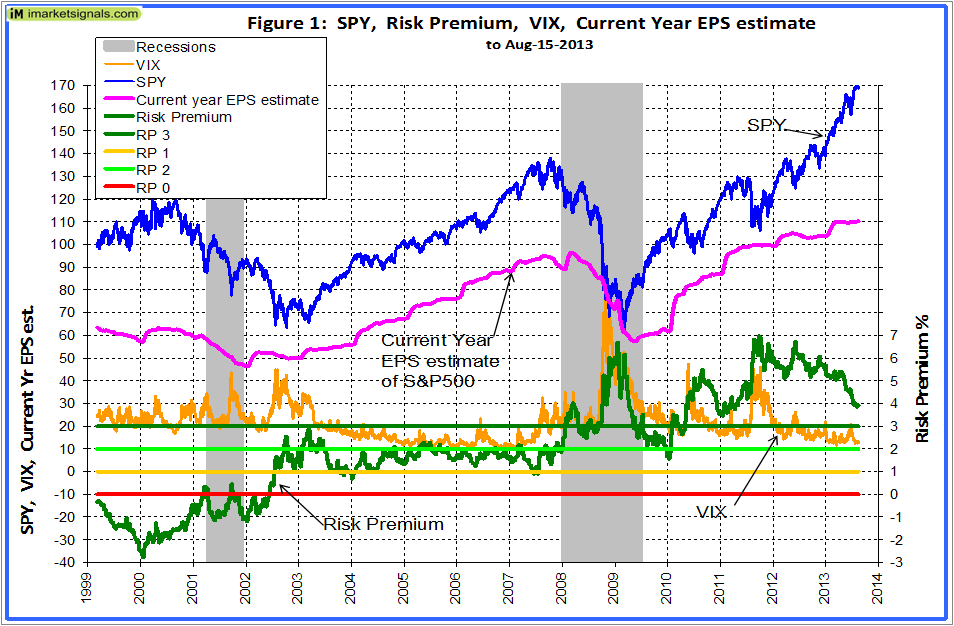
The trading rules use volatility, risk premium, earnings estimates together with moving average cross-overs and includes the following parameters:
- CBOE Volatility Index – VIX,
- S&P500 Risk Premium – which is the difference between the Current Estimated Earnings Yield of the S&P500 and the Treasury 10-yr Note Yield,
- Current Year Earnings Per Share Estimate of the S&P500,
- and the daily price of SPY.
Figure 1 shows graphs of all parameters used. The horizontal risk premium lines indicate whether the market is overvalued (RP<1), fairly valued or undervalued (RP>3) according to the Fed Model.
 (Click to Enlarge)
Performance
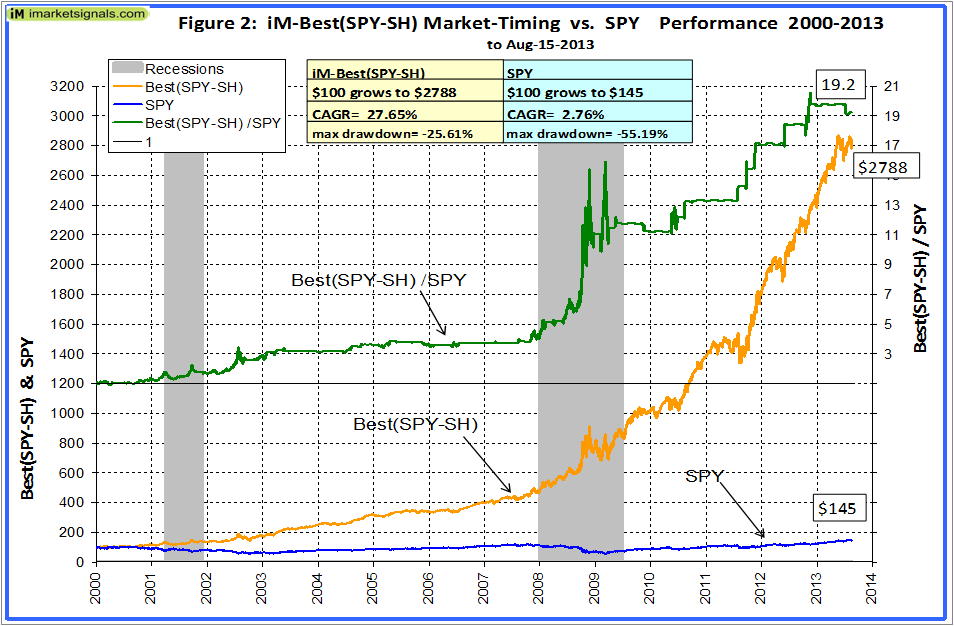
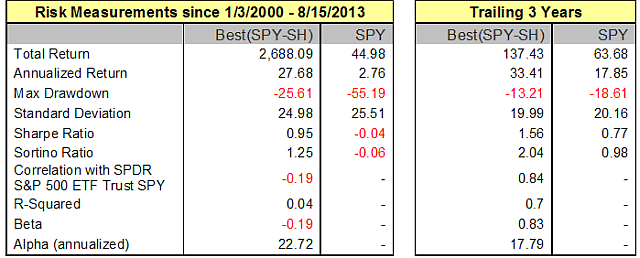
The trading performance of the system is shown in Figure 2 further down. The annualized return from January 2000 to middle of August 2013 was a high 27.7%; $100 grew to about $2,800 over this period. The maximum drawdown was 25.6% in September 2009. All values are with dividends reinvested.
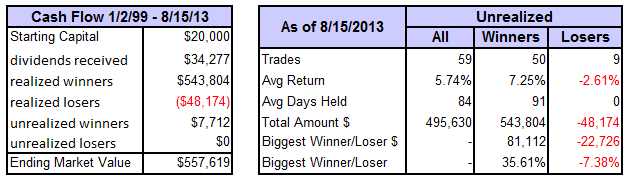
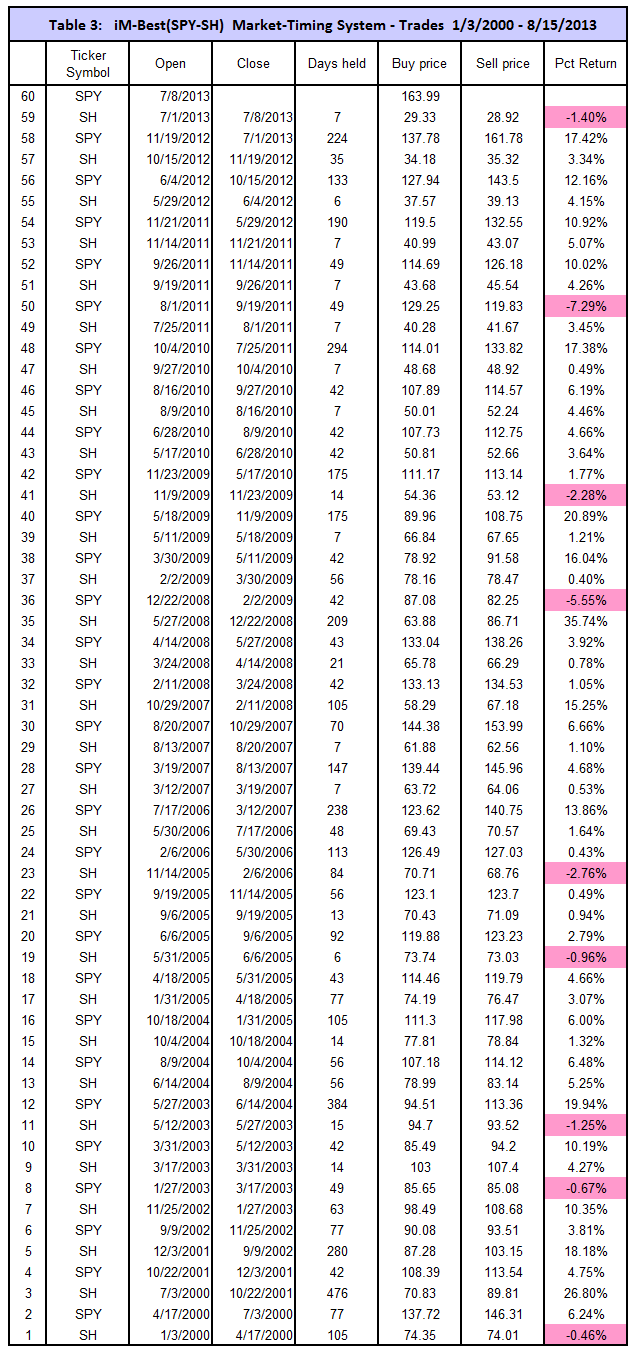
The model assumes an initial investment of $20,000 on Jan-3,2000. It either holds SPY or SH, it is never in cash. To August 15, 2013 there were 59 trades completed, 50 of these were winners and 9 losers, as summarized in the tables below, and listed in Table 3 in the Appendix. The amounts shown include transaction fees of $9,366 arising from brokerage fees.
Note: The inception date of SH was June 19, 2006. Prior to this date values are “synthetic” derived from the S&P 500.
 (Click to Enlarge)
In above chart, the upper green graph is the ratio of the Best(SPY-SH) to SPY, the general rising trend of that graph indicates that the Best(SPY-SH) continuously outperformed SPY; it produced 19 times the value which one would have had from a buy-and-hold investment in SPY over the same period. Even during the bull market period from 2009 onwards did this model out performed SPY.
Annual Returns
Annual performance from January to December ranged from a maximum of 64% for 2008 to a minimum of 8% for 2005, as can be seen in Figure 3. There was never a loss over those periods.
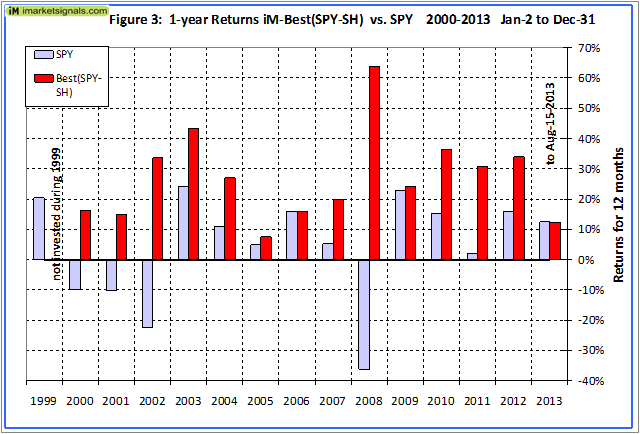
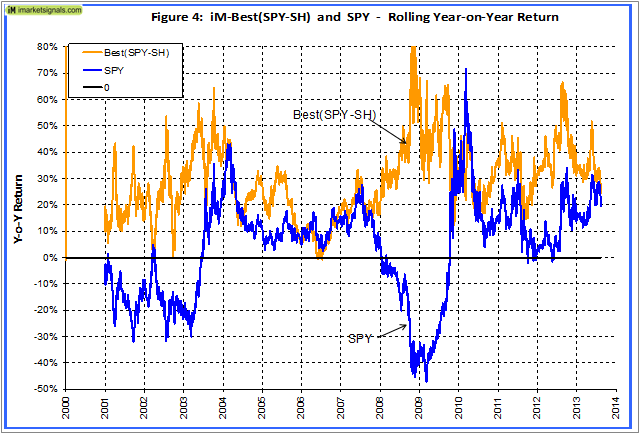
Figure 4 shows the rolling 1-year returns starting each trading day from 2000 to 2012. There was never a significant loss over any 1-year period. The minimum return over 12 months was -1% and the maximum was 88%.
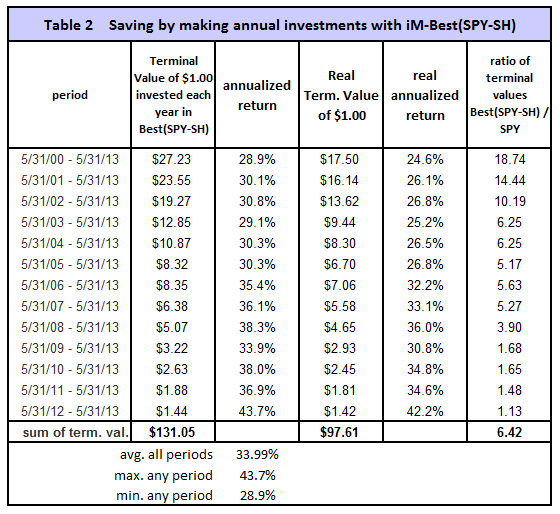
Terminal Values
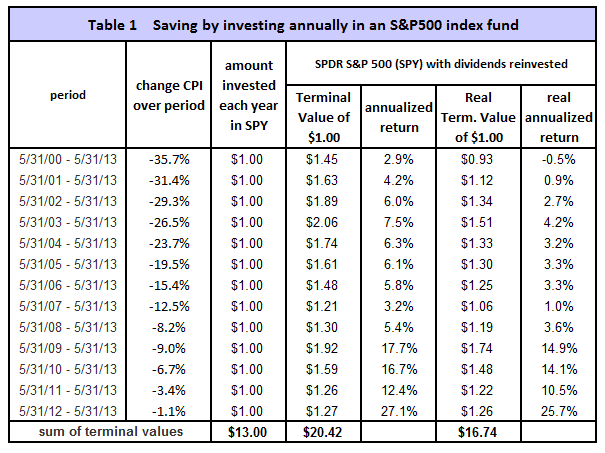
To simulate savings over time, terminal values were calculated to the end of May 2013 for annual hypothetical investments of $1. Starting with a dollar during each of the 13 years from 2000 to 2012, one would have invested a total of $13 cumulatively by the end. Summing the 13 terminal values, this strategy would have netted this dollar-per-year investor $131 at the end of 13 years.
Following a buy-and-hold strategy in SPY, one would have only $22, about 15.6% of what Best(SPY-SH) provided. Furthermore, the lowest annualized return, for any of the 14 time periods was 28.9% and the average for all the periods was 34%. This is shown in Table 1 and 2 in the Appendix.
Application to mutual funds
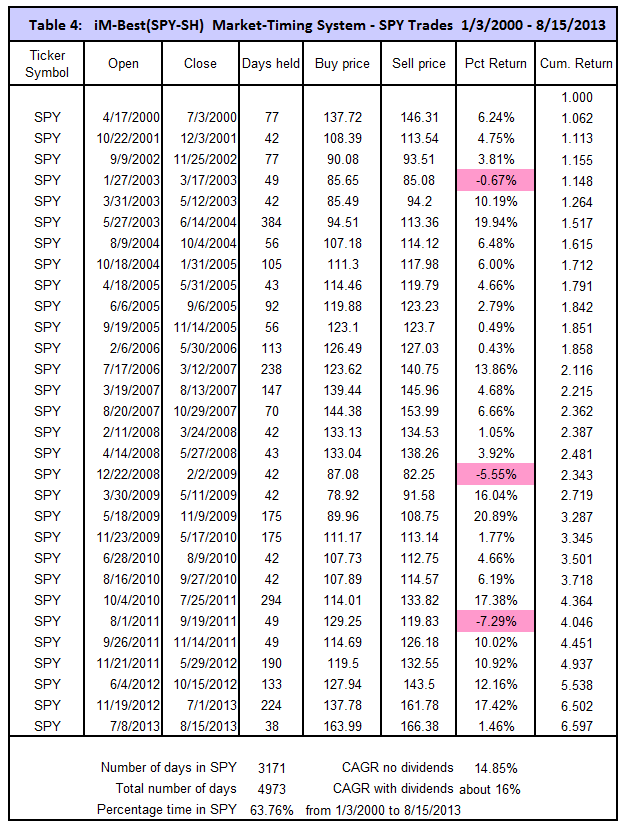
This market timing system can not only be applied to trading the ETFs SPY and SH, but can also be used to time investments in stock index funds tracking the S&P 500. Table 4 in the appendix lists only the investment periods when the model was in SPY, i.e. invested in the S&P 500. This provided an approximate average annualized return of about 16% (with dividends) from the beginning of 2000 to August 2013, with 64% of the total time invested. For the remaining 36% of the time one would have had additional income from a bond fund or from cash in a money market account.
More particulars can be found on our website’s “iM-Best Market Timing Systems” page, where this model with an inception date of 1/2/2009 will be updated weekly.
Appendix
iM-Best Systems
Quick Comparison
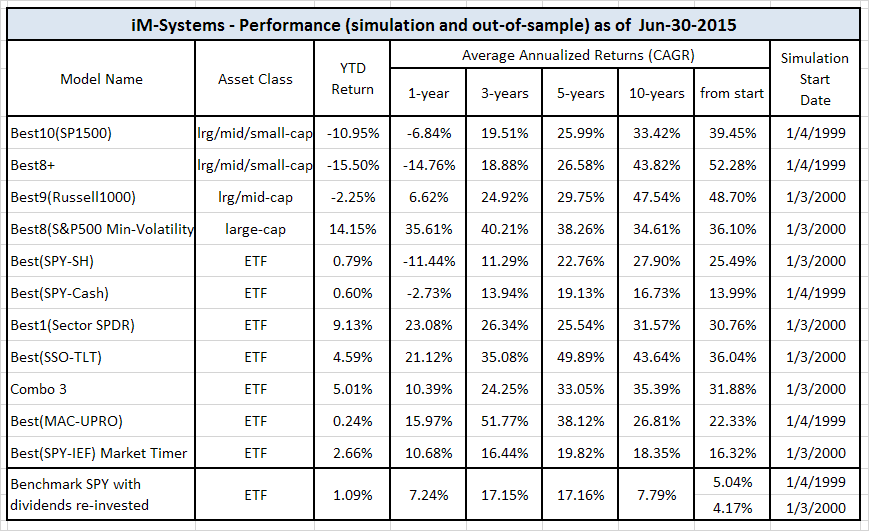
Quick Links to Model Descriptions
R2G & iM(Silver) iM-Best10(S&P 1500): A Portfolio Management System for High Returns from the S&P 1500
R2G iM-Best9(Russell 1000) – Large-Cap Portfolio Management System
R2G iM-Best8+ Portfolio Management System
iM(Gold) iM’s Best12(USMV)-Trader Minimum Volatility Stocks
iM(Gold) iM’s Best12(USMV)Q1..4-Investor Minimum Volatility Stocks (The Q3 model available to Silver)
iM(Silver) iM-Best10(VDIGX) Trading the Dividend Growth Stocks VDIGX
R2G & iM(Silver) iM-Best(SPY-SH) Market Timing System: Gains for Up and Down Markets
R2G & iM(Gold) iM-Best1(Sector SPDR) Rotation System
R2G & iM(Gold) iM-Best(SSO-TLT) Switching System
iM(Gold) iM-Best Combo3: Best(SPY-SH) + Best1(Sector SPDR) + Best(SSO-TLT)
iM-Best(SPY-Cash) Market Timing System
iM-Best(SSO-SDS): Beating the Market with Leveraged ETFs
Survivorship Bias: neither Myth nor Fact
Quick Links to Ready-2-Go Models
Best(SPY-SH) Gains for Up & Down Markets
When subscribing to P123 please use this link or enter token IMARKETSIGNALS when registering to obtain 30 days free membership.
Disclaimer: The opinions in this document are for informational and educational purposes only and are obtained from a mathematical algorithm and should not be construed as a recommendation to buy or sell the stocks mentioned. Past performance of the companies may not continue and the companies’ stock values may decline. The information in this document is believed to be accurate and represents the output of a mathematical algorithm, and under no circumstances should a person act upon the information contained within. We do not recommend that anyone act upon any investment information without first consulting an investment advisor as to the suitability of such investments for his specific situation. Also see our Terms of Use/Disclaimer.
Will the new spy-sh timing system be available by subscription from portfolio 123?
Not for the time being, but we may also feature it there as a R2G model in the future.
I am a little confused as to your terminology.
When you say “The annualized return from January 2000 to middle of August 2013 was a high 27.7%”, why don’t you refer to CAGR – or is this what you mean? Isn’t average annualized return irrelevant if you are providing CAGR results in the final table?
Also, referring to dscott comment above where you say you are not making iM-Best(SPY-SH) into a subscription model. Is this not just the iM-Best(SPY) with the short component added?
No, it is different. The SPY investment periods are not identical for the two models.
Hi Georg:
I would be interested in subscribing to either the SPY-SH or just the SPY timing models. Thanks
We will soon have SPY-SH as a R2G subscription model, but it will also be updated here. The difference being that R2G provides email notification of the signals, whereas we will only let you know when the model is updated if you leave your email address in the iM-Best(SPY-SH) News box. You can then see the holdings at iM.