
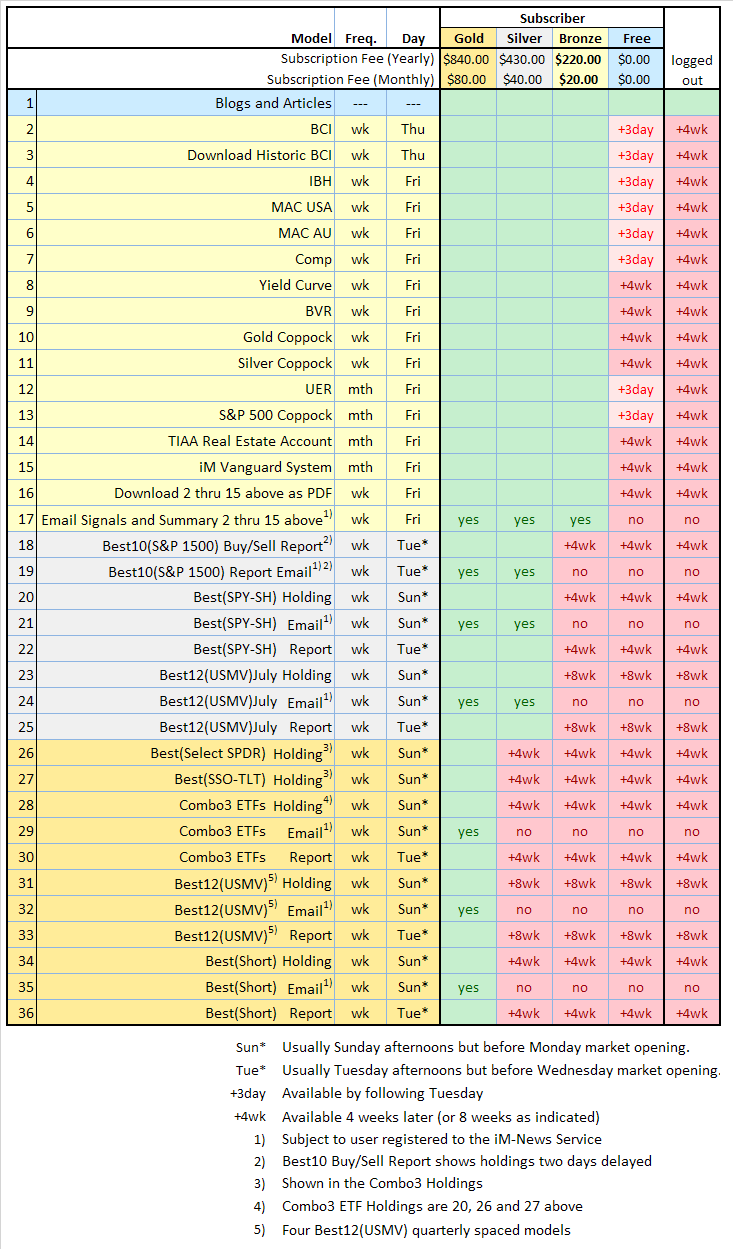
 We offer three categories of membership – bronze, silver and gold at $20, $40 and $80 per month respectively, or discounted on a per year basis. The table to the left (just click on it) lists what you can access depending on the membership level you choose. All information not listed will remain free, however selected key articles could in future be restricted to a paid membership category.
Please select your membership level here.
Most Recent Updates
Model Performance Tables: Dec 16, 2014
Business Cycle Index: Dec 18, 2014
Weekly Macro Signals: Dec 19, 2014
Monthly Update: Dec 5, 2014
December 15, 2014
iM-Best Holdings
12/15/14 Combo3 holds SH, XLV and TLT
The Best(SSO-TLT) sells SSO and Buys TLT
| iM-Best (ETF) Holdings | |||
| Date | SPY-SH | Sec. SPDR | SSO-TLT |
| 12/15/14 | SH | XLV | TLT |
| 12/08/14 | SH(* Note) | XLV | SSO |
| 12/01/14 | SH | XLV | SSO |
| 11/24/14 | SH | XLV | SSO |
| 11/17/14 | SH | XLV | SSO |
| 11/10/14 | SH | XLV | SSO |
| 11/03/14 | SH | XLV | SSO |
| 10/27/14 | SH | XLV | SSO |
| 10/20/14 | SH | XLV | SSO |
| 10/13/14 | SPY | XLV | SSO |
| 10/06/14 | SPY | XLV | TLT |
| 09/29/14 | SPY | XLV | SSO |
| 09/22/14 | SPY | XLV | SSO |
| 09/15/14 | SPY | XLV | SSO |
| 09/08/14 | SPY | XLV | SSO |
| 09/02/14 | SPY | XLV | SSO |
| 08/25/14 | SPY | XLV | SSO |
| 08/18/14 | SPY | XLV | SS0 |
| 08/11/14 | SPY | XLV | SSO |
| 08/04/14 | SPY | XLV | TLT |
| 07/28/14 | SPY | XLV | SSO |
| 07/21/14 | SPY | XLV | SSO |
| 07/14/14 | SPY | XLV | SSO |
| 07/07/14 | SPY | XLV | SSO |
| 06/30/14 | SPY | XLV | SSO |
| 06/23/14 | SPY | XLV | SSO |
| 06/16/14 | SPY | XLV | SSO |
| 06/09/14 | SPY | XLV | SSO |
| 06/02/14 | SPY | XLV | SSO |
| 05/27/14 | SPY | XLV | SS0 |
| 05/19/14 | SPY | XLV | SSO |
| 05/12/14 | SPY | XLV | SSO |
| 05/05/14 | SPY | XLV | SSO |
| 04/28/14 | SPY | XLV | SSO |
| 04/21/14 | SH | XLV | SSO |
| 04/14/14 | SPY | XLV | TLT |
| 04/07/14 | SPY | XLV | SSO |
| 03/31/14 | SPY | XLV | SSO |
| 03/24/14 | SPY | XLV | SSO |
| 03/17/14 | SPY | XLV | SSO |
| 03/10/14 | SPY | XLV | SSO |
| 03/03/14 | SPY | XLV | SSO |
| 02/24/14 | SPY | XLV | SSO |
| 02/18/14 | SPY | XLV | SSO |
| 02/10/14 | SPY | XLV | TLT |
| 02/03/14 | SPY | XLV | SSO |
| 01/27/14 | SPY | XLV | SSO |
12/15/14 iM-Best(Short) shorts MBLY; covers ADBE, 80% not allocated.
| Date | iM-Best(Short) Positions |
||||
| 12/15/14 | UA | — | — | — | — |
| 12/08/14 | MBLY | — | — | — | — |
| 12/01/14 | ADBE | — | — | — | — |
| 11/24/14 | MGM | — | — | — | — |
| 11/17/14 | — | — | — | — | — |
| 11/10/14 | SBAC | — | — | — | — |
| 11/03/14 | AMZN | — | — | — | — |
| 10/27/14 | CHTR | CRM | — | — | — |
| 10/20/14 | EQIX | — | — | — | — |
| 10/13/14 | BXP | KIM | O | — | — |
| 10/06/14 | — | — | — | — | — |
| 09/29/14 | CCI | WMB | — | — | — |
| 09/22/14 | — | — | — | — | — |
| 09/15/14 | — | — | — | — | — |
| 09/08/14 | — | — | — | — | — |
| 09/02/14 | TSLA | — | — | — | — |
| 08/25/14 | TRIP | — | — | — | — |
| 08/18/14 | VRTX | — | — | — | — |
| 08/11/14 | — | — | — | — | — |
| 08/04/14 | —- | — | — | — | — |
| 07/28/14 | CRM | MGM | — | — | — |
| 07/21/14 | — | — | — | — | — |
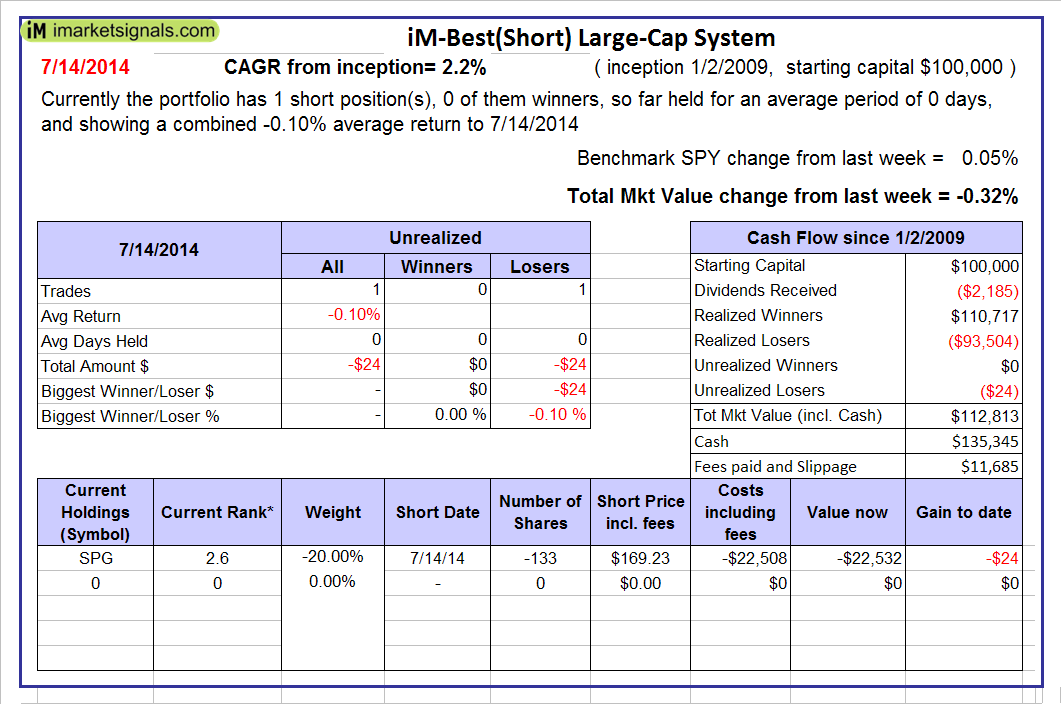
| 07/14/14 | SPG | — | — | — | — |
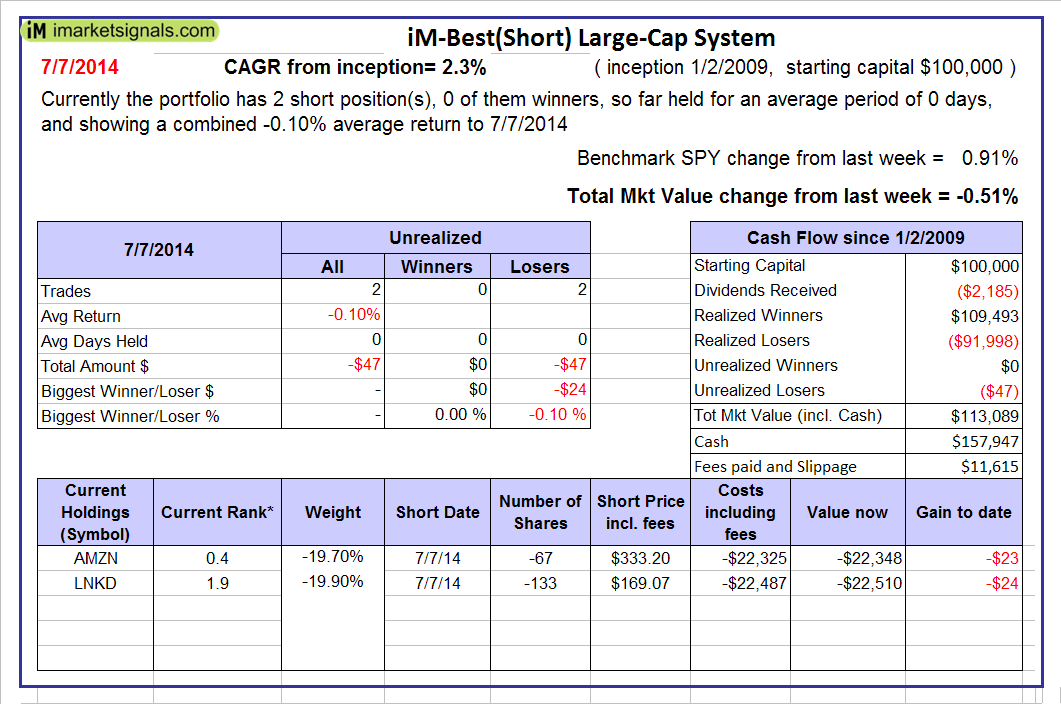
| 07/07/14 | AMZN | LNKD | — | — | — |
| 06/30/14 | CHTR | EQR | — | — | — |
| 06/23/14 | INCY | O | — | — | — |
| 06/16/14 | CRM | EQIX | — | — | — |
| 06/09/14 | — | — | — | — | — |
| 06/02/14 | RRC | UA | — | — | — |
| 05/27/14 | VRTX | — | — | — | — |
| 05/19/14 | TSLA | VTR | — | — | — |
| 05/12/14 | LNKD | — | — | — | — |
| 05/05/14 | AMZN | CCI | SBAC | — | — |
| 04/28/14 | CHTR | — | — | — | — |
| 04/21/14 | RRC | TWTR | — | — | — |
12/15/14 iM-Best12(USMV)-July no change from previous week.
| Date | iM-Best12(USMV)-July Positions |
|||||
| 12/15/14 | positions remain unchanged since 6/30/14 | |||||
| 6/30/14 Inception |
BBBY | CAH | CVS | DG | EBAY | LMT |
| LUV | MDT | PCP | ROST | SNPS | TRV | |
12/15/14 iM-Best12(USMV)-October no change from previous week.
| Date | iM-Best12(USMV)-October Positions |
|||||
| 12/15/14 | positions remain unchanged since 9/29/14 | |||||
| 9/29/14 Inception |
AZO | CAH | DG | DLTR | EBAY | ESRX |
| LUV | MMM | PCP | PRE | SNPS | Y | |
12/15/14 iM-Best12(USMV)-Trader .
updated on Tuesdays
| Date | iM-Best12(USMV)-Trader Positions |
|||||
| 12/15/14 Holdings |
LMT | QCOM | PETM | EBAY | TJX | UNH |
| DG | UNP | MMC | HRL | SNPS | Y | |
| 12/15 BUY | LMT | PETM | — | — | — | |
| 12/15 SELL | LH | NLSN | — | — | — | |
| 12/1 BUY | DG | UNP | HRL | — | — | |
| 12/1 SELL | SHW | UPS | ROST | — | — | |
| 11/17 BUY | QCOM | LH | UPS | ROST | — | |
| 11/17 SELL | LUV | DLTR | PCP | BBBY | — | |
| 11/03 BUY | NLSN | UNH | SHW | — | ||
| 11/03 SELL | LMT | FIS | CAH | — | ||
| 10/20 BUY | TJX | — | — | |||
| 10/20 SELL | ESRX | — | — | |||
| 10/6 BUY | BBBY | PCP | — | |||
| 10/6 SELL | DG | ROST | — | |||
| 9/22 BUY | ESRX | FIS | — | |||
| 9/22 SELL | AMGN | PCP | — | |||
| 9/8 BUY | LMT | — | ||||
| 9/8 SELL | WLP | — | ||||
| 8/25 BUY | AMGN | DLTR | WLP | Y | — | |
| 8/25 SELL | ACT | BBBY | MDT | TRV | — | |
| 8/11 BUY | ACT | MMC | — | |||
| 8/11 SELL | CVS | RAI | — | |||
| 7/28 BUY | RAI | — | ||||
| 7/28 SELL | LMT | — | ||||
| 6/30/14 Inception |
BBBY | CAH | CVS | DG | EBAY | LMT |
| LUV | MDT | PCP | ROST | SNPS | TRV |
12/15/14 iM-Best10(VDIGX)-Trader .
updated on Tuesdays
| Date | iM-Best10(VDIGX)-Trader Positions |
|||||
| 12/15/14 Holdings |
ACE | AMGN | CB | HON | LMT | — |
| MAT | PNC | SLB | TJX | UNH | — | |
| Holdings 12/8/14 |
ACE | AMGN | CB | HON | LMT | — |
| MAT | PNC | SLB | TJX | UNH | — |
December 15, 2014
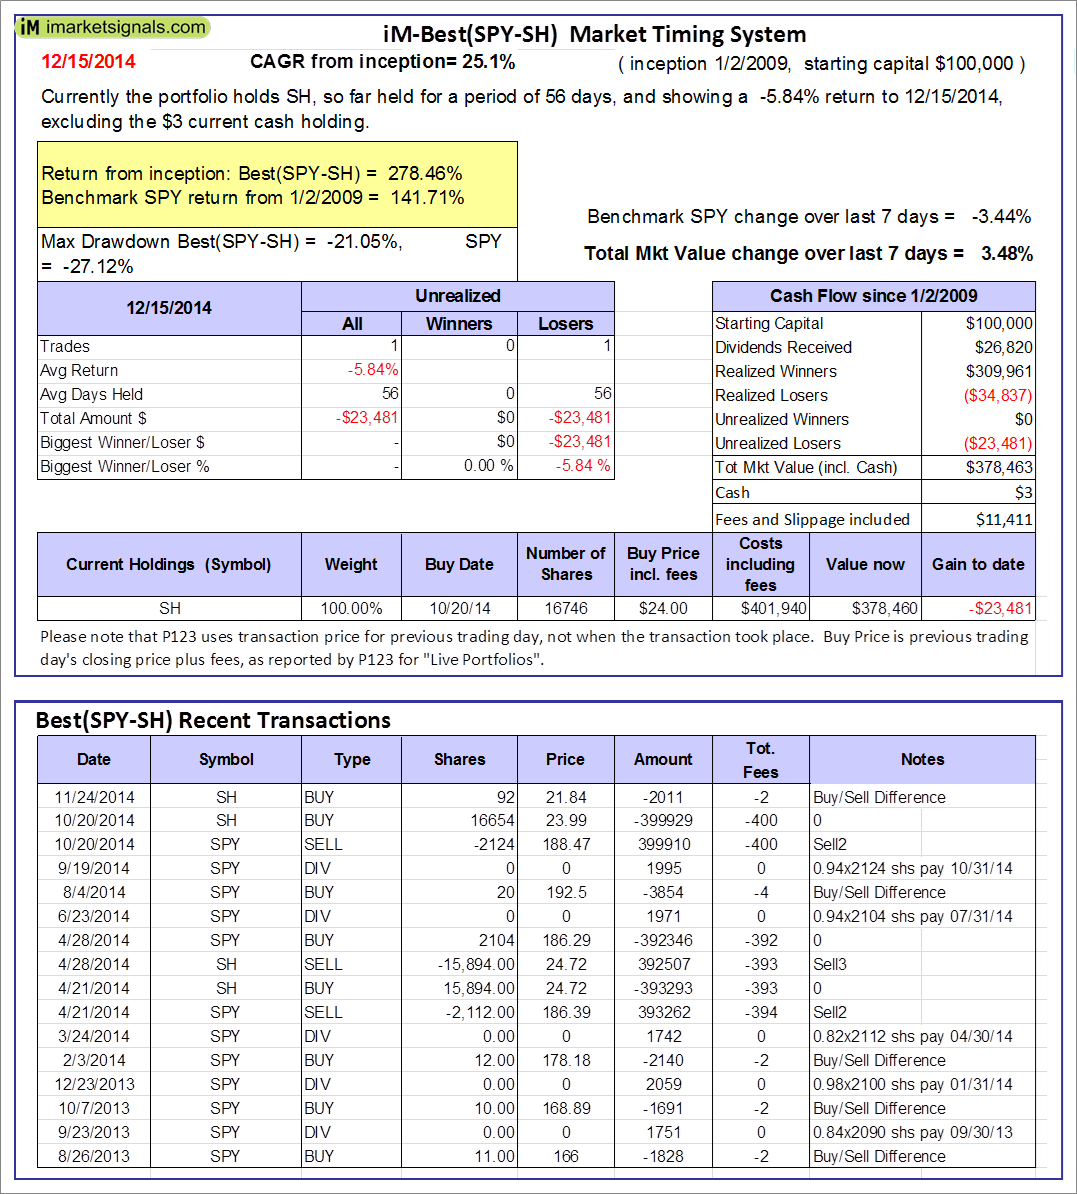 |
The iM-Best(SPY-SH) model currently holds SH, so far held for a period of 56 days, and showing -5.84% return to 12/15/2014. Over the previous week the market value of Best(SPY-SH) gained 3.44% at a time when SPY gained -3.44%. A starting capital of $100,000 at inception on 1/2/2009 would have grown to $378,463 which includes $3 cash and excludes $11,411 spent on fees and slippage. |
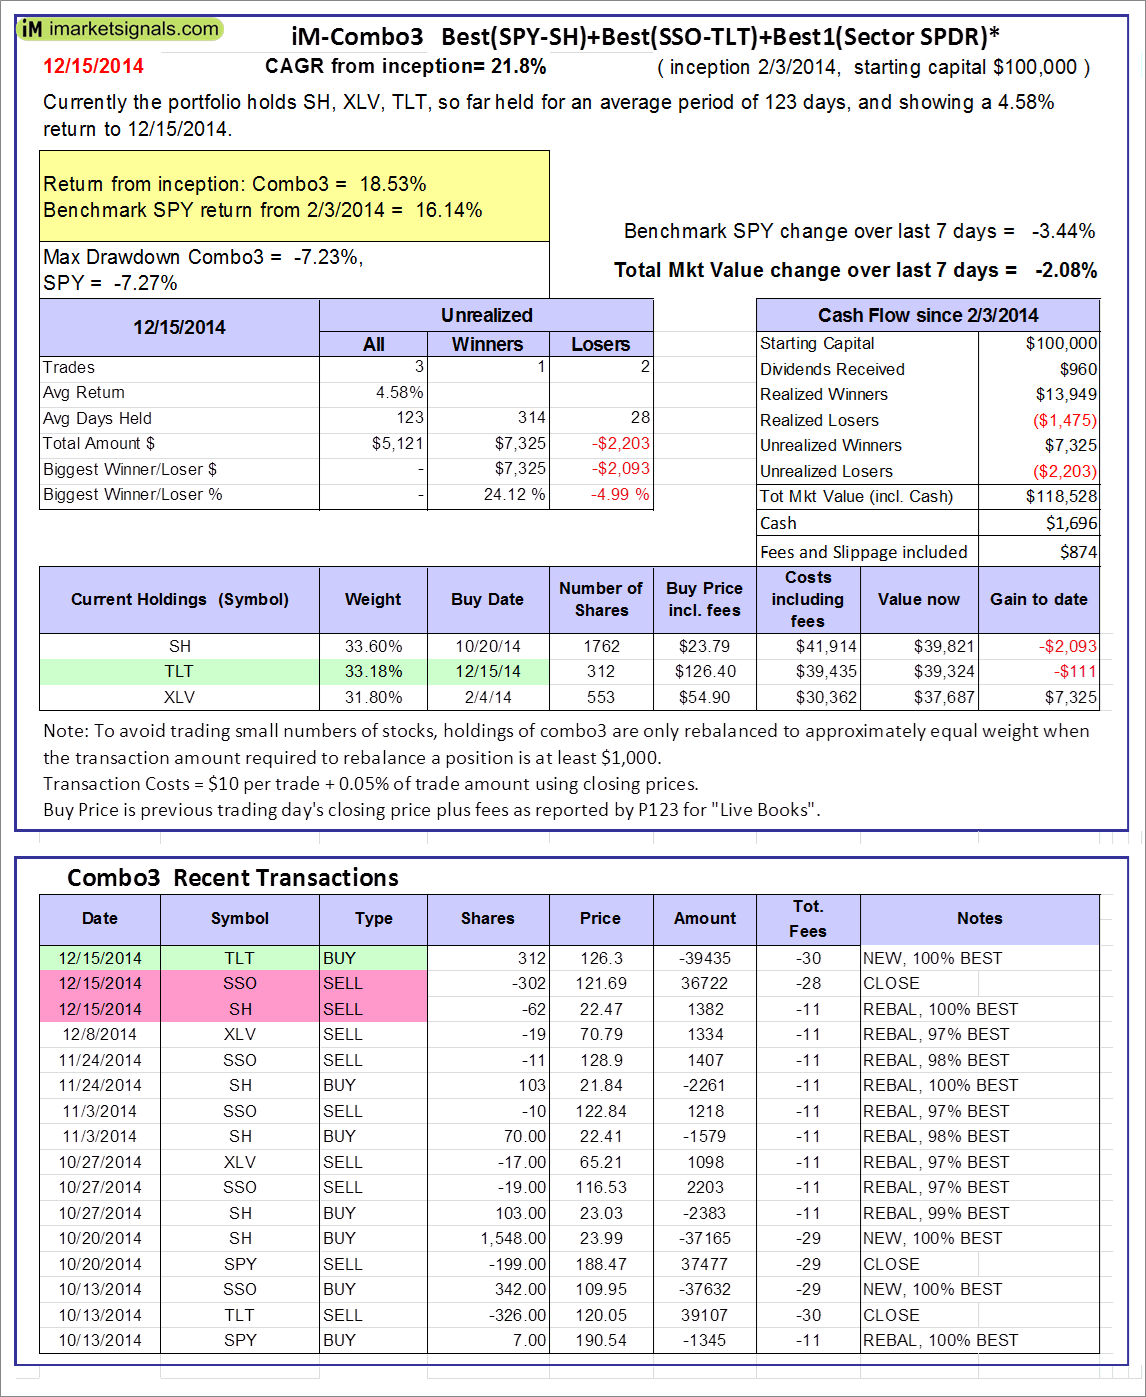 |
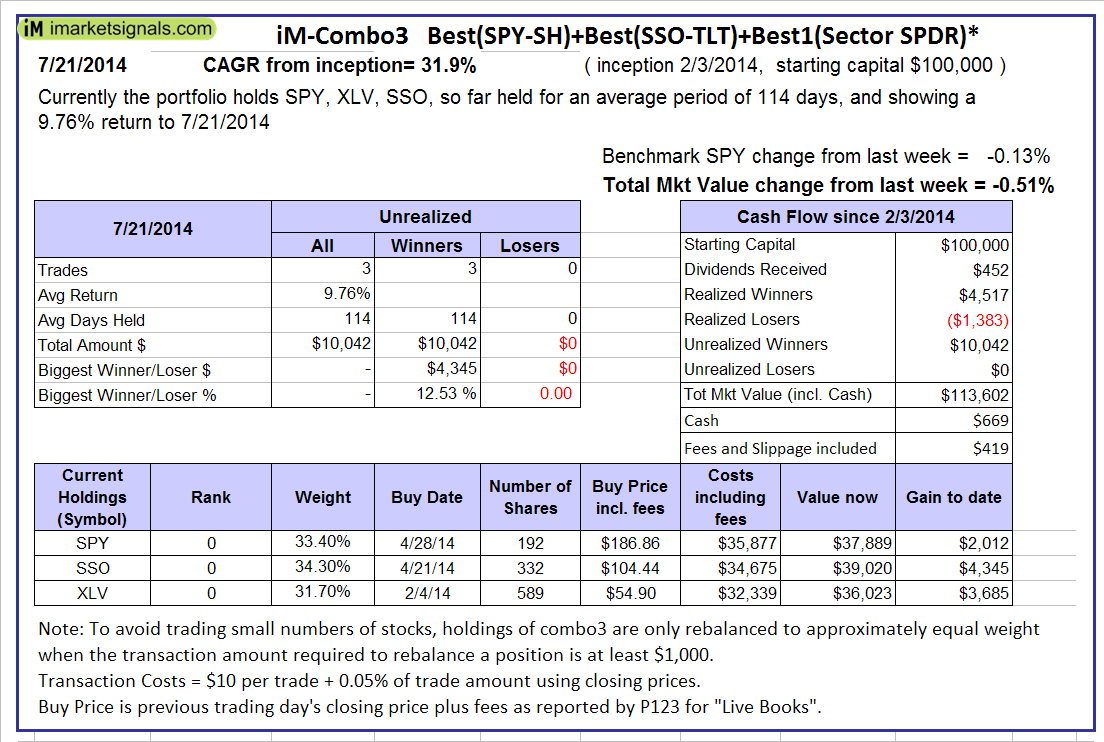
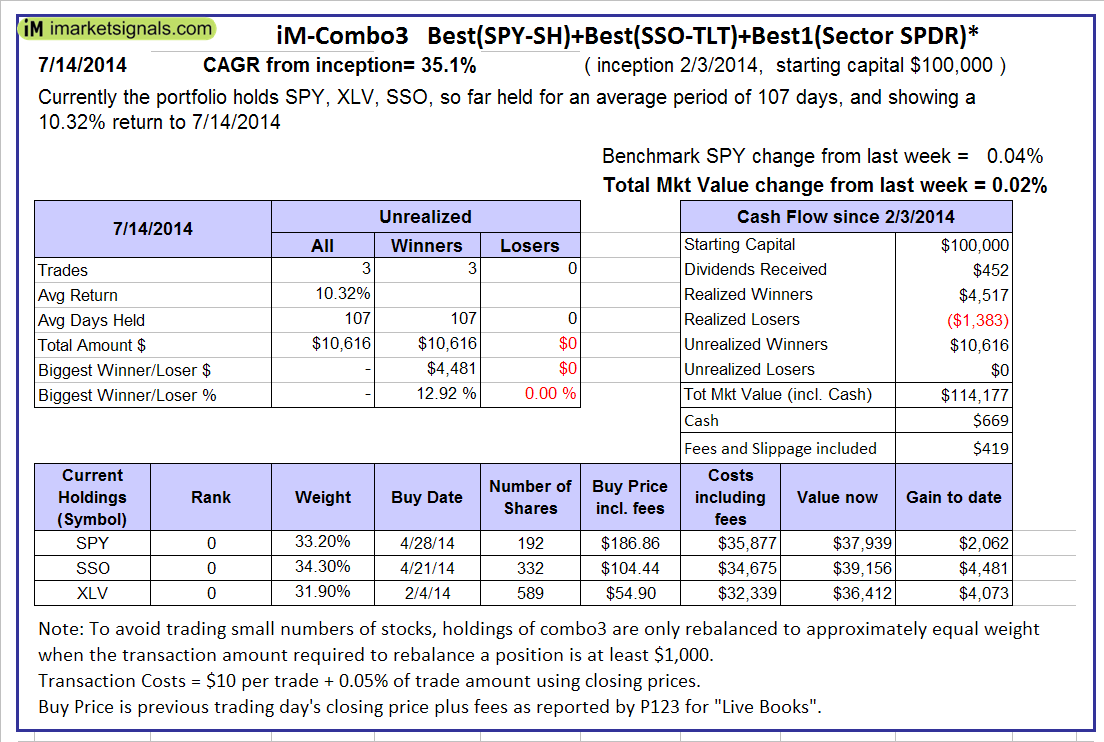
The iM-Combo3 portfolio currently holds SH, XLV, and TLT so far held for an average period of 123 days, and showing a 4.58% return to 12/15/2014. Over the previous week the market value of iM-Combo3 gained -2.08% at a time when SPY gained -3.44%. A starting capital of $100,000 at inception on 2/3/2014 would have grown to $118,528 which includes $1,696 in cash and excludes $874 in fees and slippage. |
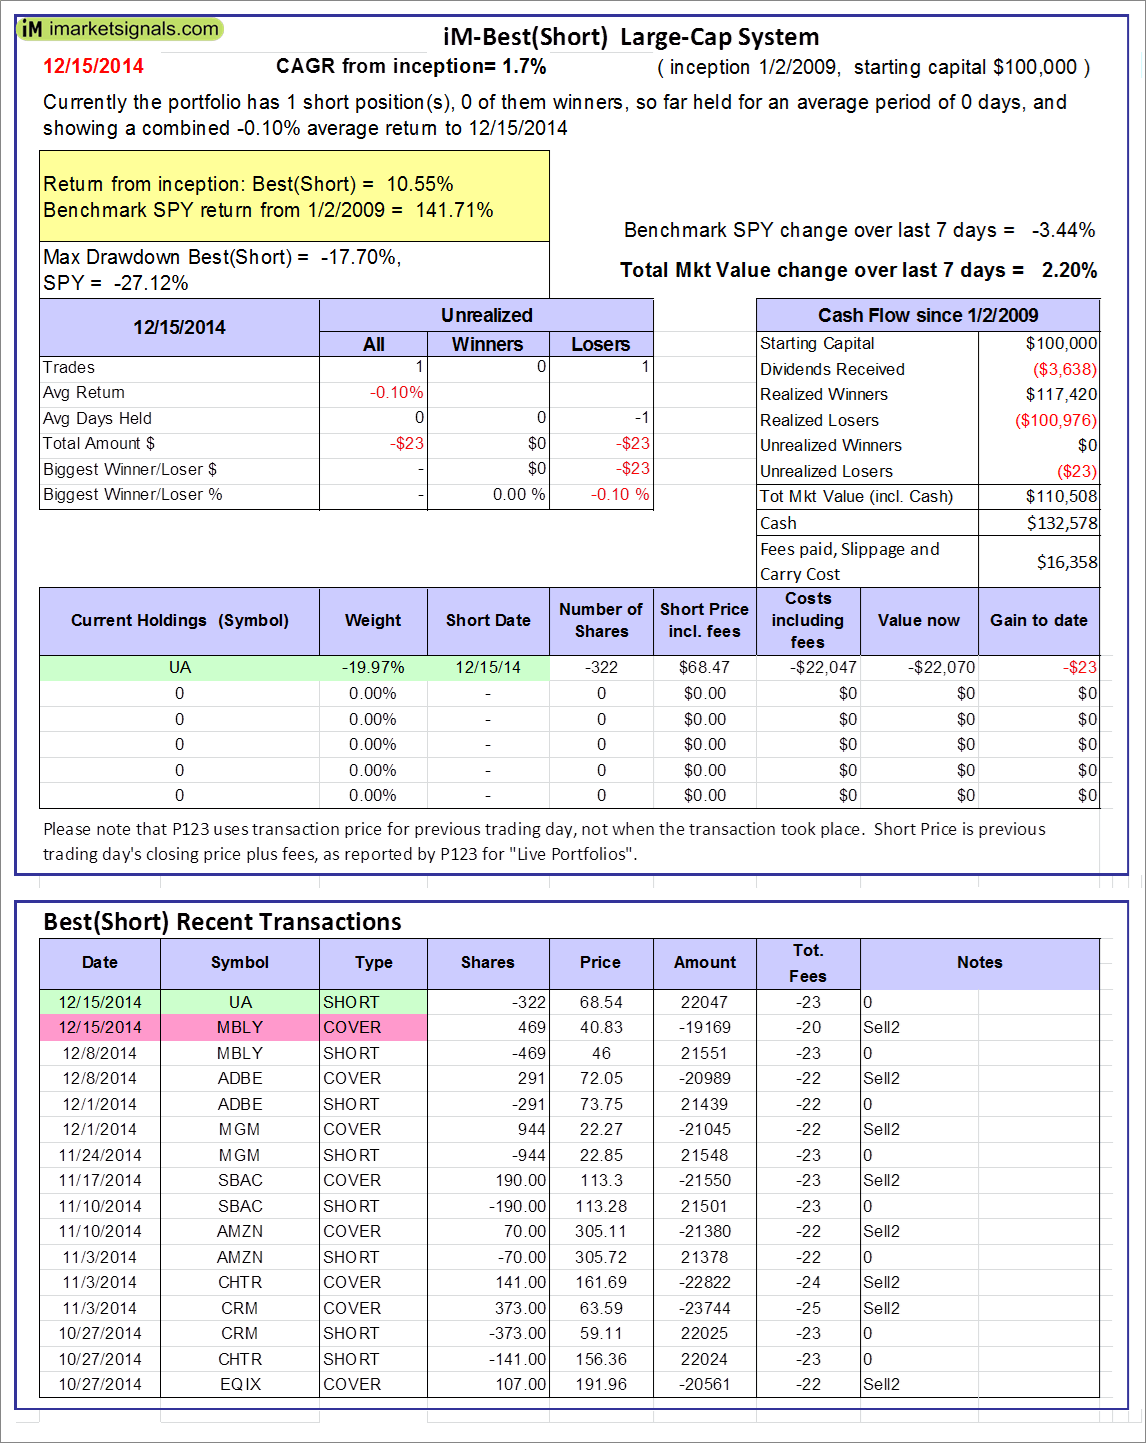 |
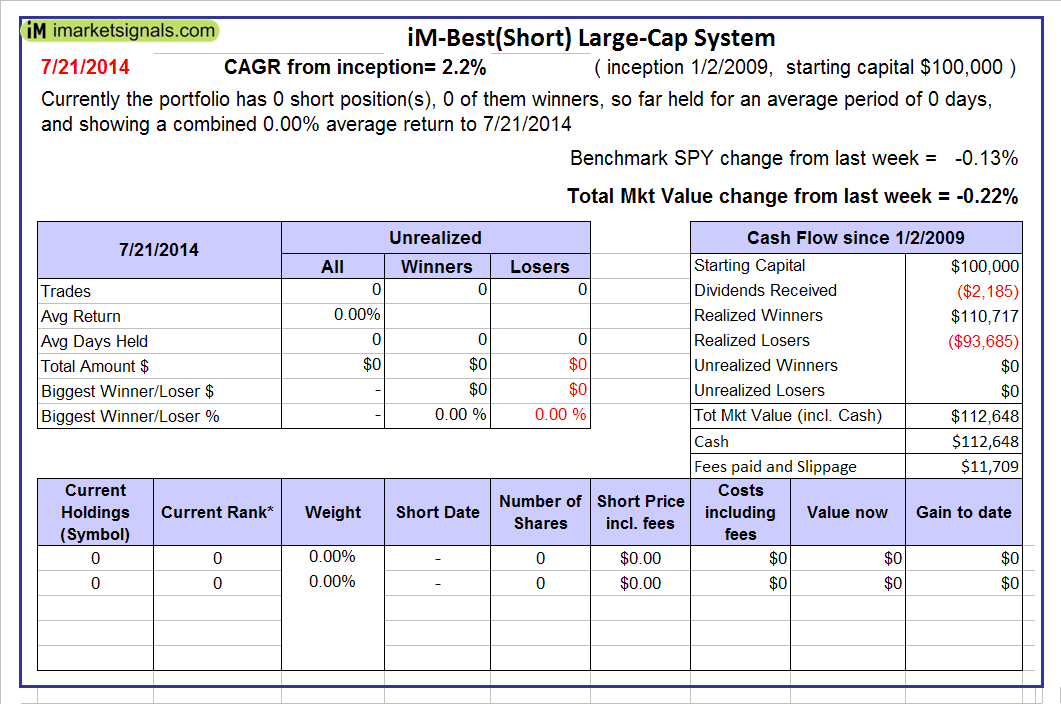
The iM-Best(Short) portfolio currently has 1 short positions. Over the previous week the market value of Best(Short) gained 2.20% at a time when SPY gained -3.44%. Over the period 1/2/2009 to 12/15/2014 the starting capital of $100,000 would have grown to $110,508 which is net of $16,358 fees and slippage. |
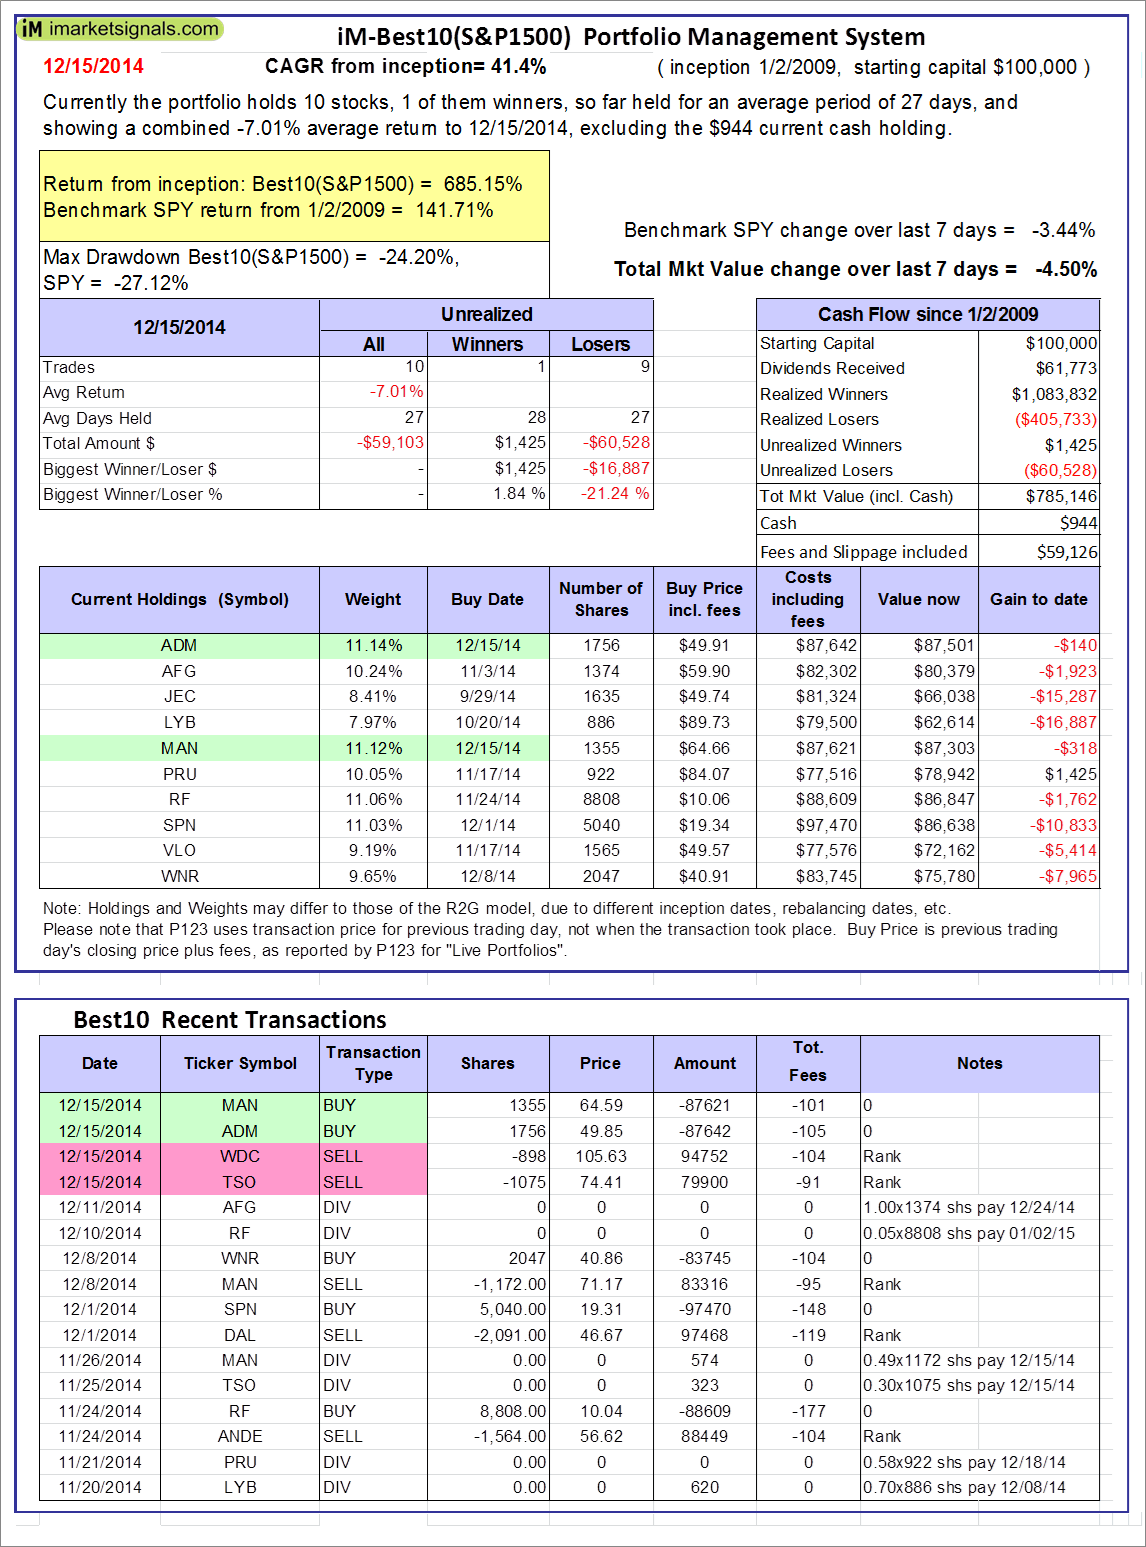 |
iM-Best10(S&P 1500) portfolio currently holds 10 stocks, 1 of them winners, so far held for an average period of 27 days, and showing combined -0.29% average return to 12/15/2014. Over the previous week the market value of iM-Best10(S&P 1500) gained -7.01% at a time when SPY gained -3.44%. A starting capital of $100,000 at inception of 1/2/2009 would have grown to $785,146 which includes $944 cash and excludes $59,126 spent on fees and slippage. |
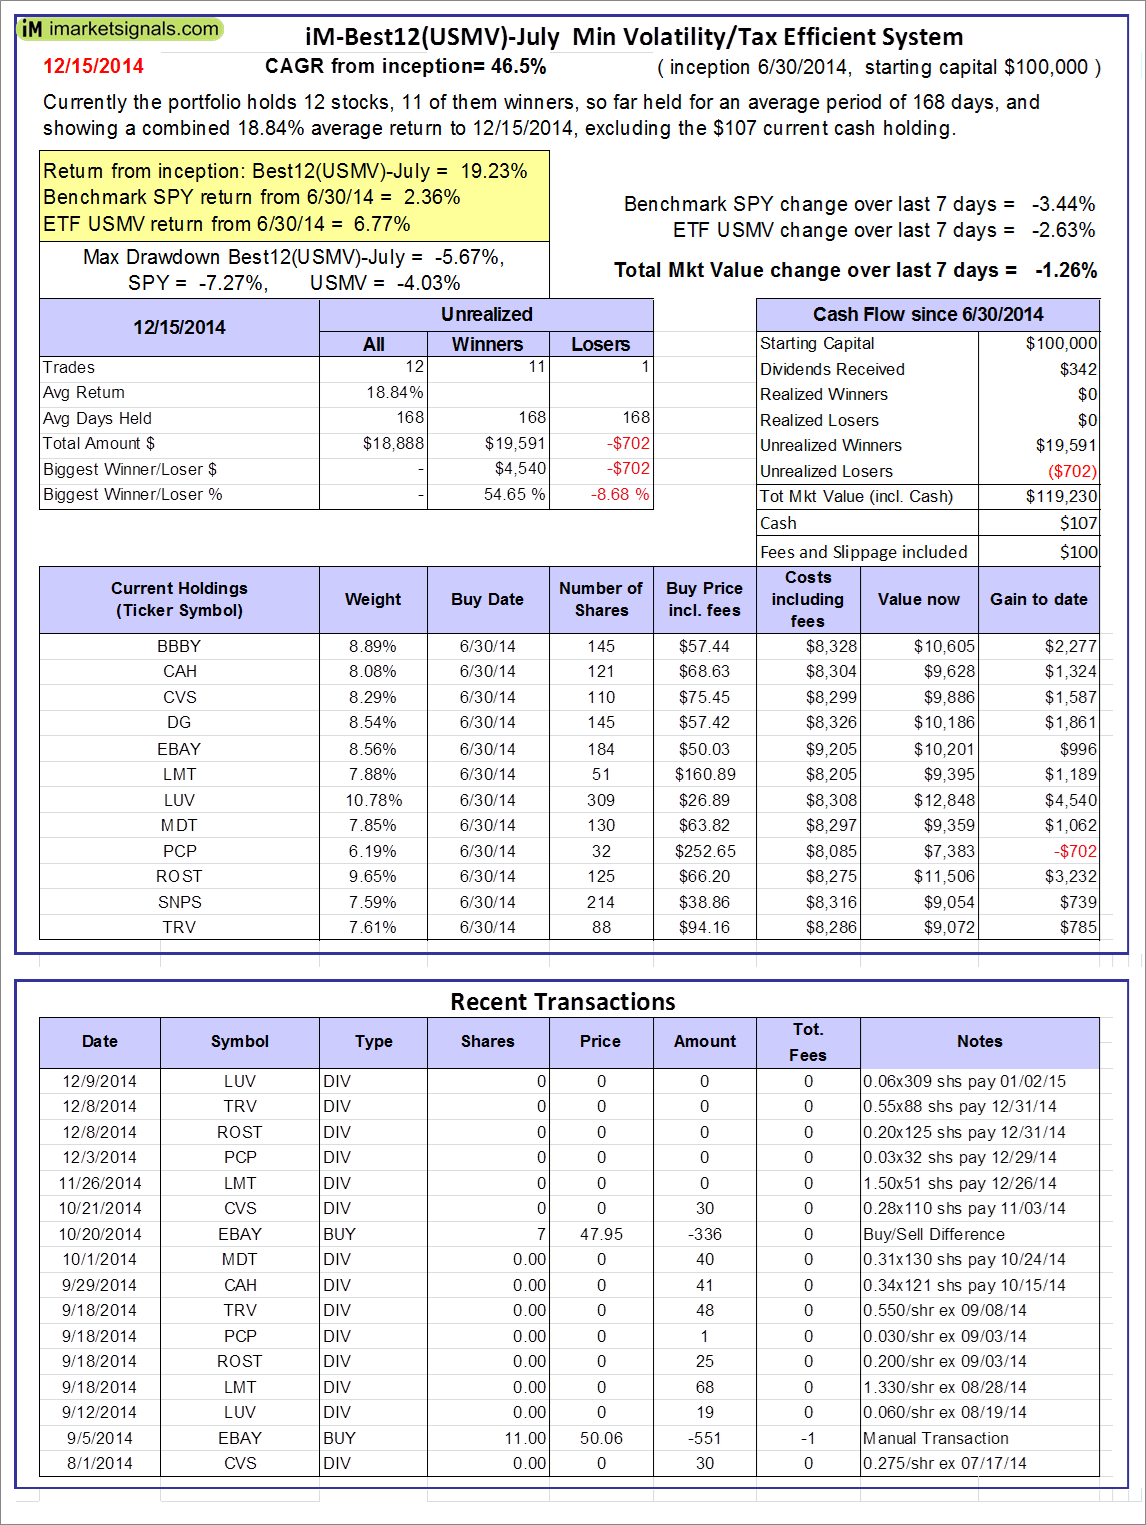 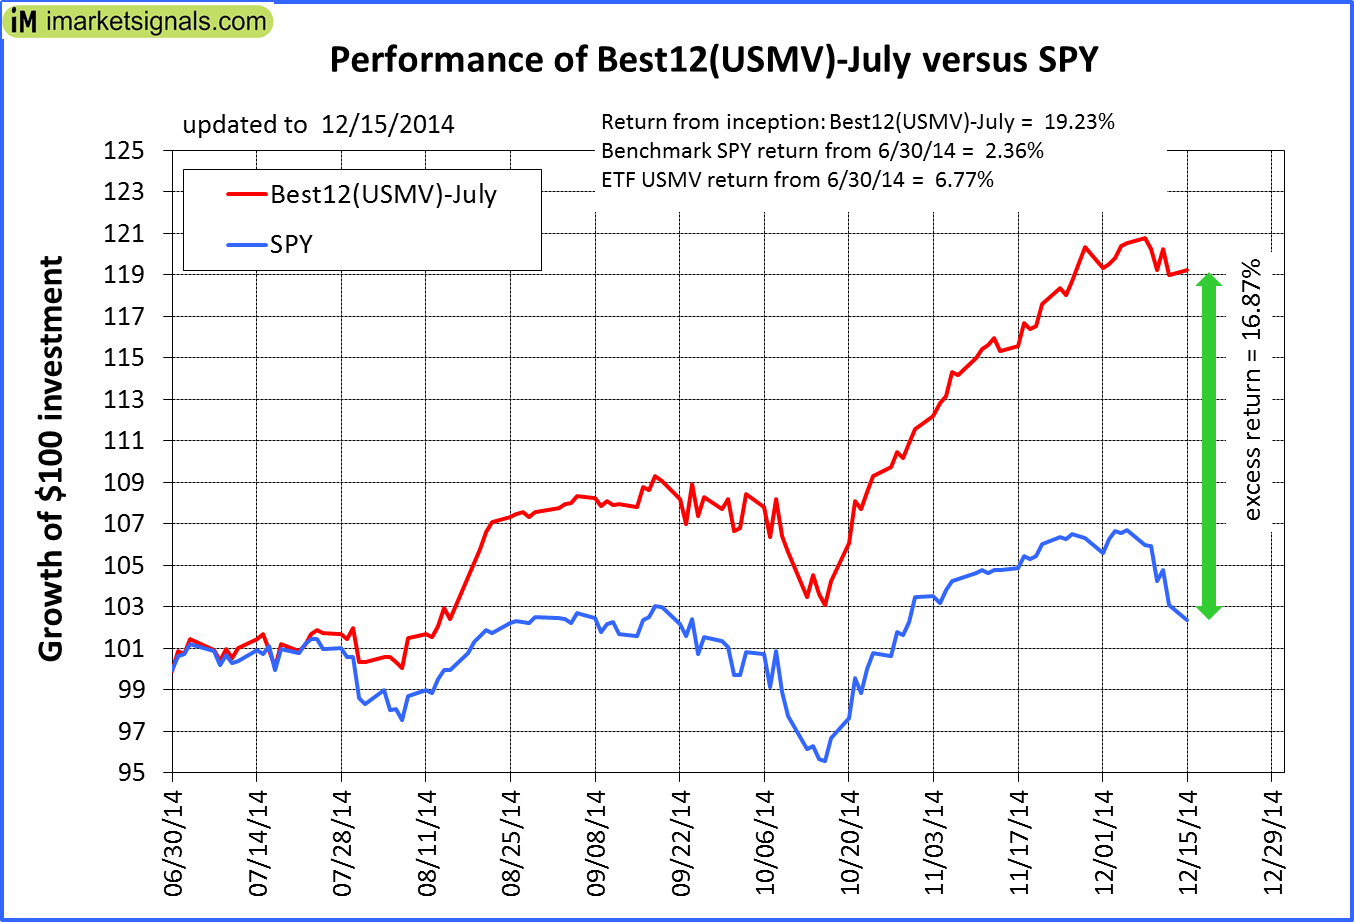 |
The iM-Best12(USMV)-July-2014 Currently the portfolio holds 12 stocks, 11 of them winners, so far held for an average period of 168 days and showing combined 18.84% average return to 12/15/2014. Since inception, on 6/30/2014, the model gained 19.23% while the benchmark SPY gained 2.36% and the ETF USMV gained 6.77%ver the same period. Over the previous week the market value of iM-Best12(USMV)-July gained -1.26% at a time when SPY gained -3.44%. A starting capital of $100,000 at inception on 6/30/2014 has grown to $119,230 which includes $107 cash and $100 for fees and slippage. |
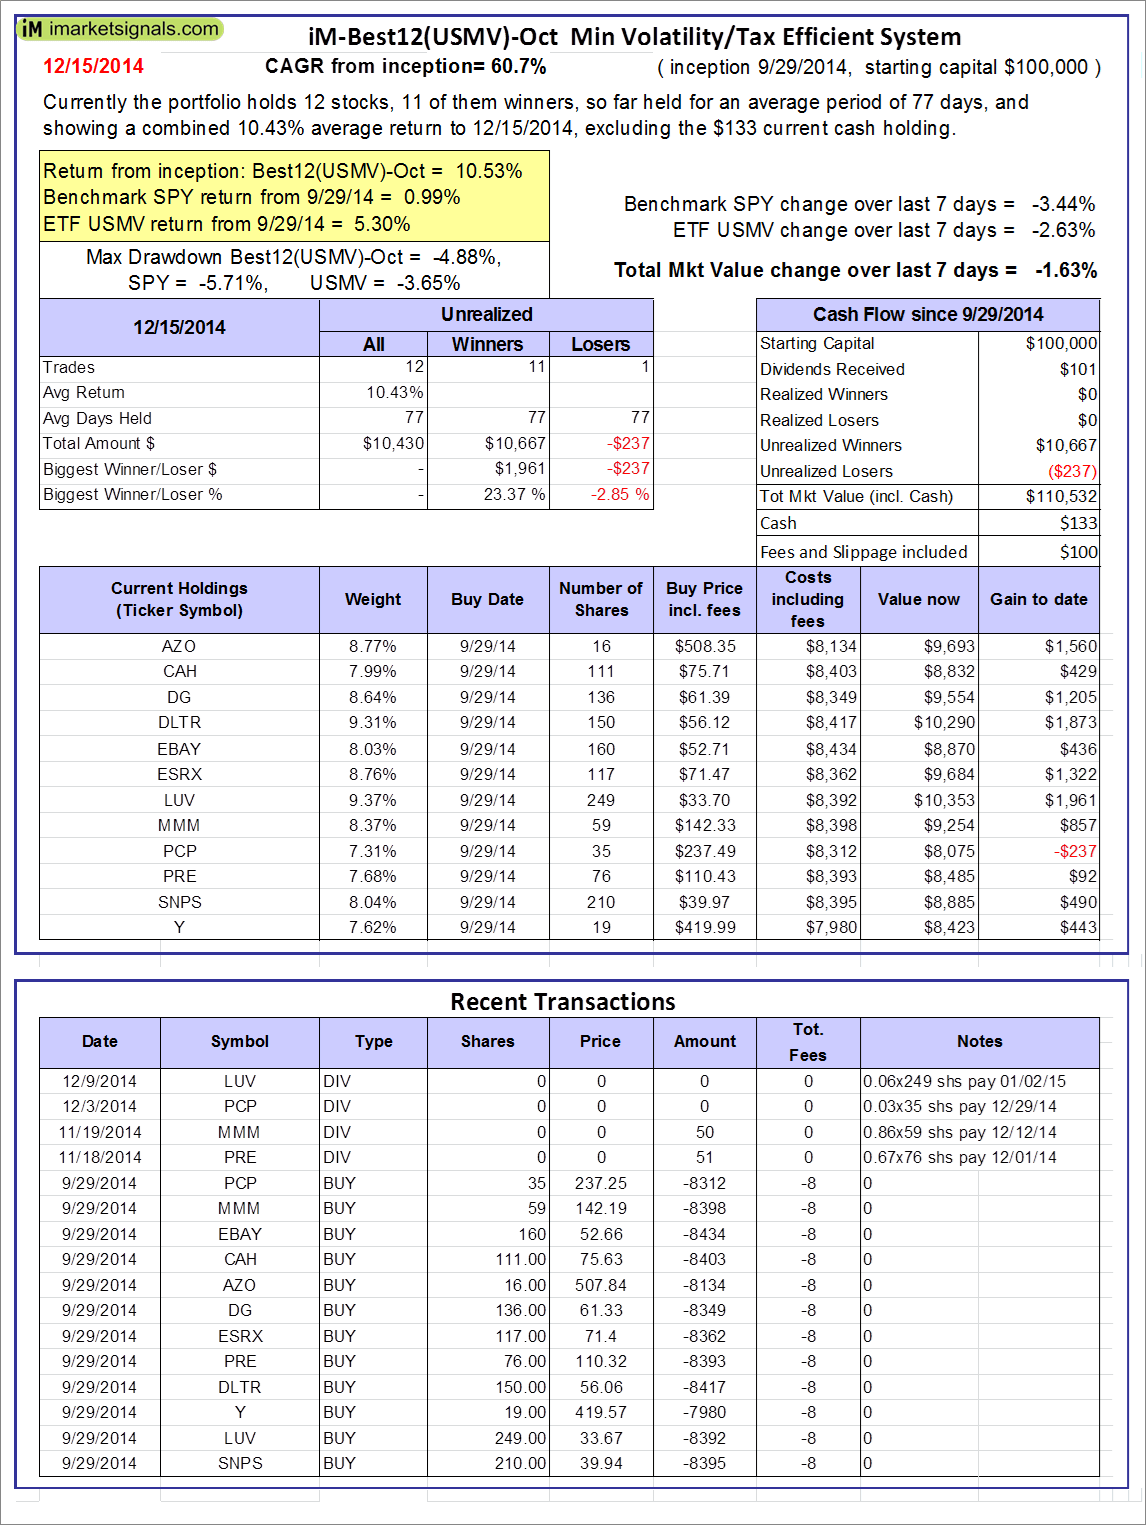 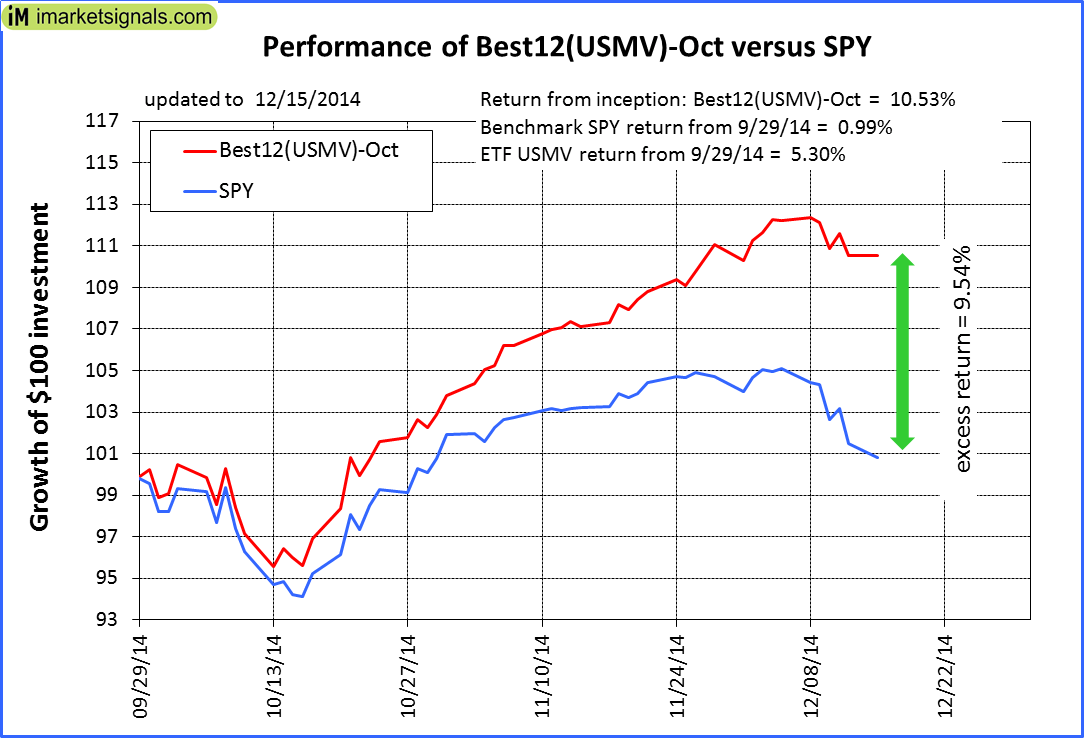 |
The iM-Best12(USMV)-October-2014 Currently the portfolio holds 12 stocks, 11 of them winners, so far held for an average period of 77 days, and showing combined 10.34% average return to 12/15/2014. Since inception, on 9/29/2014, the model gained 10.53% while the benchmark SPY gained 0.99% and the ETF USMV gained 5.30% over the same period. Over the previous week the market value of iM-Best12(USMV)-October gained -1.63% at a time when SPY gained -3.44%. A starting capital of $100,000 at inception on 9/29/2014 has grown to $110,532 which includes $133 cash and $100 for fees and slippage. |
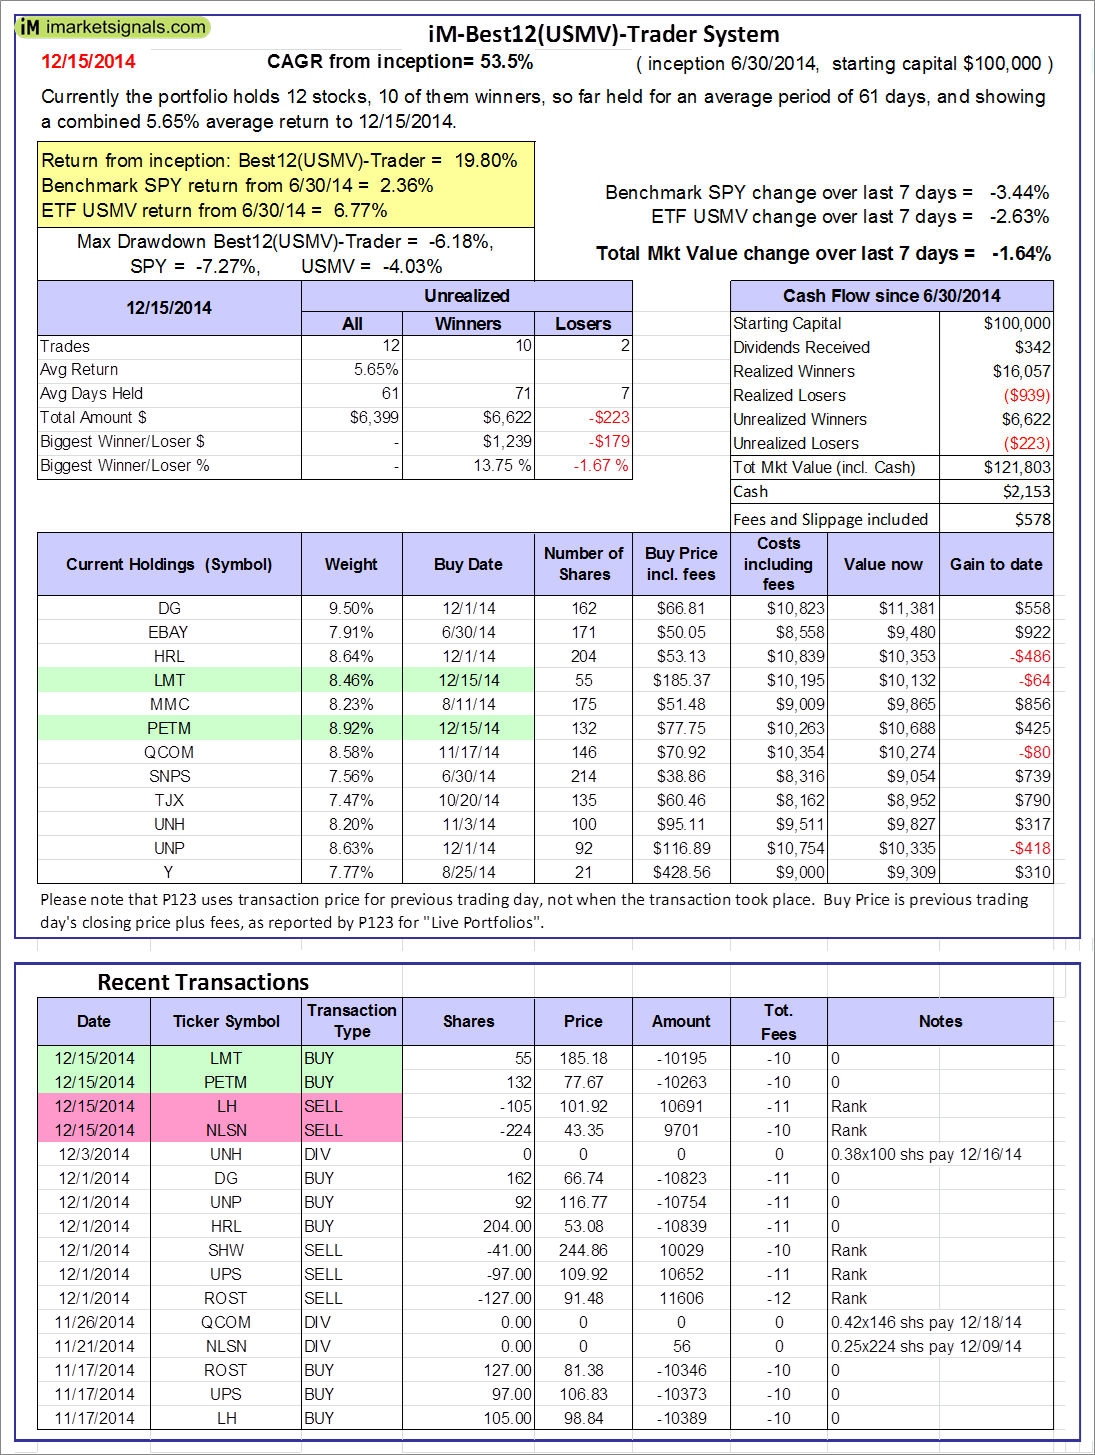 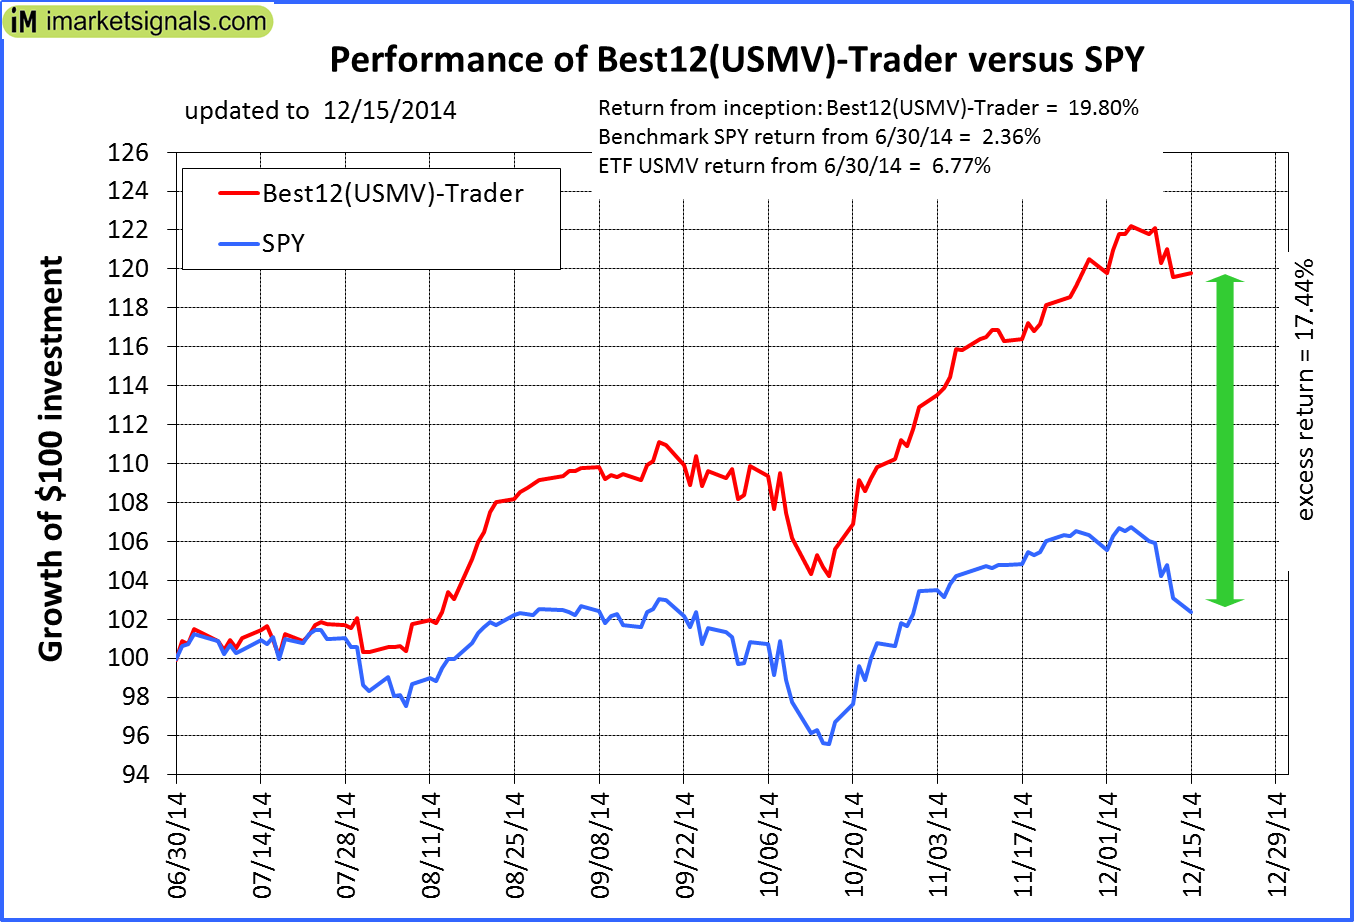 |
The iM-Best12(USMV)-Trader Currently the portfolio holds 12 stocks, 10 of them winners, so far held for an average period of 61 days, and showing combined 5.65% average return to 12/15/2014. Since inception, on 6/30/2014, the model gained 19.80% while the benchmark SPY gained 2.36% and the ETF USMV gained 6.77% over the same period. Over the previous week the market value of iM-Best12(USMV)-Trader gained -1.64% at a time when SPY gained -3.44%. A starting capital of $100,000 at inception on 6/30/2014 has grown to $121,803 which includes $2,153 cash and $578 for fees and slippage. |
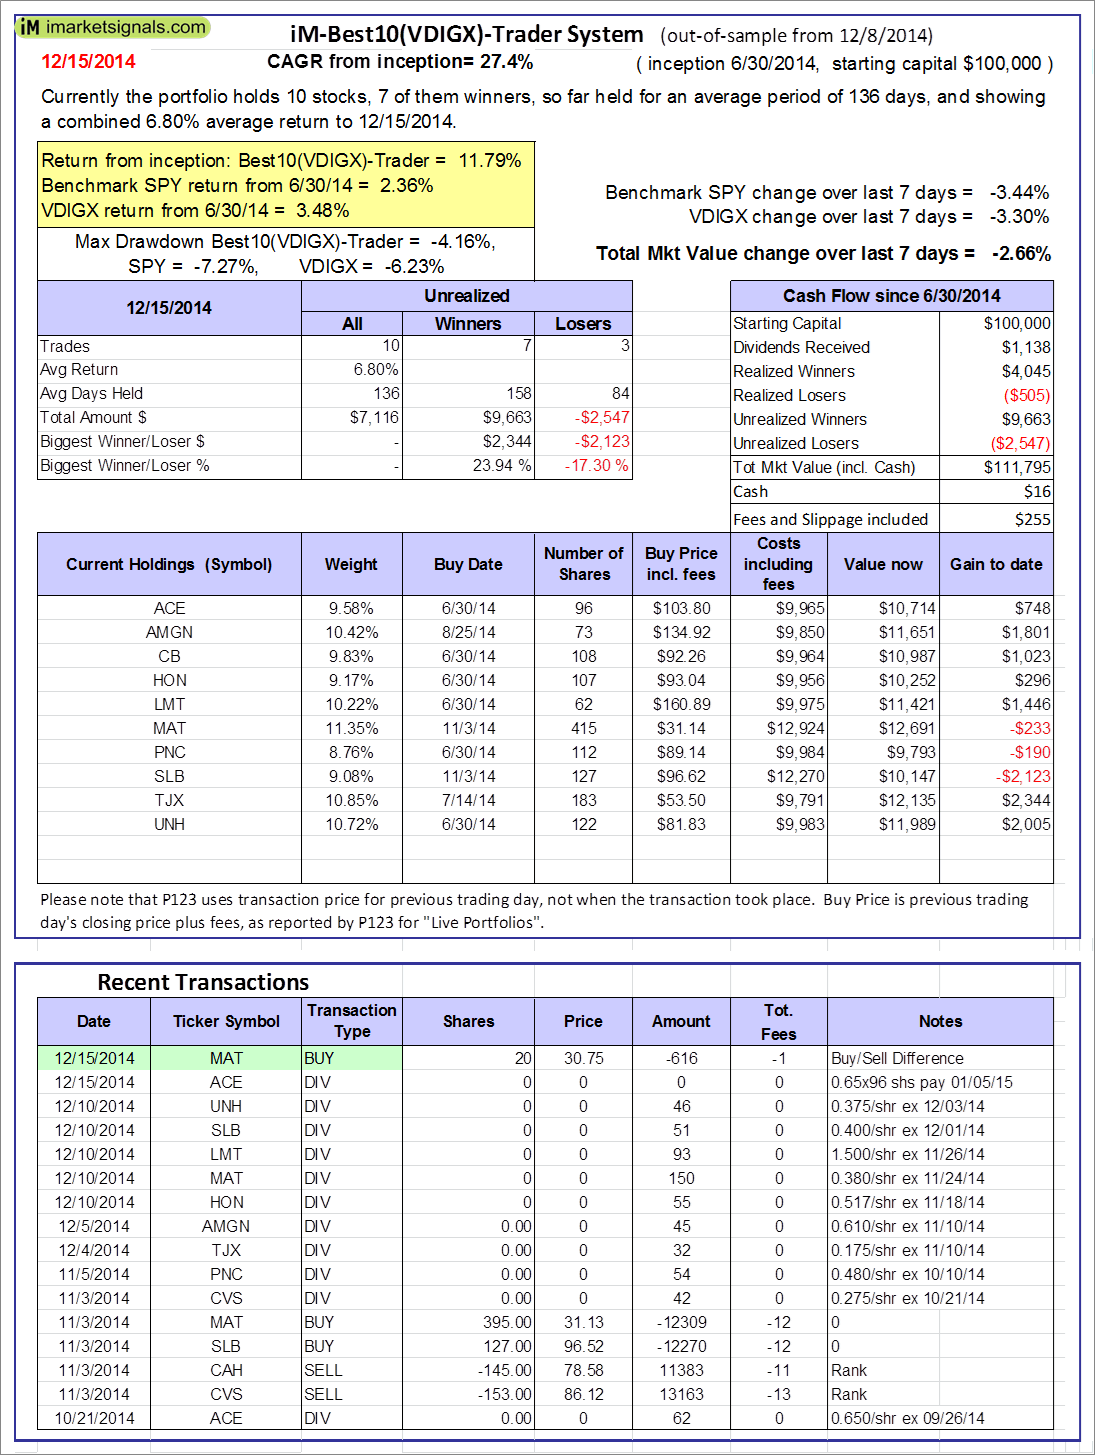 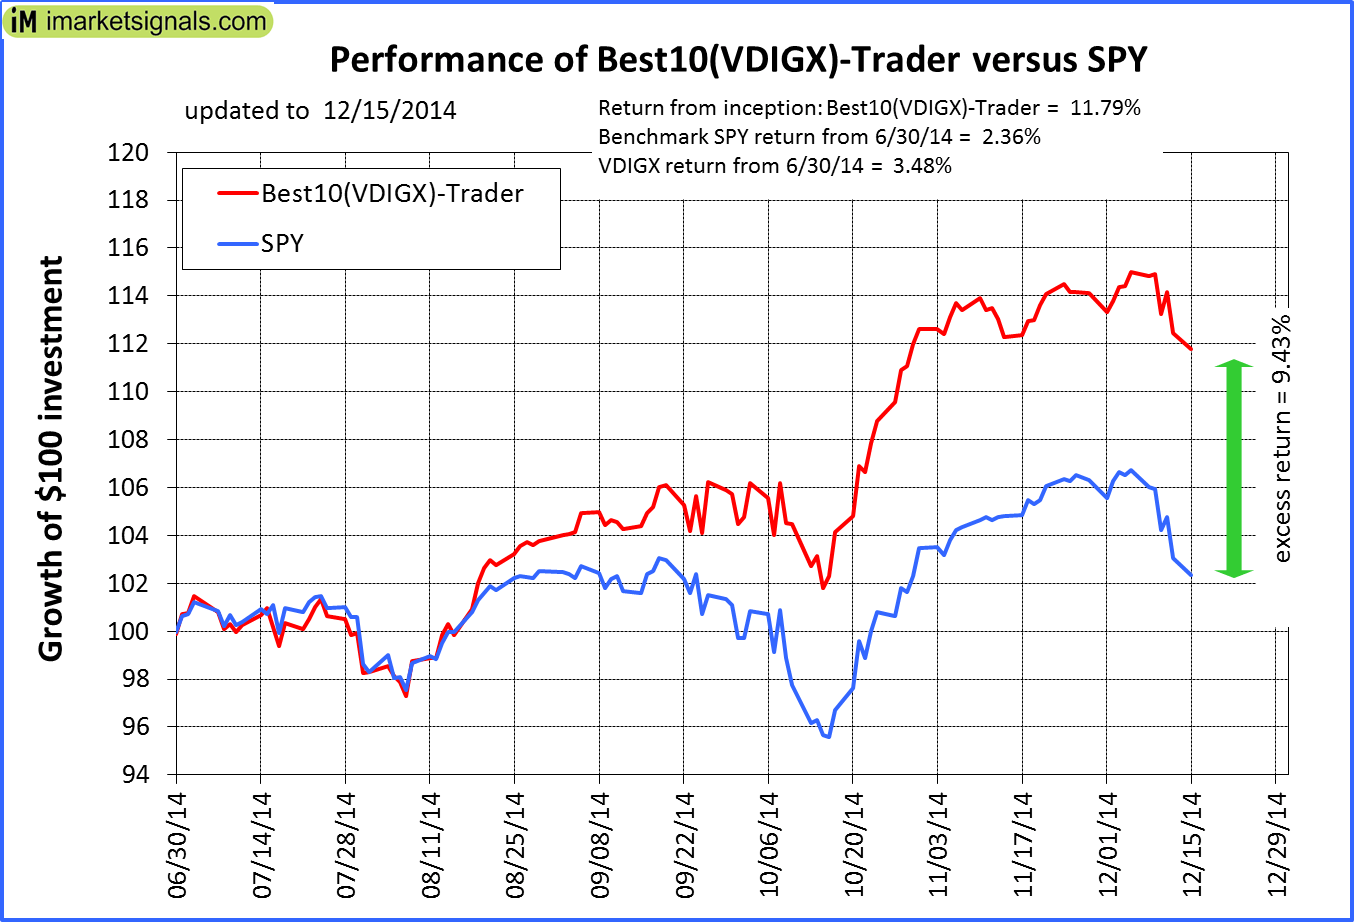 |
The iM-Best10(VDIGX)-Trader Currently the portfolio holds 10 stocks, 7 of them winners, so far held for an average period of 136 days, and showing combined 10.16% average return to 12/15/2014. Since inception, on 6/30/2014, the model gained 11.79% while the benchmark SPY gained 2.36% and the VDIGX gained 3.48% over the same period. Over the previous week the market value of iM-Best10(VDIGX)-Trader gained -2.66% at a time when SPY gained -3.44%. A starting capital of $100,000 at inception on 6/30/2014 has grown to $111,795 which includes $16 cash and $255 for fees and slippage. |
December 18, 2014
Business Cycle Index
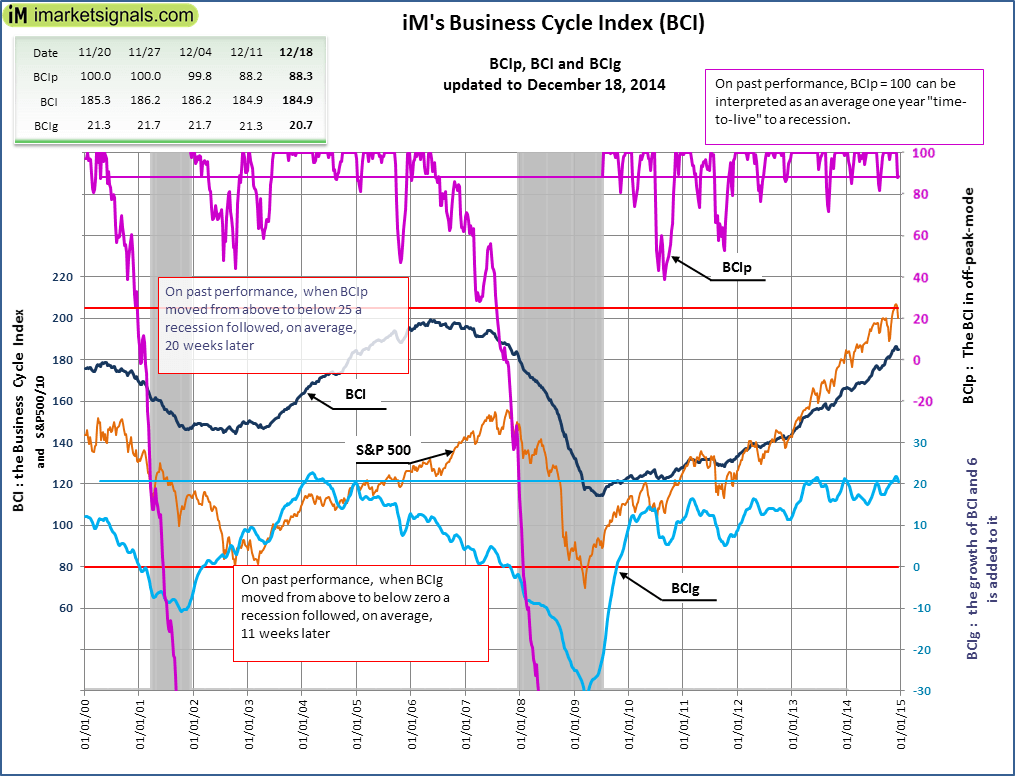 The BCI at 184.9 is unchanged from last week’s downwards revised 184.9. No recession is signaled by both the derived indicators; BCIg, expressed to one decimal place at 20.7 is down from last week’s 21.3, and BCIp at 88.3 indicates that, for this business cycle, BCI is slightly down from its previous peak.
December 19, 2014
Market Signals Summary:
The IBH stock market model is out of the market. The MAC stock market model is invested, The recession indicator COMP is up from last week’s revised level, and iM-BCIg is downfrom last week’s level. MAC-AU is out of the market. The bond market model avoids high beta (long) bonds, the yield curve has long-term steepening trend, both the gold and silver model are invested.
Stock-markets:
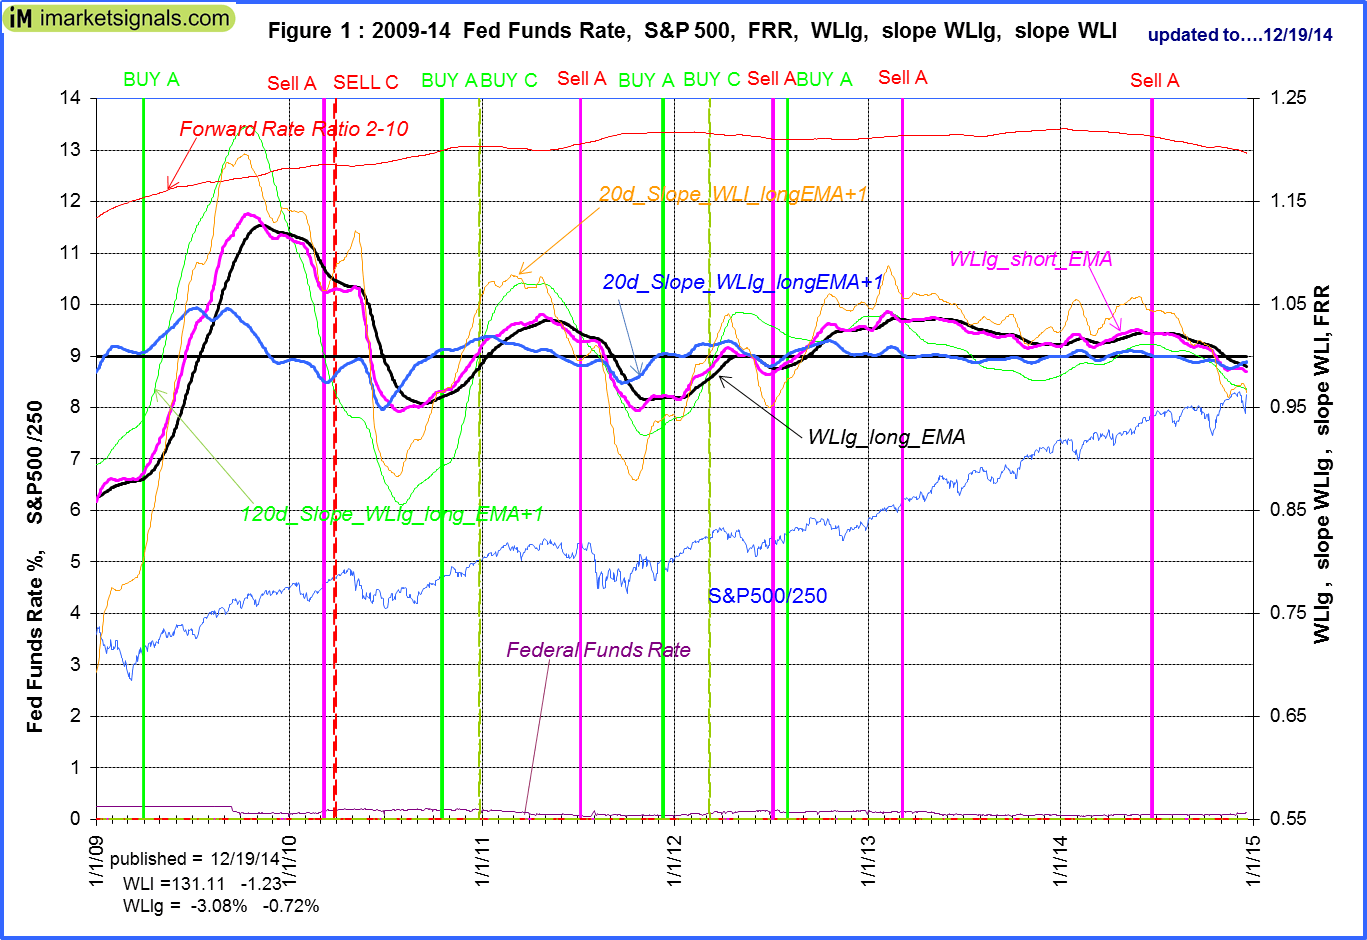 The IBH-model is out of the market as shown in Fig. 1. A Sell A signal was generated 25 weeks ago. The IBH-model is described here and the latest rules can be found here .
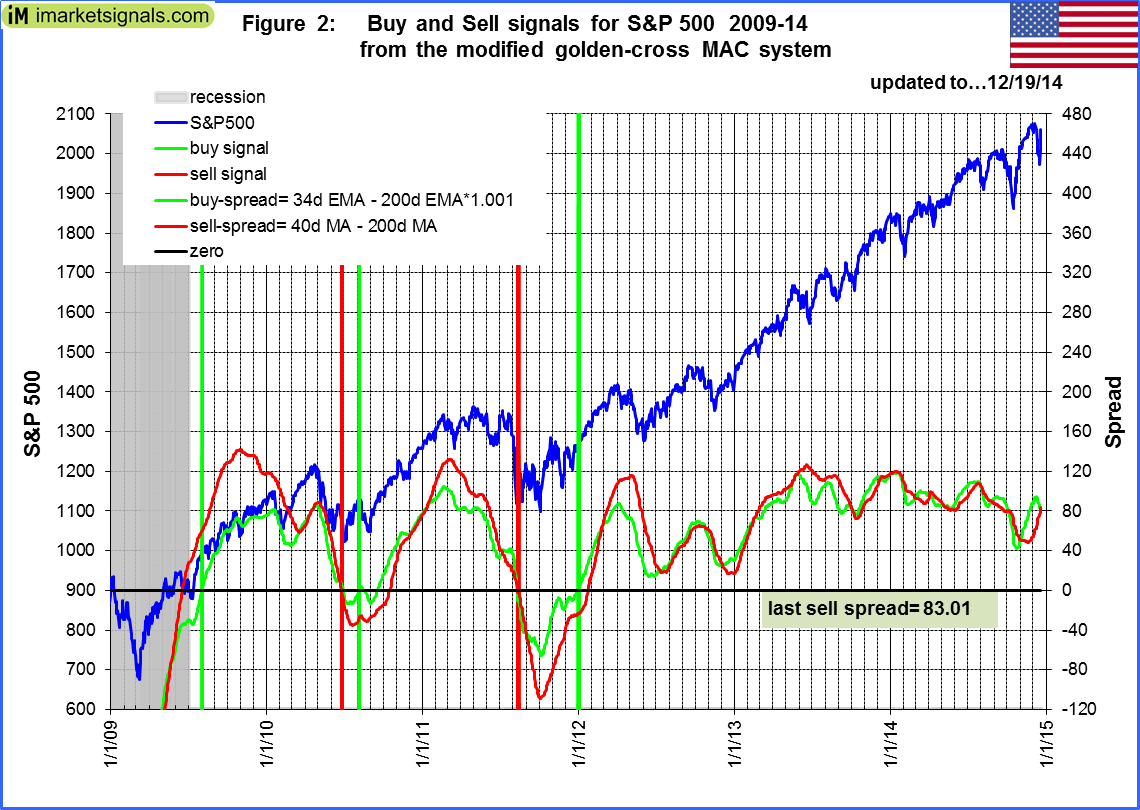 The MAC-US model stays invested. MAC-US Fig 2 shows the spreads of the moving averages. The sell-spread is up from last week’s level. A sell signals is not imminent. The sell spread (red graph) has to move below the zero line for a sell signal.
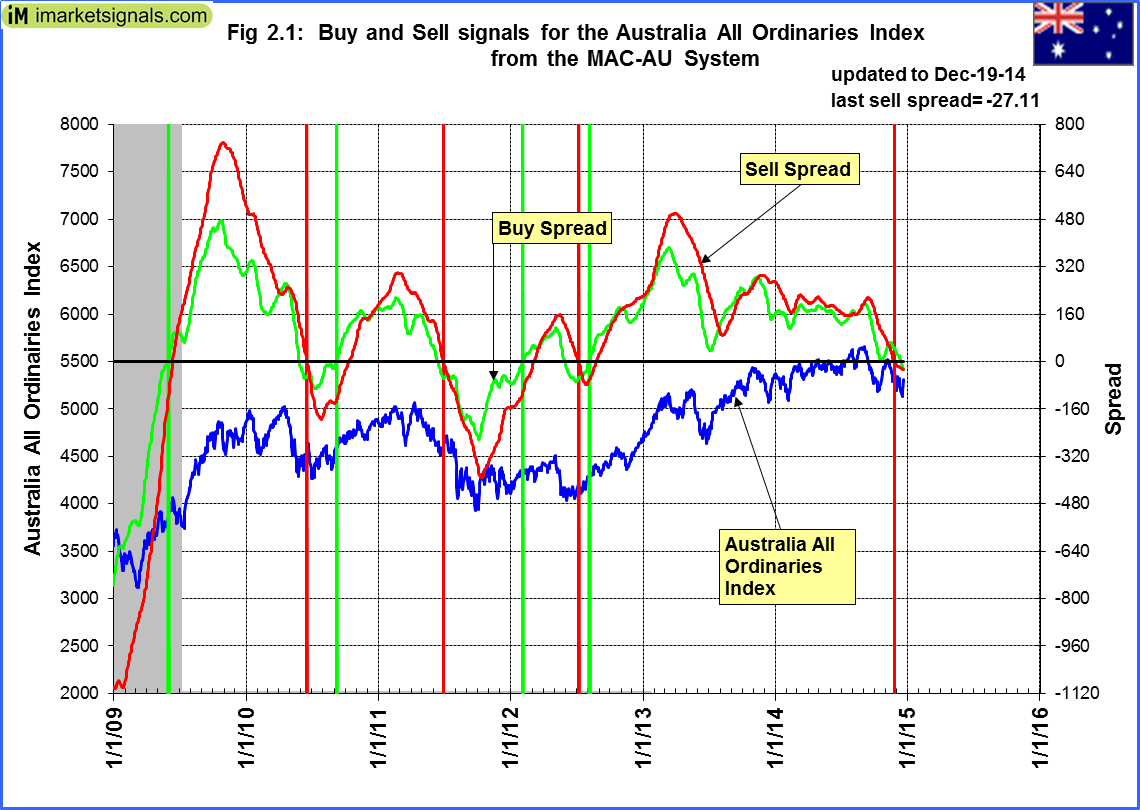 The MAC-AU model is out of the market, although it may be very close to a sell signal. A sell signal was generated on Nov-25. The model switched to interest bearing instruments. MAC-AU Fig 2.1 shows the spreads of the moving averages of the Australia All Ordinaries Index. The sell-spread is lower than last week’s level. The sell spread (red graph) has moved below the zero line for a sell signal. A buy signal will only be generated when the buy-spread (green graph) moves from below to above zero
This model and its application is described in MAC-Australia: A Moving Average Crossover System for Superannuation Asset Allocations.
Recession:
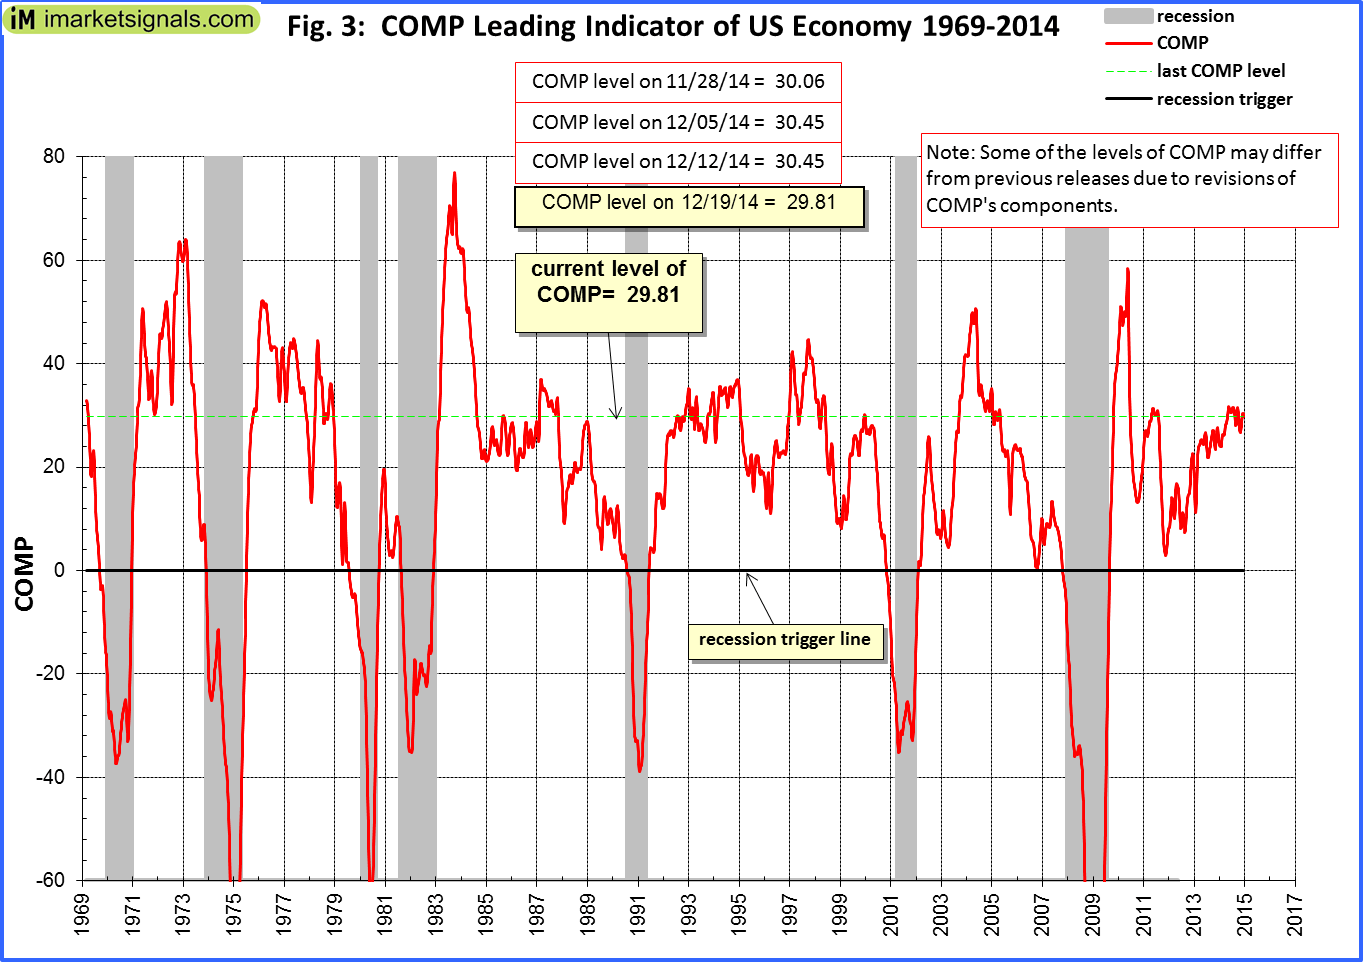
In Fig. 3 one can see that COMP is higher from last week’s level, and far away from signaling recession. COMP can be used for stock market exit timing as discussed in this article The Use of Recession Indicators in Stock Market Timing.
 Fig. 3.1 shows our recession indicator iM-BCIg, is downfrom last week’s revised level. A recession is not imminent as one can clearly see.
Please also refer to the BCI page
Bond-market:
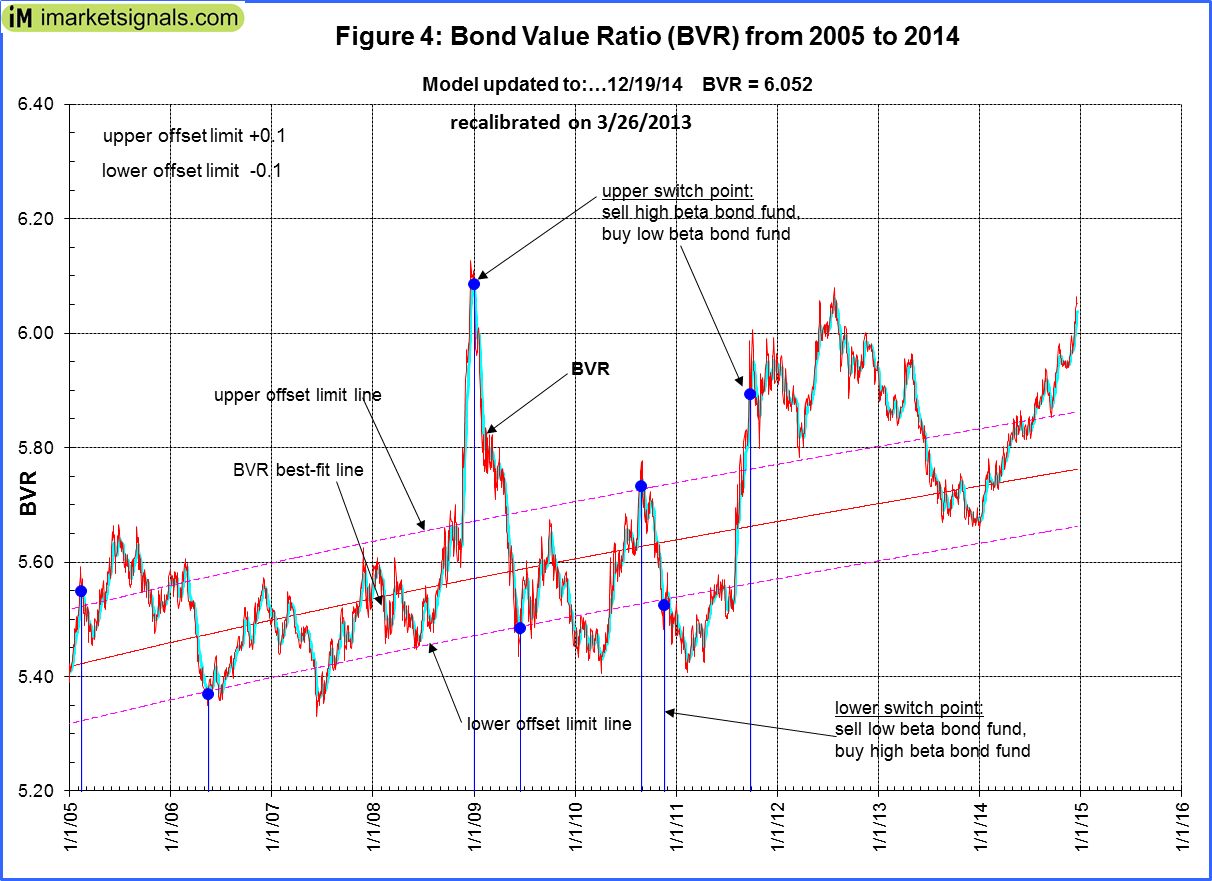
The BVR-model avoids high beta bonds (long-bonds) and also intermediate duration bonds.
The Bond Value Ratio is shown in Fig 4. The BVR is up from last week’s level. According to the model, only when BVR turns upward after having been lower than the lower offset-line should one consider long bonds again.
One can see by the upward sloping graph that long bonds gained from January 2014 onward. The model failed to signal the lower turning point of BVR.
The Yield Curve:
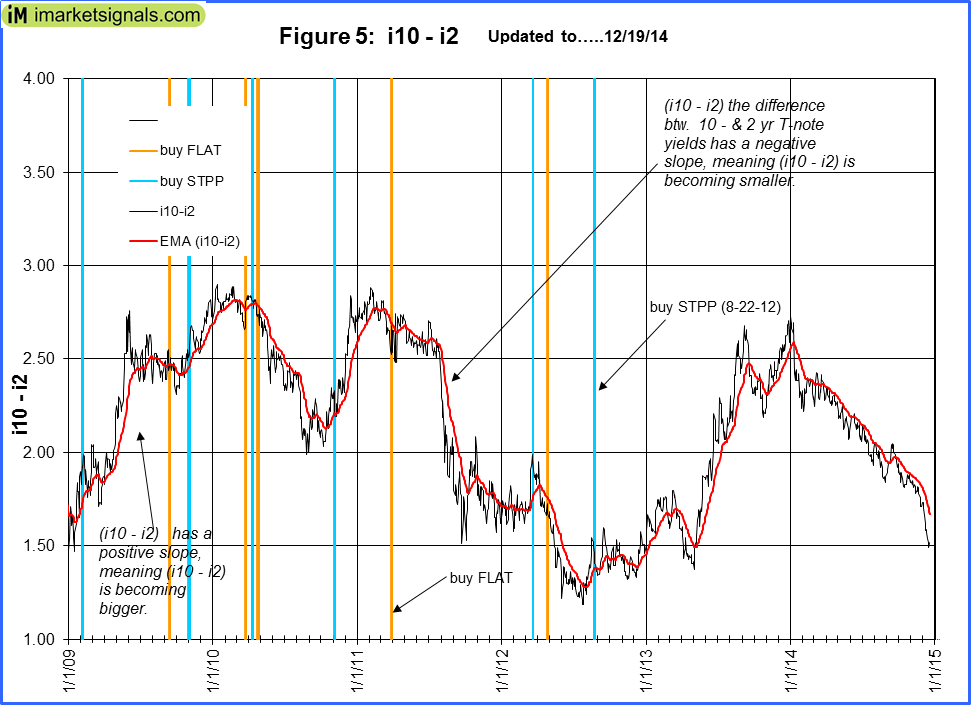 The yield curve model shows the generally steepening trend from mid 2012 of the 10-year and 2-year Treasuries yield spread. Figure 5 charts (i10 – i2). Although the curve has flattened from the beginning of 2014, the general trend from middle of 2012 is up. FLAT and STPP are ETNs. STPP profits from a steepening yield curve and FLAT increases in value when the yield curve flattens. This model confirms the direction of the BVR..
Gold:
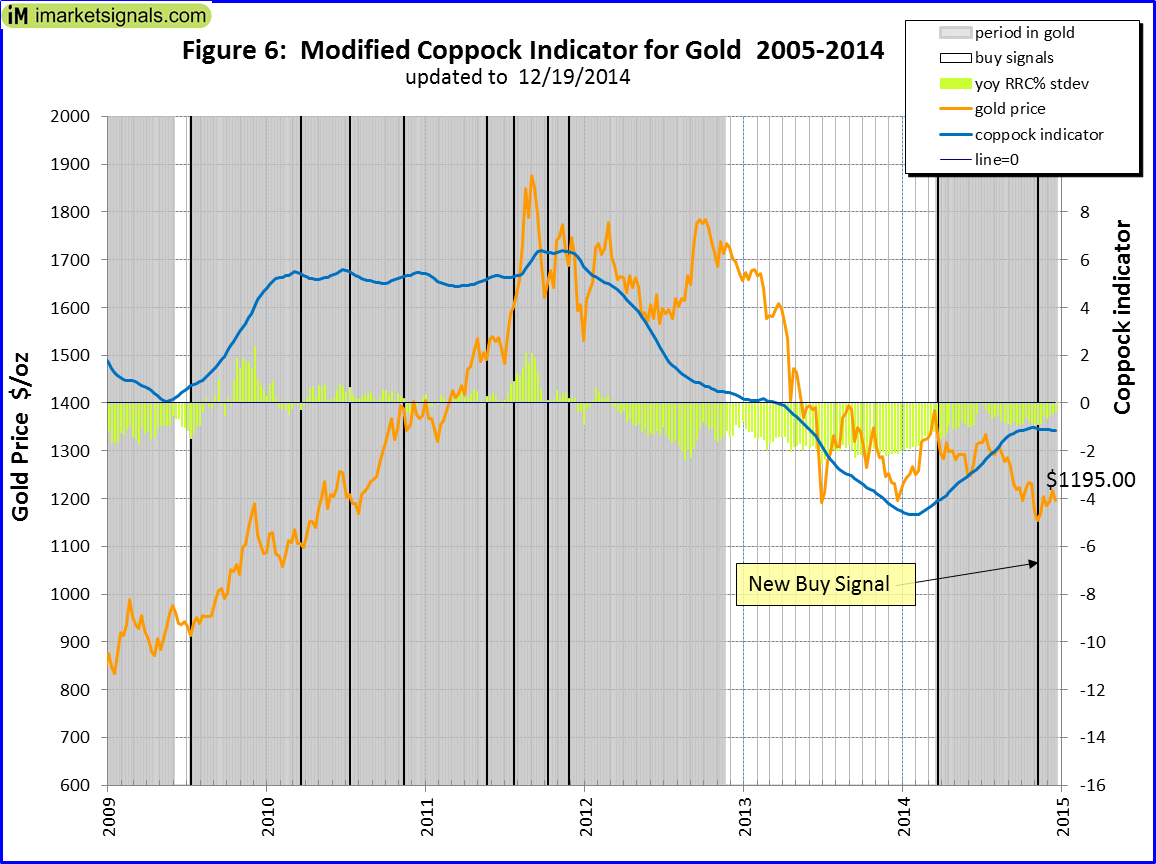 The modified Coppock Gold indicator shown in Fig 6. and is now invested.
This indicator is described in Is it Time to Buy Gold Again? – Wait for the buy signal …….
Silver:
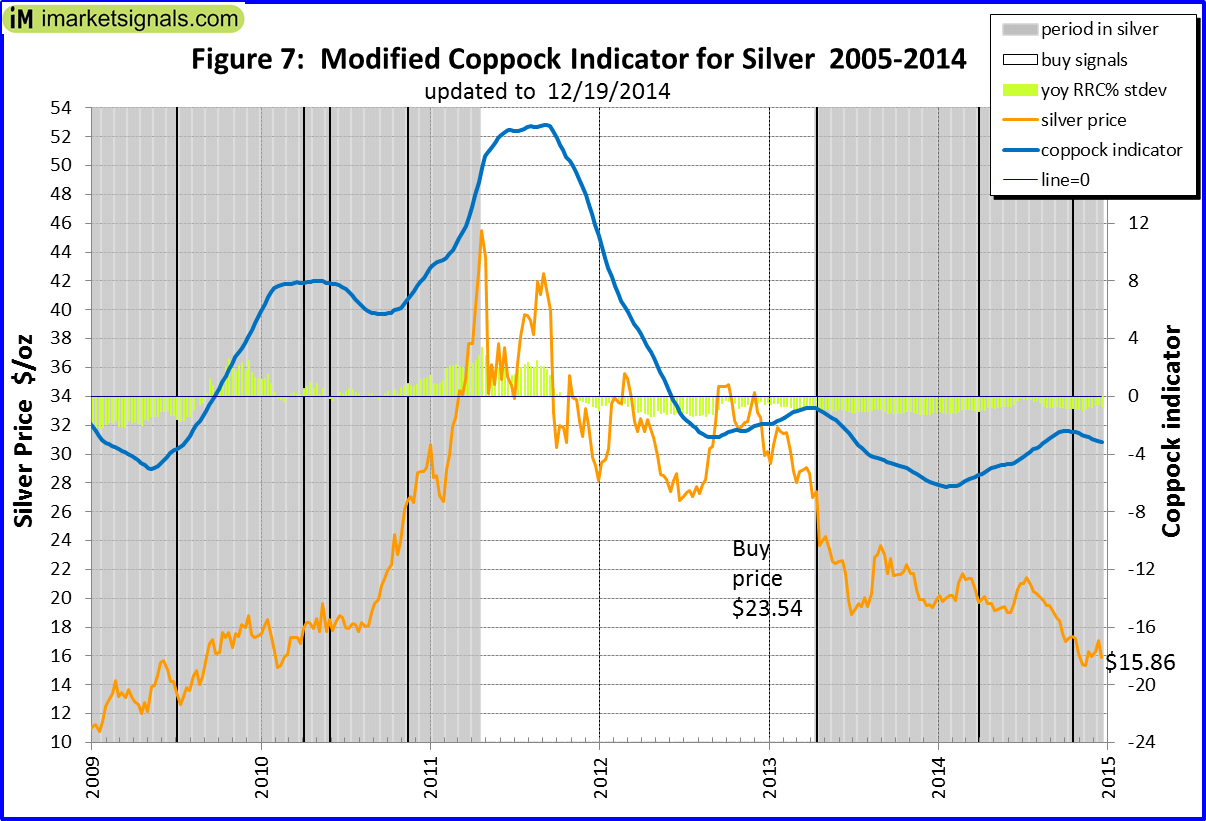 The modified Coppock Silver indicator shown in Fig 7 and is currently invested.
This indicator is described in Silver – Better Than Gold: A Modified Coppock Indicator for Silver.
Monthly Updates
May 8, 2026
Unemployment
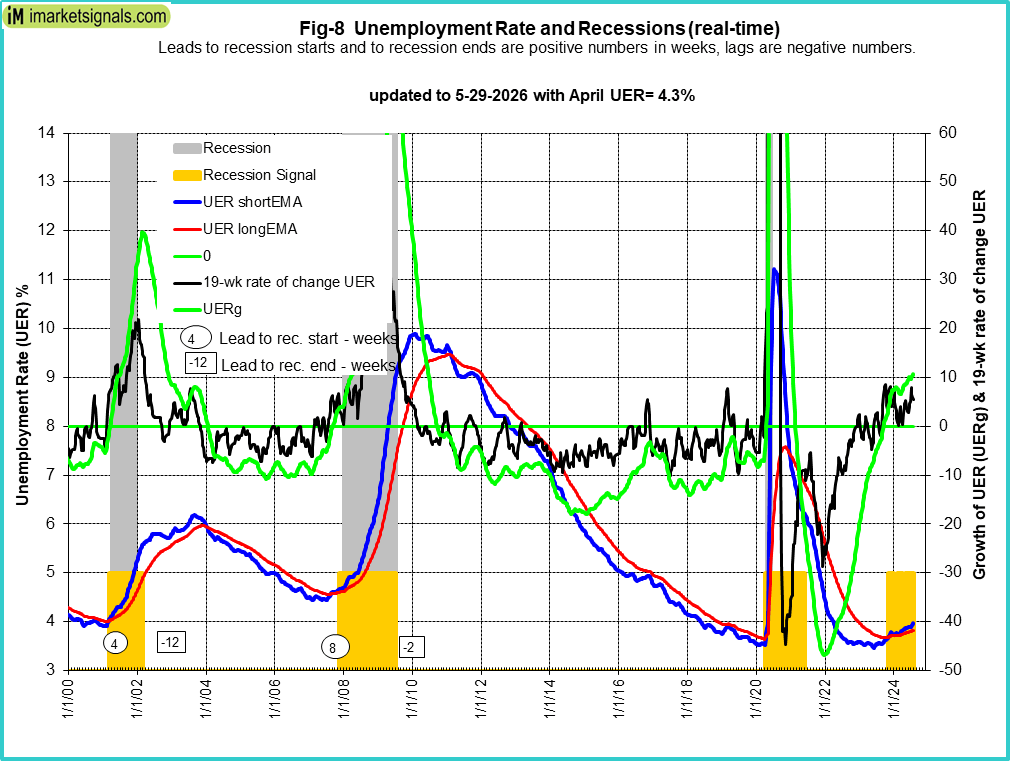
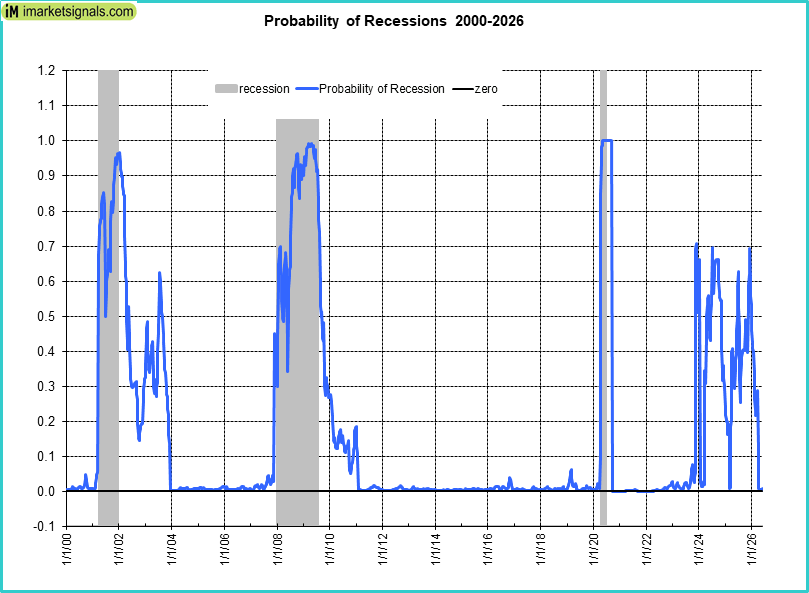
The 5/8/2026 BLS Employment Situation Report reports that the April 2026 unemployment rate remained unchanged at 4.3%.
Our UER model does signal a recession with a near zero recession probability of (see graph).
CAPE-Cycle-ID
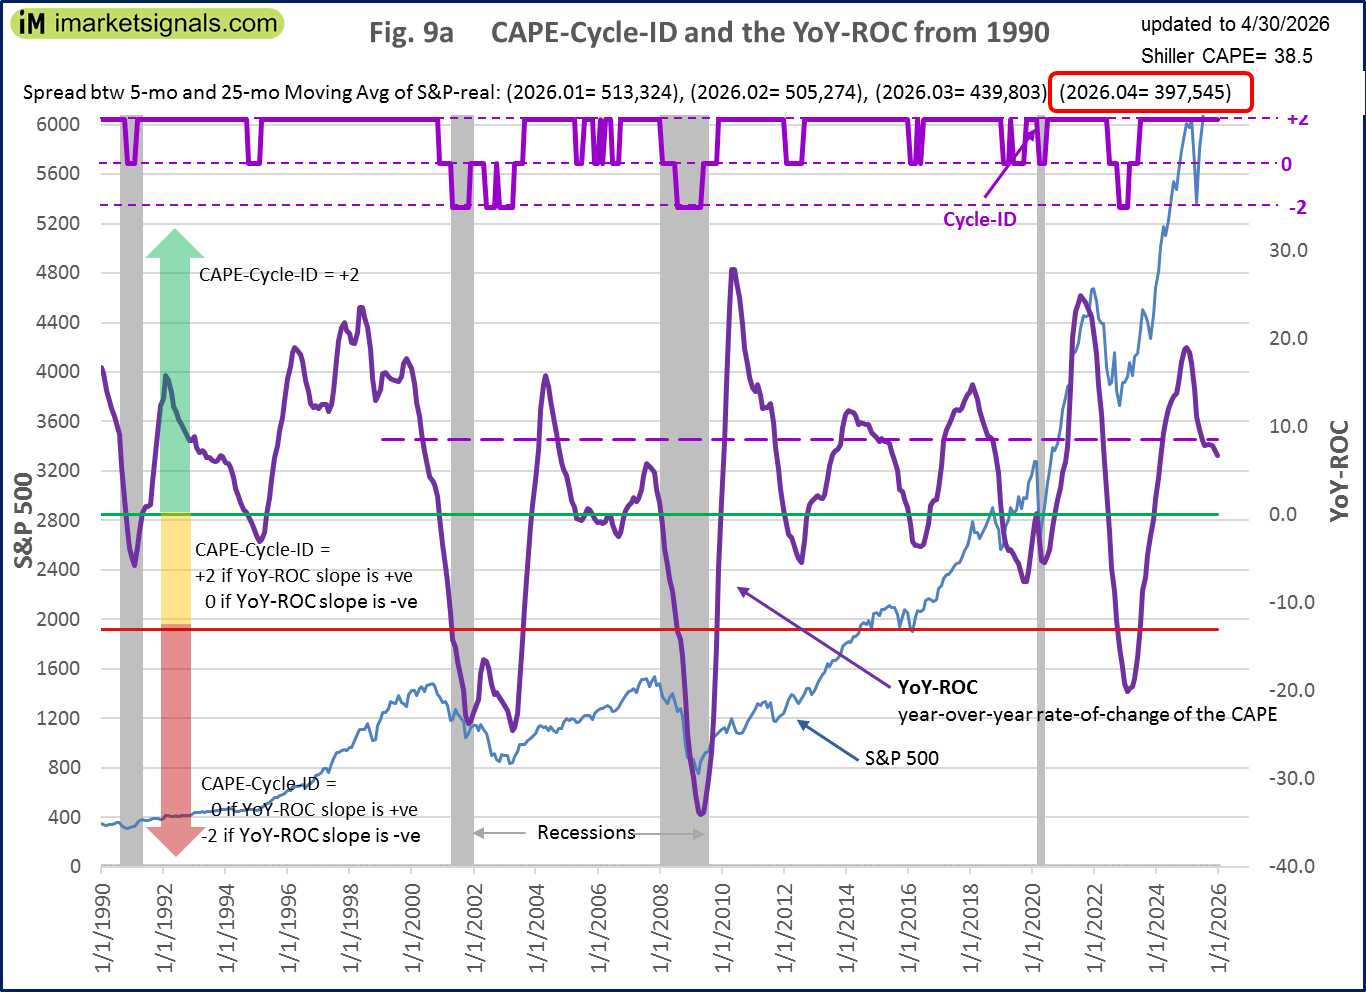 Fig 9a depicts the CAPE-Cycle-ID and the year-on-year rate-of-change of the Shiller CAPE; the level switched from -2 to 0 end of June 2023 generating a buy signal. This indicator now invested in the markets. This indicator is described here.
To avoid the bear market, exit stocks when the spread between the 5-month and 25-month moving averages of S&P-real becomes negative and simultaneously the CAPE-Cycle-ID score is 0 or -2. (read more)
Estimated Forward 10-Year Returns
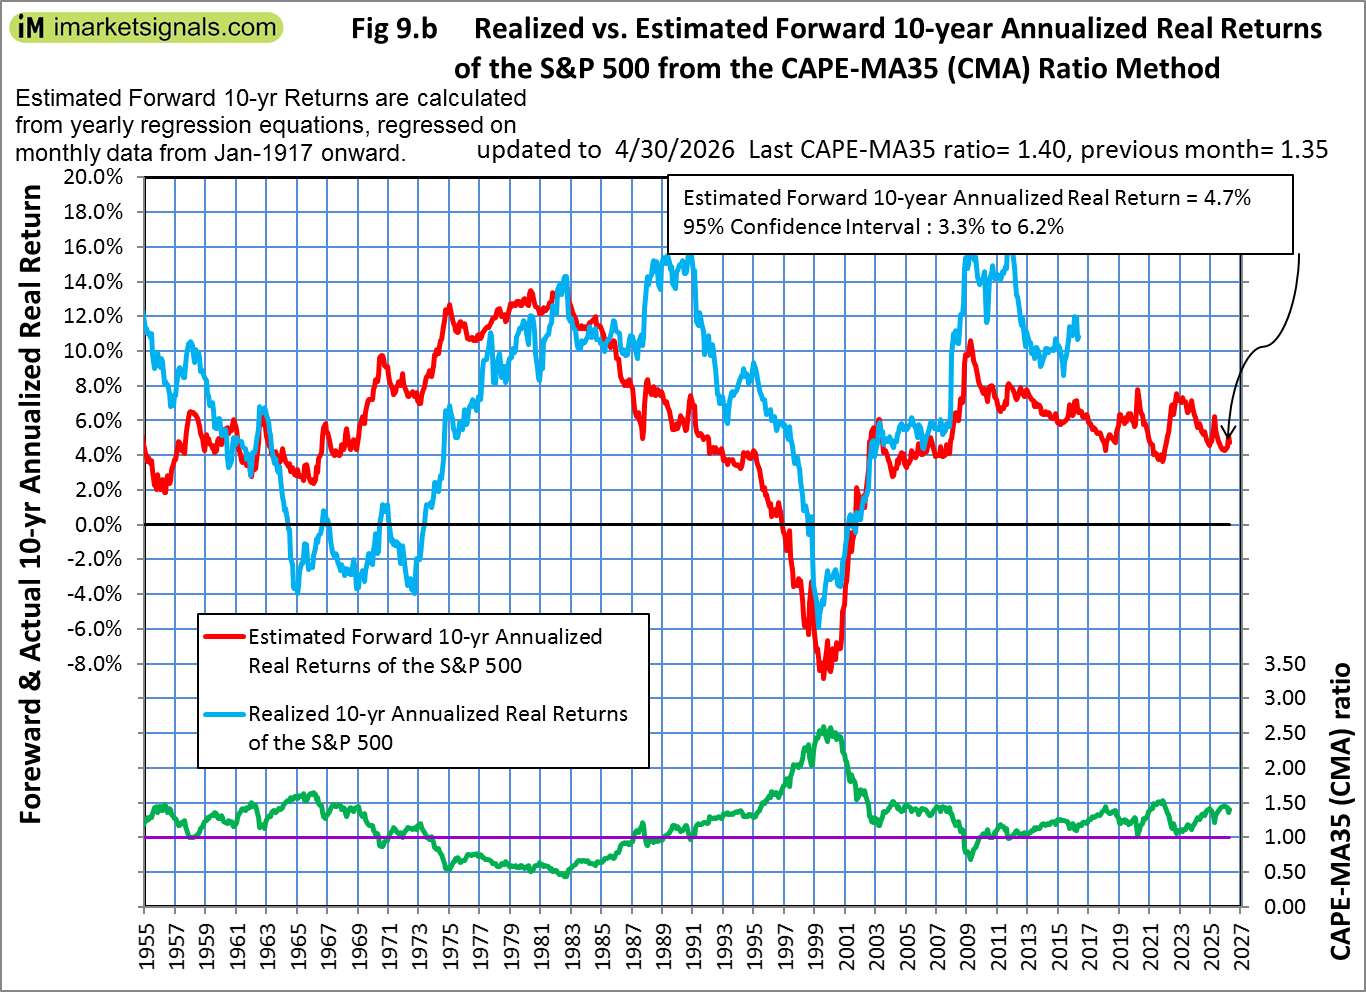 The estimated forward 10‐year annualized real return is 4.7% (previous month 5.0%) with a 95% confidence interval 3.3% to 6.2% (3.6% to 6.5%). Also refer to the Realized Forward 10-Year Returns vs. Inflation Rate
 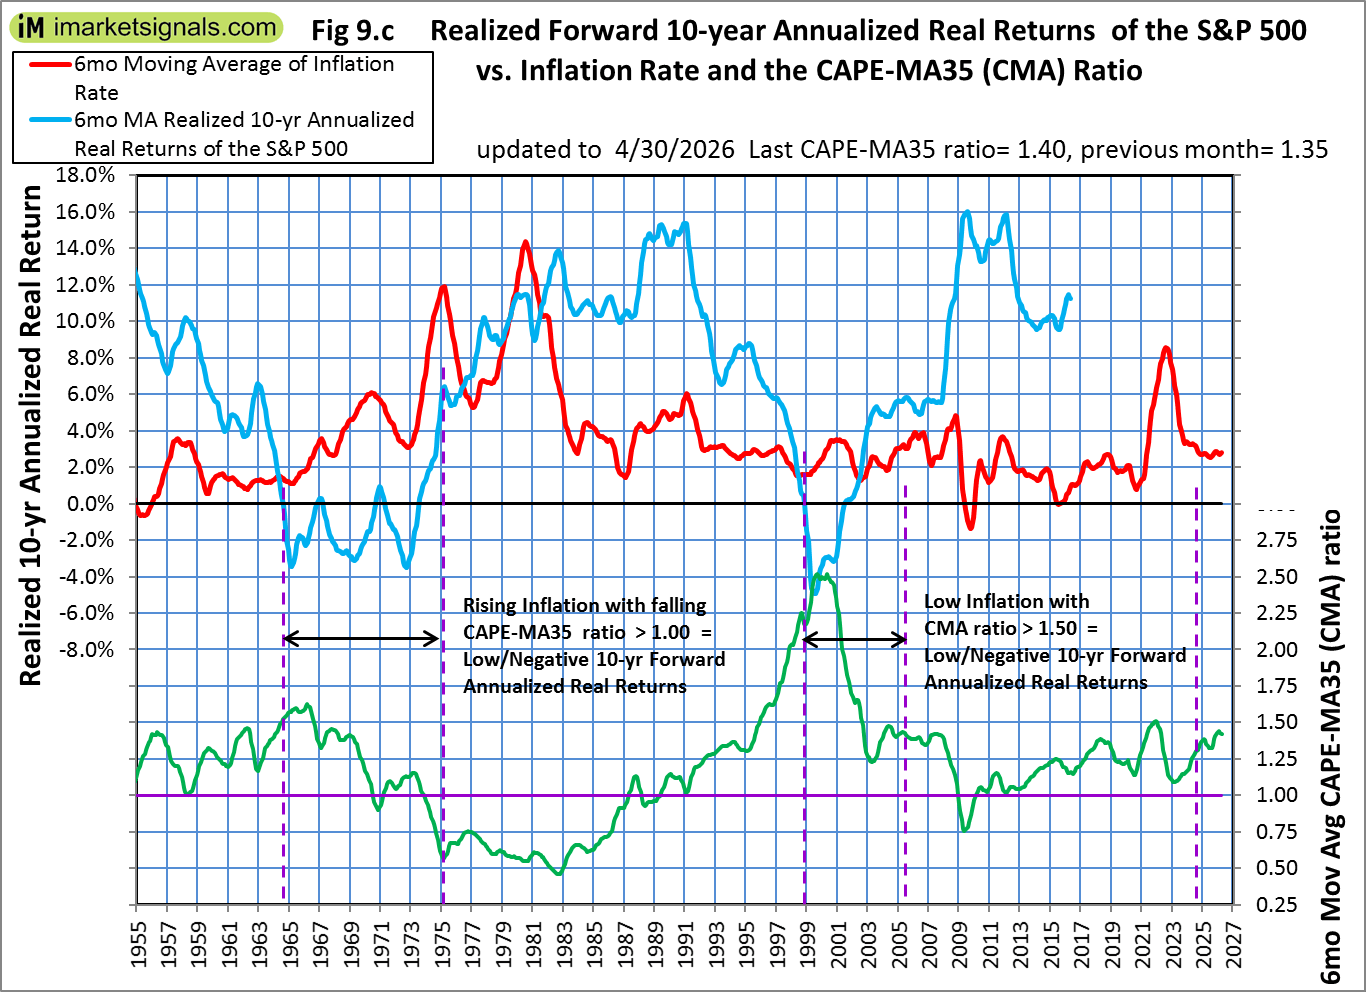 We may be in a rising inflation period with a falling CAPE-MA35 ratio similar to 1964-1973. This implies very low or negative 10 year forward annualized real returns, much lower than the returns indicated by regression analysis shown in the Estimated Forward 10-Year Returns.
.
iM-GT Timer
 The iM-GT Timer, based on Google Search Trends volume indicator is not invested in the stock markets since beginning November 2025. This indicator is described here.
Trade Weighted USD
 Will be updated later, the weekly FRED data series we used was discontinued and replacement series is daily and runs from 2015. We need to adapt our software and graphics first.
TIAA Real Estate Account
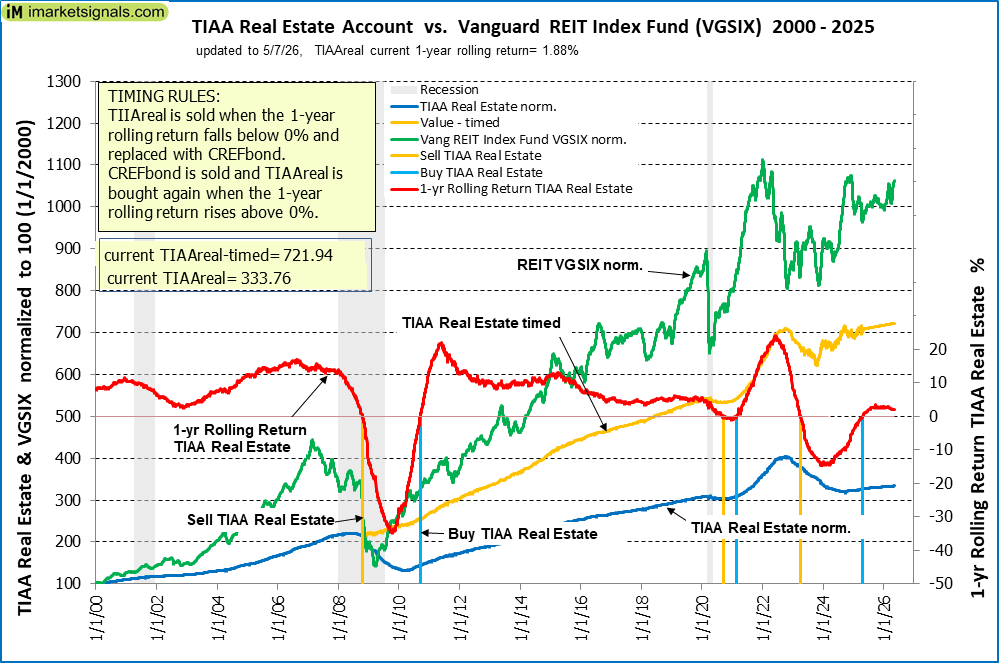 The 1-year rolling return is =1.88% (previous month 2.26%) and is invested in the TIAA Real Estate Account since beginning May 2025.