
- The Cyclically Adjusted Price to Earnings Ratio (CAPE ratio) is at 32.1, a very high level which signals overvaluation of stocks and low forward returns, according to Shiller.
- This level was only exceeded twice in the last 136 years, in Sep-1929 and from Jul-1997 to Jul-2001, with market declines of 77% and 45% then recorded.
- The Moving Average CAPE Ratio Methodology used here references stock market valuation to a 35-year moving average of the Shiller CAPE ratio instead of the 1881-2017 long-term average.
- Based on the 35-year moving average methodology, historic market performance points towards continuing up-market conditions, possibly for a number of years.
- To avoid the bear market, exit stocks when the spread between the 5-month and 25-month moving averages of S&P-real becomes negative and simultaneously the CAPE-Cycle-ID score is 0 or -2.
Shiller warns in his recent commentary The Coming Bear Market? :
“ The US stock market today looks a lot like it did at the peak before all 13 previous price collapses. That doesn’t mean that a bear market is imminent, but it does amount to a stark warning against complacency.”
He gives no guidance when the bear market will commence, which could be years away. The methodology used here provides information on how to avoid the coming bear market which the current high CAPE ratio may be signaling.
The CAPE Ratio
Shown at the top of Figure-1 is the real price of the S&P-Composite with dividends re-invested (S&P-real) from 1871 onward together with the best-fit line plotted to a semi-log scale. Below S&P-real is the CAPE ratio, which is the real price of the S&P 500 Index, divided by the arithmetic average of the last 10 years of real reported 12 months earnings per share of the Index, also referred to as P/E10.
The CAPE ratio is currently at a level of 32.1, 15.3 higher than its 1881-2016 long-term average of 16.8, which according to Shiller signals an expensive stock market. This high level was only exceeded twice in the past, Sep-1929 and from Jul-1997 to Jul-2001, with respective market declines of 77% and 45% then recorded from peak to trough.
It would have been premature to exit the market in Jul-1997 when the CAPE reached a level of 32.8 because the market gained another 60% to its peak three years later. However, this level would have been a good exit signal in Sep-1929 because the market peaked then and lost 77% thereafter.
It is apparent from those two previous records that a CAPE ratio becoming greater than 32 does not necessarily signal an imminent market collapse, and as such it is not a very useful indicator of expected market performance now; it only indicates that stocks are expensive.
The Moving Average CAPE Ratio Methodology
An alternative to Shiller’s approach is to assess stock market valuation using a 35-year moving average of the CAPE ratio (35MA), rather than referencing the valuation to the 1881-2017 long-term average. ( Article link)
This method should to some degree smooth or eliminate effects from changes to accounting practices, dividend policies, and other reporting parameters over time. A moving average over 35 years was chosen so that it would cover at least three business cycles based on the longest recent expansion and contraction period of 128 months (from Mar-1991 to Nov-2001).
Currently, the 35MA is at 23.0. (End of Sep-2017 it was at 22.8.) The difference between the CAPE ratio and the 35MA is equal to 32.1 – 23.0= 9.1, which is equal to 39.7% of the 35MA, and is termed “delta_MA35”.
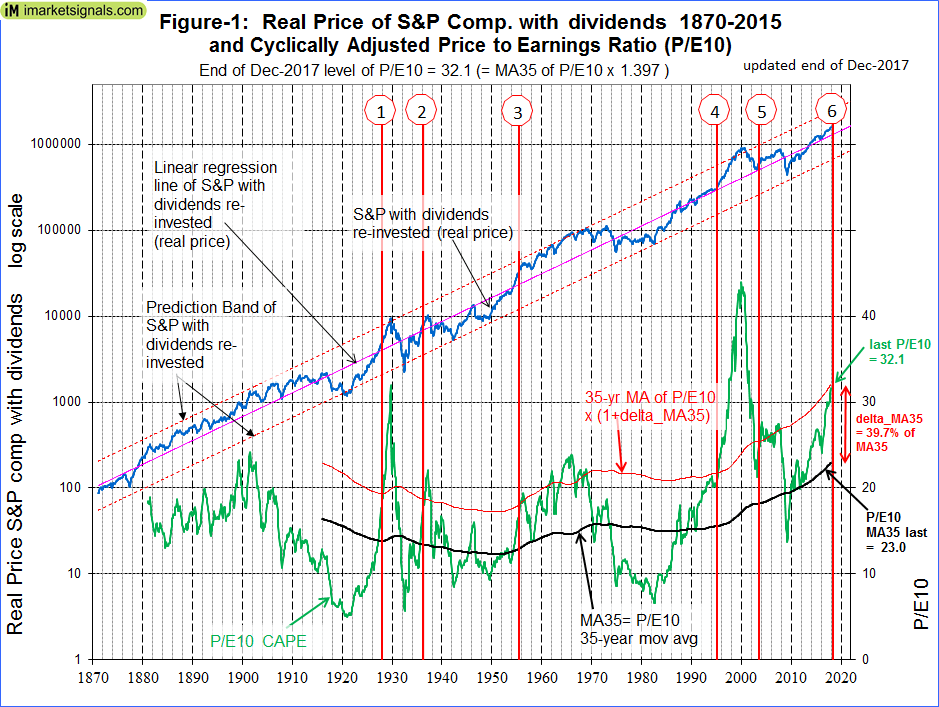
Five occasions, other than the most recent one, were identified when the CAPE moved from below to above a level of 35MA x 1.397, i.e. when similar conditions as the current one existed. (After Signal-3, five additional signals occurred before 1970. They were ignored since they all preceded the market low of Sep-1974 prior to Signal-4.)
After each delta_MA35 signal the market continued to gain for periods ranging from a few months to 13 years. Shiller is correct that the present Cape ratio “… doesn’t mean that a bear market is imminent”. One would have exited the market prematurely at the time of the delta_MA35 signals, missing out on substantial gains to the subsequent market highs.
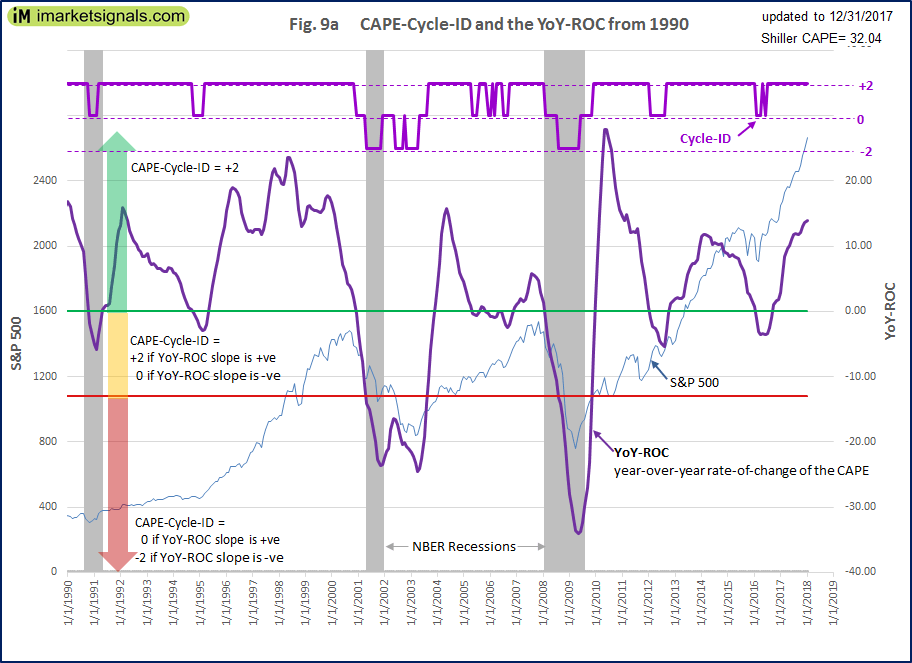
A better exit signal occurs when after a delta_MA35 signal of the current magnitude the spread between the 5-month and the 25-month moving averages of S&P-real changes from positive to negative and simultaneously the score of the CAPE-Cycle-ID is at 0 or -2.
The CAPE-Cycle-ID is graphed in the figure below, extracted from our monthly update of January 5, 2018.
Conclusion
The current level of the CAPE ratio relative to its 35-year moving average does suggest that stock prices are high. However, a bear market is not imminent and could be years away.
An exit signal after the CAPE moves from below to above a level of 35MA x 1.397 (the current condition) arises when subsequently the spread between the 5-month and 25-month moving averages of S&P-real changes from positive to negative and simultaneously the score of the CAPE-Cycle-ID is at 0 or -2.
Currently the 5-month moving average of S&P-real is higher than the 25-month moving average; the spread between them is positive, standing at +154,080 (higher than 3 months ago), and the CAPE-Cycle-ID score is +2. Therefore, the Moving Average CAPE Ratio Methodology is not signaling to exit the stock market now.
|
Date |
5-mo Moving Avg of S&P-real |
25-mo Moving Avg of S&P-real |
Spread |
CAPE Cycle-ID score |
|
2017.06 |
1,448,031 |
1,300,037 |
147,994 |
2 |
|
2017.07 |
1,456,115 |
1,309,430 |
146,685 |
2 |
|
2017.08 |
1,459,081 |
1,318,809 |
140,271 |
2 |
|
2017.09 |
1,463,209 |
1,329,977 |
133,232 |
2 |
|
2017.10 |
1,481,721 |
1,344,130 |
137,591 |
2 |
|
2017.11 |
1,501,116 |
1,358,014 |
143,103 |
2 |
|
2017.12 |
1,526,247 |
1,372,167 |
154,080 |
2 |
Will you update the above on a regular basis?
Yes, every 3 month.