- This ETF trading model uses the Conference Board Leading Economic Index to determine “Risk-On” periods for equities.
- A universe is defined from the SPDR, Vanguard, and PowerShares ETF providers for the sectors healthcare, energy, communication, technology, and general multi-sector funds, holding large-mega cap stocks from the United States.
- The model selects 3 ETFs from the previously defined universe at the beginning of a “Risk-On” period and holds these ETFs continuously until the end of the “Risk-On” period.
- During “Risk-Off” periods for equities it goes to the gold ETF (GLD) to maximize returns. ETF (BND) is also a suitable alternative to GLD.
- The simulation shows that this strategy would have produced over 7-times the total return of SPY with similar risk.

Blog Archives
Timing The Stock Market With The Conference Board Leading Economic Index
Stocks Are Moderately Overvalued but 10-Year Forward Returns Look Good: Update April 2023
- The average of S&P 500 for March-2023 was 3,969 (15% down from Dec-2021 average of 4,675) and is 384 points higher than the corresponding re-calibrated long-term trend value of 3,585.
- For the S&P 500 to reach the corresponding long-trend value would entail a 10% decline from the March average value, indicating that the S&P 500 is not significantly overvalued anymore.
- The Shiller CAPE-ratio is at 27.9, 8% higher than its 35-year moving average (MA35), currently at 25.9, forecasting a relatively high 10-year annualized real return of about 7.3%.
- The long-term trend indicates a forward 10-year annualized real return of 5.5%
- However, rising inflation with a falling CAPE-MA35 ratio, similar to what occurred in the period 1964-1973, implies very low or negative 10-year forward annualized real returns.
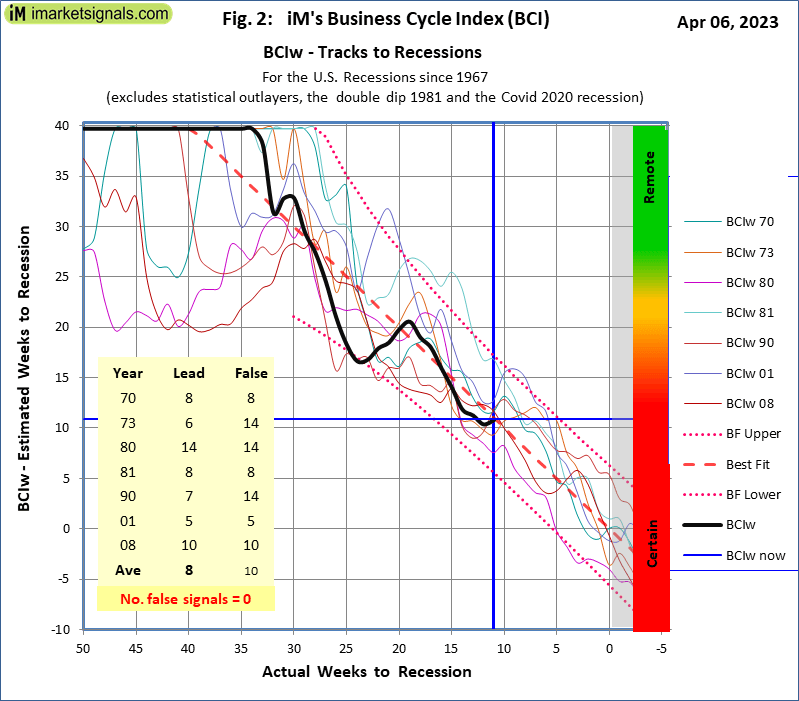
iM’s Business Cycle Index Signals an Imminent Recession – Update 4/7/2023
- Knowing when the U.S. economy is heading for recession is paramount to successful investment decisions.
- Our weekly Business Cycle Index would have provided early reliable warnings for the past seven recessions and signaled the Covid 2020 recession one week late.
- The Department of Labor backward revised nearly two years of seasonal adjusted data.
- The BCIg is now signalling a recession since mid March 2023 with a 12 weeks average lead time.
- The BCIw is now signalling a recession, earliest in 5 weeks but not later than 17 weeks.
Expect Further Losses For Stocks but 10-Year Forward Returns Look Better: Update December2022
- The average of S&P 500 for Nov-2022 was 3,917 (16% down from Dec-2021 average of 4,675) and is 385 points higher than the corresponding re-calibrated long-term trend value of 3,532.
- For the S&P 500 to reach the corresponding long-trend value would entail a 10% decline from the November average value, indicating that the S&P 500 is not significantly overvalued anymore.
- The Shiller CAPE-ratio is at 28.3, 10% higher than its 35-year moving average (MA35), currently at 25.8, forecasting a relatively high 10-year annualized real return of about 7.2%.
- The long-term trend indicates a forward 10-year annualized real return of 5.5%
- However, rising inflation with a falling CAPE-MA35 ratio, similar to what occurred in the period 1964-1973, implies very low or negative 10-year forward annualized real returns.
An Upcoming Recession is Signaled by the Forward Rate Ratio
- Prior to recession the yield curve becomes inverted, as indicated by the Forward Rate Ratio between the 2-year and 10-year U.S. Treasury yields (FRR2-10) being less than 1.00.
- The FRR2-10 crosses 1.000 downward signifying that US economic activity is in the boom phase of the business cycle, nearing the next recession.
- The average lead time after FRR2-10 becomes less than 1.00 to the subsequent recession start was 14 months for the seven of the eight last recessions.
Expect Further Losses For Stocks And Very Low 10-Year Forward Returns: Update July 2022
- The average of S&P 500 for May 2022 was 4,040 (14% down from December 2021 average) and is still 1,469 points higher than the corresponding long-term trend value of 2,571.
- For the S&P 500 to reach the long-trend would entail a 36% decline from the May average value, possibly over a short period.
- The Shiller CAPE-ratio is at a level of 31.0. That is 21% higher than its 35-year moving average (MA35), currently at 25.6.
- The CAPE-MA35 ratio is at 1.21 (down from the December 2021 level of 1.51), forecasting a 10-year annualized real return of about 6.3%.
- However, rising inflation with a falling CAPE-MA35 ratio, similar to what occurred in the period 1964-1973, implies very low or negative 10-year forward annualized real returns.
- The historic long-term trend indicates a 10-year forward real annualized return of only 1.9% (up from the December 2021 forecast of 0.2%).
The iM-Inflation Attuned Multi-Model Market Timer
- Investment risk can be reduced by a multi-model market timer whose many components use different and uncorrelated financial and economic data, including inflation.
- This model seeks to determine effective asset allocation for risk-on and risk-off periods for equities considering the effect of inflation.
- Four risk scenarios are possible: risk-on & normal-inflation, risk-on & high-inflation, risk-off & normal-inflation, and risk-off & high-inflation. Different ETF groups apply to each risk scenario.
- From 2000 to 2022, switching accordingly between risk-related ETF groups would have produced an annualized return of about 39% versus 6.5% for buy and hold SPY.
Evaluating Popular Asset Classes for Inflation Protection
- We tested nine asset classes which are supposed to provide protection against inflation according to an Investopedia article. The test period was from January 2005 to May 2022.
- Investopedia provides no definition for inflationary environment, but this analysis uses the 6-month moving average of the inflation rate and the University of Michigan: Inflation Expectation© series to define it.
- For this investigation we consider separately the inflationary periods which fall within the Risk-on and Risk-off phases for equities, as defined by the iM-Multi-Model Market Timer.
- From the asset classes listed by Investopedia only the Vanguard Real Estate ETF (VNQ) provided some inflation protection relative to the SPDR S&P 500 ETF (SPY).
- Better inflation protection is provided by energy sector ETFs XLE and PXE, but energy sector funds were not among the asset classes listed in the Investopedia article.
The Stock Market Has Peaked, S&P 500 Death Cross For The Ides Of March: Update March 2022
- The average of S&P 500 for February 2022 was 4436 (5% down from December 2021 average) and is still 1896 points higher than the corresponding long-term trend value of 2540.
- A reversal to the long-trend would entail a 43% decline, possibly over a short period aggravated by the imminent S&P500 death cross.
- The Shiller CAPE-ratio is at a level of 35.9 (down 7.2% from its recent peak of 38.7). That is 41% higher than its 35-year moving average (MA35), currently at 25.5.
- The CAPE-MA35 ratio is 1.41 (down from the end of December 2021 level of 1.51), forecasting a 10-year annualized real return of about 4.6%.
- The historic long-term trend indicates a 10-year forward real annualized return of only 0.8% (up from the end of December 2021 forecast of 0.2%).
The iM-Multi-Model Market Timer – Not Your Daddy’s Old Moving Average Crossover System
- Reliance on a single market timer is risky. The risk can be reduced by a multi-model market timer whose many components use different and uncorrelated financial and economic data.
- This model seeks to determine reliable risk-on and risk-off periods for the stock market. When there is no definite signal for risk-on or risk-off then the investment is considered risk-neutral.
- From 2000 to 2022, switching between ETFs RSP, VGT, SH, TIP, BIV and IEF would have produced an annualized return of 34.2% versus 7.0% for buy and hold SPY.
- The model is not a binary indicator between risk-on and risk-off and does not rely on leveraged ETFs to produce such high returns.
With reference to Section 202(a)(11)(D) of the Investment Advisers Act:
We are Engineers and not Investment Advisers,
read more ...
By the mere act of reading this page and navigating this site you acknowledge, agree to, and abide by the
Terms of Use / Disclaimer